5775 Sunnybrook Ct · Loveland, CO
Flood risk 1/10 · Minimal
- FEMA flood zone
- X (unshaded)
- Chance of flooding over 30 yrs
- 0.0%
- Est. flood insurance / yr
- $507 – $1,088
Fire risk 7/10 · Major
- Est. fire insurance / yr
- $939 – $1,743
Heat risk 3/10 · Minor
- Hot days now (above 92°F)
- 7 days/yr
- Hot days in 30 yrs
- 16 days/yr
Wind risk 1/10 · Minimal
- Chance of severe wind over 30 yrs
- —
Air-quality risk 5/10 · Moderate
- Unhealthy air days now
- 9 days/yr
- Unhealthy air days in 30 yrs
- 10 days/yr
Risk factors via First Street. Map © Google.
Why this score? — see what drove the B grade
The composite is a weighted blend of 9 inputs, each scored 0–100. Each bar is that input's sub-score; the figure is the points it added to the 100-point composite (weight × sub-score).
- Cash flow +30.0/30.0
- 1% rule +10.0/10.0
- DSCR +10.0/10.0
- ARV discount +9.0/15.0
- Livability +3.7/5.0
- Schools +3.4/10.0
- Rent growth +3.3/5.0
- Condition / age +2.2/5.0
- Appreciation +0.0/10.0
$85,500
🖨 Deal sheet (PDF) 📄 Offer letter ✓ Due diligence
Listing remarks MLS
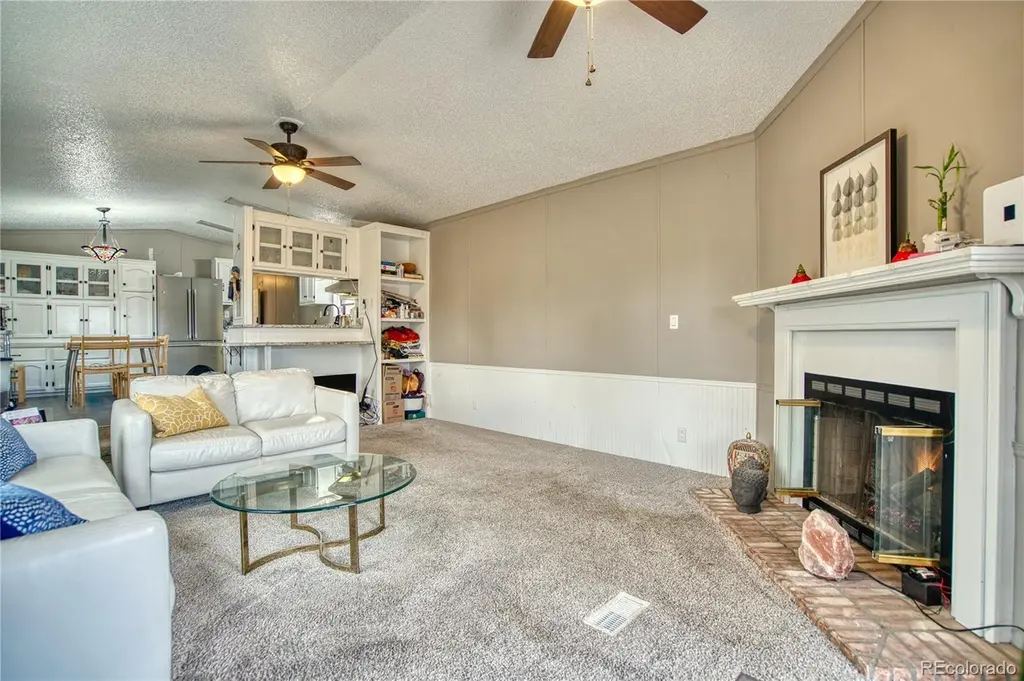
This beautiful recently renovated home is nestled at the base of the foothills in Loveland, CO. This unique home has so much to offer. As you walk into this home you will notice the open floorplan and rare step-down living room. The living room is very spacious and welcoming with its high vaulted ceilings, new carpet and beautiful fireplace. The large eat-in kitchen is well laid out with tons of cabinet space and storage. This kitchen has been upgraded with granite countertops, freshly painted cabinets and grey laminate flooring. The master bedroom is very spacious with two large side by side closets, freshly painted walls and new carpet.
Key facts
- Pet friendly park
- Gas fireplace
- Natural light
Tags
Property features AI
Finance
- Other: Property tax information available (tax year 2025)
- HOA & community: Land lease of $1,050 monthly (lease extends through April 17, 2099)
Exterior
- Parking: Two parking spaces
- Utilities: Public sewer
- Home design: Manufactured in-park home; Single-story / all main level; Individual ownership
- Construction: Frame construction; Built as a manufactured home
- Exterior features: Composition roof; Manufactured home located in a park; Monthly land lease in effect
Interior
- Bedrooms: Two main-level bedrooms
- Bathrooms: One full bathroom on the main level
- Heating & cooling: Forced air heating; Central air conditioning
- Interior features: Open living area (public records list 1,120 as living area); Located all on the main level
Neighborhood map
What this means for you Summary
Snapshot
- This is a 2-bed/1.0-bath manufactured listed at $86k. Condition is rated fair.
Deal economics
- At list price, monthly cash flow is $787 ($9k/yr) — positive.
- The deal already cash-flows at list — no discount required.
- Meets the 1% rule at list price ($2k rent vs $86k).
- Recommended offer: $80k (6.0% below list) — sets the bar for market timing.
- Cap rate 17.3% vs local median 2.9% in Loveland — top-decile yield for the area; either an underpriced asset or a hidden risk that comps aren't pricing in. Stress-test before assuming the spread holds.
Location & tenants
- Location reads 73/100 on livability (#52 in CO) — a middle-class / working-renter tenant base. Strengths: housing A+, health & safety A+, amenities A; Watch: crime C-, commute F, cost of living F.
- Thompson School District R-2J (suburban): math 28% / reading 48% proficiency, ranked #28 of 86 in CO (top 33%) — families likely to look elsewhere, expect single-tenant / working-renter base with shorter leases.
- Zoned schools: Cottonwood Plains Elementary School (math 15% / reading 32%, grade F, #634 of 966 statewide, top 67%, 386 students, 52% FRL); Lucile Erwin Middle School (math 18% / reading 35%, grade F, #160 of 270 statewide, top 60%, 712 students, 36% FRL); Loveland High School (math 35% / reading 71%, grade C-, #88 of 381 statewide, top 23%, 1,525 students, 28% FRL).
- Market conditions: Rents rising (+3.1%/yr); 436 active listings in the ZIP; 10 comparable units currently listed for rent nearby; rentals at typical pace (median 24d on market — plan ~3-4 weeks tenant-placement turnaround); solid renter incomes; 1,786 units permitted in Larimer County in 2024 (402 in 5+ unit buildings).
Forward outlook
- Local home prices are declining (-3.0%/yr); year-one equity from $591 of loan paydown is wiped out by about $3k of value loss. Plan a longer hold.
- Larimer County population projected at +51% by 2050 — long-run rental-demand tailwind backs the buy-and-hold thesis.
- At projected returns (-3.0% appreciation + 3.1% rent growth), your $24k cash investment doubles in ~3 years — after that, you're playing with house money.
Negotiation context
- It's been on market 62 days — a 6% lower offer ($80k) is reasonable based on typical stale-listing flexibility.
- 2 sale attempts since 4y ago with the ask held roughly flat each time — persistent listings suggest the price (not the market) is what's stuck; bring a comps-based counter.
Risks & watch-outs
- Climate carrying-cost: major wildfire risk — expect insurance premiums to compound above CPI over the hold.
Questions for the listing agent
- It's been on market 62 days. Have you received any prior offers? Is the seller open to a 6% concession, seller financing, or rate buy-down credit?
- Have any recent inspections been done? Can we get a copy of the seller's disclosures and any deferred-maintenance estimates?
- Why hasn't it sold? Are there any deal-killer items the seller is aware of (foundation, flood, title, zoning, code violations)?
- Is there a deadline driving the sale (1031 exchange, divorce, estate, relocation)? That informs how much negotiation room exists.
- What's the average days-on-market for RENTAL listings here right now (not sales)? A rising rental-DOM trend means longer vacancies and softer asking-rent achievability than the comps imply.
- What's the recent tenant-quality profile in this submarket — average credit score on applications, eviction rate, late-payment / NSF rate, and stable-employment percentage? A property-management company in the area should have these aggregated.
- How much new for-sale + rental construction is in the pipeline within 1–3 miles? Heavy new supply typically softens prices + rents 12–24 months out; constrained supply supports both.
Investment metrics
- 1% rule
- 2.04% ✓
- Cap rate
- 17.34%
- Cash-on-cash
- 39.47%
- DSCR
- 2.76
- GRM
- 4.1
CMA / ARV
- ARV (on-the-fly)
- $88,480
- Comps found
- 12
Show comp detail 12 sales within ~0.75 mi
| Address | Dist | Beds/Ba | Sqft | Sold | Price | $/sf | Match |
|---|---|---|---|---|---|---|---|
| 5852 Lake View Ct #102 | 0.00mi | 2/2.0 | 1,152 (+3%) | 6mo | $69,500 | $60 | 86 |
| 5816 Lake View Ct | 0.00mi | 3/2.0 (+1) | 1,216 (+9%) | 6mo | $39,000 | $32 | 72 |
| 420 E 57th St #297 | 0.25mi | 3/2.0 (+1) | 1,078 (-4%) | 4mo | $110,000 | $102 | 70 |
| 420 E 57th Street #223 | 0.25mi | 3/2.0 (+1) | 1,056 (-6%) | 3mo | $99,000 | $94 | 68 |
| 605 W 57th St #6 | 0.62mi | 2/2.0 | 1,088 (-3%) | 1mo | $81,000 | $74 | 62 |
| 605 W 57th St #34 | 0.62mi | 2/2.0 | 1,088 (-3%) | 2mo | $74,999 | $69 | 60 |
| 605 W 57th St #20 | 0.62mi | 2/2.0 | 1,088 (-3%) | 6mo | $86,200 | $79 | 57 |
| 605 W 57th St #42 | 0.62mi | 2/2.0 | 1,056 (-6%) | 2mo | $89,900 | $85 | 56 |
| 605 W 57th St | 0.62mi | 2/2.0 | 1,056 (-6%) | 2mo | $89,900 | $85 | 56 |
| 221 W 57th St Unit 90A | 0.30mi | 3/2.0 (+1) | 1,280 (+14%) | 0mo | $42,000 | $33 | 53 |
| 605 W 57th St #64 | 0.62mi | 2/2.0 | 1,024 (-9%) | 1mo | $89,000 | $87 | 52 |
| 221 W 57th St | 0.54mi | 3/2.0 (+1) | 1,280 (+14%) | 0mo | $42,000 | $33 | 42 |
Match score weights: distance 35% · size 25% · config 20% · recency 20%. Top-matched comps best support the ARV.
Projected returns pro-forma
-3.0% appreciation · 3.11% rent growth · sell at horizon
- IRR
- 35.9%
- Equity multiple
- 2.53×
- Total profit
- $36,515
- Equity at exit
- $12,748
- IRR
- 42.7%
- Equity multiple
- 5.06×
- Total profit
- $97,274
- Equity at exit
- $7,392
Cash invested: $23,940 (down + closing). Projections, not guarantees.
Landlord ↔ Tenant lean methodology
- Overall (STATE)
- 38 Tenant-Leaning
- State Colorado
- 38 Tenant-Leaning · D+4
- County
- — inherits STATE
- City
- — inherits STATE
ZIP-level market 80538
- Rents YoY
- 3.1%
- Active inventory
- 436
- Price-to-rent
- 4.1×
Monthly cashflow live
- Estimated rent
- $1,745 high interval (Pro) →
- Mortgage (P&I)
- −$448
- Tax est. 1.5%
- −$107 /mo · $1,282/yr
- Insurance
- −$36
- HOA
- −$0
- Vacancy / Maint / Mgmt
- −$366
- Net cashflow
- $787
Break-even live
Sensitivity live
| Price | -10% $846 | -5% $817 | +0% $787 | +5% $758 | +10% $728 |
|---|---|---|---|---|---|
| Rent | -10% $650 | -5% $718 | +0% $787 | +5% $856 | +10% $925 |
| Rate | -1.0pp $830 | -0.5pp $809 | base $787 | +0.5pp $765 | +1.0pp $743 |
UW: 25.0% down · 7.5% · 30yr · 1.5% tax · 5.0% vac · 8.0% maint · 8.0% mgmt
Financing live
Cash to close
- Down payment
- $21,375
- Closing costs
- $2,565
- Reserves months
- —
- Total cash needed
- —
Loan-product check · same deal, 3 products live
Conventional
25% down · 7.5% · 30yr
- Down + closing
- —
- Monthly P&I
- —
- Monthly cashflow
- —
- DSCR
- —
- Eligible?
- —
Personal DTI + credit; lowest rate.
DSCR
20% down · 8.5% · 30yr
- Down + closing
- —
- Monthly P&I
- —
- Monthly cashflow
- —
- DSCR
- —
- Eligible?
- —
No personal income docs; deal must DSCR.
Hard money
10% down · 12.0% · 12mo
- Down + closing
- —
- Monthly P&I
- —
- Monthly cashflow
- —
- DSCR
- —
- Eligible?
- —
Short-term bridge; refi at stabilization.
Rent comps 10 comps
| Address | Beds | Baths | Sqft | Rent | $/sqft | DOM | Units | Dist |
|---|---|---|---|---|---|---|---|---|
| 6444 Eden Garden Dr Loveland, CO | 1.0–3.0 | 1.0–2.0 | 1033 | $1,850 | $1.79 | 24d | 1 | 0.61mi |
| 4950 Basswood Dr Unit 4952 Loveland, CO | 2.0 | 1.0 | 930 | $1,495 | $1.61 | 14d | 1 | 0.69mi |
| 4952 Basswood Dr Loveland, CO | 2.0 | 1.0 | 930 | $1,619 | $1.74 | 14d | 1 | 0.70mi |
| 4927 Basswood Dr Loveland, CO | 2.0 | 1.0 | 900 | $1,695 | $1.88 | 14d | 1 | 0.74mi |
| 4885 Basswood Dr Loveland, CO | 2.0 | 2.0 | 894 | $1,595 | $1.78 | 24d | 1 | 0.79mi |
| 4838 Basswood Dr Loveland, CO | 2.0 | 1.0 | 936 | $1,433 | $1.53 | 24d | 1 | 0.82mi |
| 4832 Basswood Dr Unit 4838 Loveland, CO | 2.0 | 1.0 | 936 | $1,300 | $1.39 | 24d | 1 | 0.82mi |
| 4830 N Grant Ave Loveland, CO | 1.0–3.0 | 1.0–2.0 | 866 | $1,662 | $1.92 | 24d | 1 | 0.85mi |
| 171 E 42nd St Loveland, CO | 1.0 | 1.5 | 889 | $1,900 | $2.14 | 24d | 1 | 1.23mi |
| 1375 W 45th St Loveland, CO | 3.0 | 2.0 | 1221 | $2,480 | $2.03 | 24d | 1 | 1.46mi |
Listing history 20 events
-
2026-06-18days on market $85,500 Active 62 DOM
-
2026-06-17days on market $85,500 Active 61 DOM
-
2026-06-16days on market $85,500 Active 60 DOM
-
2026-06-15days on market $85,500 Active 59 DOM
-
2026-06-14days on market $85,500 Active 57 DOM
-
2026-06-13days on market $85,500 Active 56 DOM
-
2026-06-10days on market $85,500 Active 54 DOM
-
2026-06-09days on market $85,500 Active 53 DOM
-
2026-06-08days on market $85,500 Active 52 DOM
-
2026-06-07pricedays on market $85,500 Active 51 DOM
-
2026-06-03days on market $86,800 Active 47 DOM
-
2026-06-02days on market $86,800 Active 46 DOM
-
2026-06-01days on market $86,800 Active 45 DOM
-
2026-05-31days on market $86,800 Active 44 DOM
-
2026-05-30days on market $86,800 Active 43 DOM
-
2026-05-04price $86,800
-
2026-04-17$87,500 Active
-
2022-03-11soldstatus $74,500 Closed 647-char remark
Show marketing remark (647 chars)
This beautiful recently renovated home is nestled at the base of the foothills in Loveland, CO. This unique home has so much to offer. As you walk into this home you will notice the open floorplan and rare step-down living room. The living room is very spacious and welcoming with its high vaulted ceilings, new carpet and beautiful fireplace. The large eat-in kitchen is well laid out with tons of cabinet space and storage. This kitchen has been upgraded with granite countertops, freshly painted cabinets and grey laminate flooring. The master bedroom is very spacious with two large side by side closets, freshly painted walls and new carpet.
-
2022-02-22status Pending Accepting Backup Offers 647-char remark
Show marketing remark (647 chars)
This beautiful recently renovated home is nestled at the base of the foothills in Loveland, CO. This unique home has so much to offer. As you walk into this home you will notice the open floorplan and rare step-down living room. The living room is very spacious and welcoming with its high vaulted ceilings, new carpet and beautiful fireplace. The large eat-in kitchen is well laid out with tons of cabinet space and storage. This kitchen has been upgraded with granite countertops, freshly painted cabinets and grey laminate flooring. The master bedroom is very spacious with two large side by side closets, freshly painted walls and new carpet.
-
2022-01-10$74,900 Active 647-char remark
Show marketing remark (647 chars)
This beautiful recently renovated home is nestled at the base of the foothills in Loveland, CO. This unique home has so much to offer. As you walk into this home you will notice the open floorplan and rare step-down living room. The living room is very spacious and welcoming with its high vaulted ceilings, new carpet and beautiful fireplace. The large eat-in kitchen is well laid out with tons of cabinet space and storage. This kitchen has been upgraded with granite countertops, freshly painted cabinets and grey laminate flooring. The master bedroom is very spacious with two large side by side closets, freshly painted walls and new carpet.
ⓘ Source: listings_history table (triggers on properties + properties_extension) + one-shot
backfill from property_details.listing_events for pre-trigger history.
Climate risk First Street
- Flood 1/10 Low FEMA zone X (unshaded) · 0% chance over 30 yrs
- Wildfire 7/10 Severe
- Heat 3/10 Moderate 7 d/yr ≥92°F today · 16 d/yr by 30 yrs out
- Wind 1/10 Low
- Air quality 5/10 Major 9 unhealthy d/yr today · 10 by 30 yrs out
Nearby sold comps map
Loading sold comps map…
Walkable amenities ~0.75 mi
Loading nearby amenities…
Taxation est. · year 1
- Rental income
- $20,936
- − Mortgage interest
- −$4,789
- − Property taxes
- −$1,282
- − Insurance
- −$428
- − Repairs & maintenance
- −$1,675
- − Management
- −$1,675
- − Depreciation
- −$2,487
- Taxable income
- $8,599
- Est. tax owed @ 24.0%
- −$2,064
- After-tax cash flow
- $7,385/yr
For passive investors: Depreciation is non-cash, so a rental often shows a tax loss while cash-flowing — sheltering income. Rental losses are passive: they offset passive income freely, and up to $25,000/yr can offset ordinary (W-2) income if you actively participate and your MAGI is under $100k (phasing out to $0 by $150k); unused losses carry forward. On sale, claimed depreciation is recaptured at up to 25%, and gains may owe capital-gains tax (a 1031 exchange can defer both). Figures are a year-1 estimate at your 24.0% rate — not tax advice; consult a CPA.
Condition & rehab AI · 12 photos
This home requires moderate repairs and maintenance, with potential for significant value increase through updates to the interior and exterior.
Repairs flagged
- Minor kitchen cabinets — slight wear
- Minor bathroom vanity — slight wear
- Moderate exterior siding — weathered
- Moderate flooring — carpeted living room, hardwood kitchen
Value-add opportunities
- Resale paint interior walls — enhances curb appeal
- Both replace carpet with hardwood — increases both resale and rental value
- Both repair and paint exterior siding — enhances curb appeal and increases rental value
Renovation cost estimate screening
| Repair item | Severity | Est. cost |
|---|---|---|
| kitchen cabinets · slight wear | Minor | $500–3,000 |
| bathroom vanity · slight wear | Minor | $500–3,000 |
| exterior siding · weathered | Moderate | $3,000–15,000 |
| flooring · carpeted living room, hardwood kitchen | Moderate | $3,000–15,000 |
| Total estimated repair cost · 4 items | $7,000–36,000 |
Value-add ROI direction
- Resale paint interior walls — enhances curb appeal ↑
- Both replace carpet with hardwood — increases both resale and rental value ↑
- Both repair and paint exterior siding — enhances curb appeal and increases rental value ↑
ⓘ Cost ranges are severity-bucket heuristics (US national rule-of-thumb). Get contractor quotes + a written scope before underwriting a rehab budget.
Schools (NCES district)
- District
- Thompson School District R-2J
- NCES district ID
- 0805400
- Math proficiency
- 28% ▼ -7.00%
- Reading proficiency
- 48% ▬ 0.00%
- Median HH income
- $63,040
- Composite
- 34.01/100
- National rank
- #5313
- State rank
- #28 of 86 in CO
Livability — Loveland
- Score
- 73/100
- State rank
- #52
- US rank
- #5353
Category grades
Schools grade is shown separately in the Schools card above.
Census & demographics
- County
- Larimer County · 338,255 people
- City population
- 94,535
- Metro
- Fort Collins, CO
- Population (ZIP)
- 50,110
- Household income
- $86,671
- Rent vs Own
- Severe rent burden
- 1447.0
Population outlook (Larimer County) Hauer SSP2
- Today (2025)
- 415,361 people
- By 2030
- 457,762 · +10.2%
- By 2040
- 542,310 · +30.6%
- By 2050
- 627,048 · +51.0%
- By 2075
- 833,722 · +100.7%
- By 2100
- 952,590 · +129.3%
Race, ethnicity, and origin ACS 2023
- Neighborhood character
- Predominantly White (80%)
- Race & ethnicity
- White 80% Hispanic / Latino 15% Two or more races 10% Black 1%
- Hispanic origin (detail)
- Mexican 12%
- Common ancestry
- Italian 5% Lithuanian 3% Slovak 3%
- Foreign-born
- 4% · Canada, China
- Languages at home
- 93% English-only · Spanish 6%
Political lean MEDSL · Larimer
- 2024 margin
- D (+17.6) · D 57.4% · R 39.8% · Other 2.9%
- 2008→2024 swing
- +7.9pp toward D · 2008: 9.7pp · 2024: 17.6pp
- All cycles
- 2024: D+17.6 2020: D+15.4 2016: D+4.9 2012: D+5.2 2008: D+9.7
Not yet ingested
- Civics
- —
Market trends
- HPI YoY
- ▼ -515.25%
- Current HPI
- 242.9397
- Rent YoY
- ▲ 3.11%
- Metro
- Fort Collins, CO
- State GDP YoY
- ▲ 1.95%
- F500 in state
- 14
Industry mix (Fortune 500 HQ in CO)
| Industry | F500 HQs | Revenue |
|---|---|---|
| Technology Distribution | 1 | $31B |
|
||
| Food / Agriculture | 1 | $18B |
|
||
| Packaging | 1 | $14B |
|
||
| Healthcare | 1 | $13B |
|
||
| Energy | 1 | $10B |
|
||
| Technology | 1 | $4B |
|
||
Price history
+15.9% since first listed5 events — show timeline
- 2026-05-04 Price Changed $86,800 REColorado as Distributed by MLS Grid
- 2026-04-17 Listed $87,500 REColorado as Distributed by MLS Grid
- 2022-03-11 Sold (MLS) $74,500 REColorado as Distributed by MLS Grid
- 2022-02-22 Pending — REColorado as Distributed by MLS Grid
- 2022-01-10 Listed $74,900 REColorado as Distributed by MLS Grid
Cash-flow waterfall
monthlySold comps — $/sqft
last 12 mo · ≤1 miLoading sold comps…