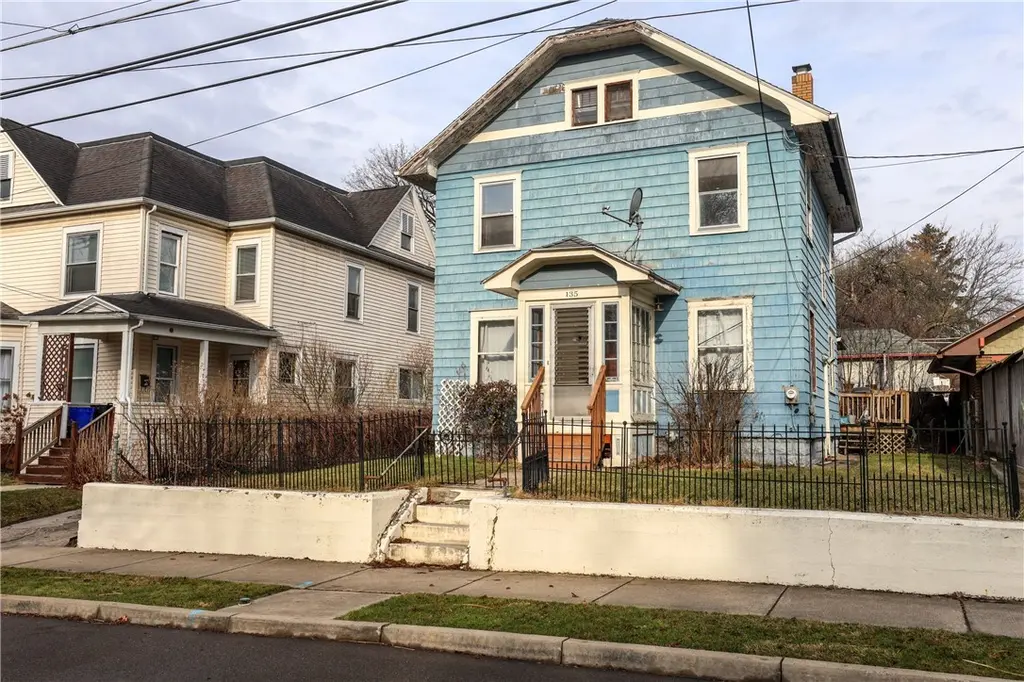
135 Crestmont Rd · Binghamton, NY
Flood risk 1/10 · Minimal
- FEMA flood zone
- X
- Chance of flooding over 30 yrs
- 0.0%
- Est. flood insurance / yr
- $473 – $860
Fire risk 2/10 · Minimal
- Est. fire insurance / yr
- $691 – $1,283
Heat risk 3/10 · Minor
- Hot days now (above 92°F)
- 7 days/yr
- Hot days in 30 yrs
- 16 days/yr
Wind risk 2/10 · Minimal
- Chance of severe wind over 30 yrs
- 1.0%
Air-quality risk 2/10 · Minimal
- Unhealthy air days now
- 0 days/yr
- Unhealthy air days in 30 yrs
- 1 days/yr
Risk factors via First Street. Map © Google.
Why this score? — see what drove the B grade
The composite is a weighted blend of 9 inputs, each scored 0–100. Each bar is that input's sub-score; the figure is the points it added to the 100-point composite (weight × sub-score).
- Cash flow +26.4/30.0
- ARV discount +15.0/15.0
- 1% rule +9.5/10.0
- DSCR +9.0/10.0
- Rent growth +5.0/5.0
- Livability +3.9/5.0
- Schools +3.0/10.0
- Condition / age +2.5/5.0
- Appreciation +0.0/10.0
$115,000
🖨 Deal sheet 📄 Offer letter ✓ Due diligence
Listing remarks
This 3-4 bedroom cutie pie is just waiting for someone to finish renovating it! The inside has had a bit of a refresh already and has been very well maintained over the years. It just needs a little more love and then it will shine as bright as new! Plenty of off street parking available. Easy to maintain fenced yard. Hardwood floors in the majority of 1st and 2nd floors. Full walk up attic offers extensive amounts of storage. The full basement is very dry and has been recently cleaned and painted. This is such a rare opportunity to get into a highly desirable area at an approachable price point! Surrounded by well maintained homes, this property offers strong potential for value growth wit
Key facts
- Off street parking
- Walk up attic
- Fenced yard
Tags
Property features AI
Exterior
- Parking: No garage; No driveway
- Utilities: Public water (connected); Sewer connected
- Home design: 2-story home; Resale property
- Construction: Wood siding exterior; Block foundation; Existing construction
- Exterior features: Rectangular residential lot; City street frontage; Lot dimensions approximately 40 x 67
Interior
- Kitchen: Gas oven; Gas range
- Bedrooms: One bedroom on the main level
- Flooring: Hardwood; Laminate; Varies
- Bathrooms: One full bathroom; One half bathroom; One main-level bathroom
- Heating & cooling: Gas heating; Hot water heating
- Interior features: Separate/formal dining room; Separate/formal living room
- Laundry & utility: Laundry located in the basement; Gas water heater
Neighborhood map
What this means for you Summary
Snapshot
- This is a 3-bed/1.5-bath single-family listed at $115k.
Deal economics
- At list price, monthly cash flow is $299 ($4k/yr) — positive.
- The deal already cash-flows at list — no discount required.
- Meets the 1% rule at list price ($2k rent vs $115k).
- Recommended offer: $113k (1.5% below list) — sets the bar for market timing.
- Cap rate 9.4% vs local median 6.4% in Binghamton — top-decile yield for the area; either an underpriced asset or a hidden risk that comps aren't pricing in. Stress-test before assuming the spread holds.
Location & tenants
- Location reads 78/100 on livability (#174 in NY, #2,710 nationally) — a middle-class / working-renter tenant base. Strengths: amenities A+, commute A+, cost of living A+; Watch: schools D, crime F, employment F.
- Binghamton City School District (urban): math 30% / reading 44% proficiency, ranked #557 of 590 in NY (top 94%) — families likely to look elsewhere, expect single-tenant / working-renter base with shorter leases; 61% free/reduced lunch — lower-income household profile, screen leases tightly.
- Market conditions: Rents rising fast (+11.2%/yr); 136 active listings in the ZIP; 30 comparable units currently listed for rent nearby; rentals lingering (median 44d on market — plan ~5-8 weeks vacancy on turnover, expect pricing pressure); 50% of comp listings sitting > 30 days — soft ceiling on asking rent; 340 units permitted in Broome County in 2024 (269 in 5+ unit buildings).
- This rent runs 37% of the median local income ($53k/yr) — at the standard rent-burdened threshold; future hikes will face affordability resistance.
Forward outlook
- Local home prices are declining (-3.0%/yr); year-one equity from $795 of loan paydown is wiped out by about $3k of value loss. Plan a longer hold.
- Broome County population projected at -13% by 2050 — secular population decline; favor cash flow + early exit over multi-decade hold.
- At projected returns (-3.0% appreciation + 8.0% rent growth), your $32k cash investment doubles in ~7 years — after that, you're playing with house money.
Negotiation context
- It's been on market 17 days — a 2% lower offer ($113k) is reasonable based on typical stale-listing flexibility.
- Current owner paid $25k; list at $115k implies a 360% gain — meaningful room to come down on a strong offer.
Risks & watch-outs
- Watch-outs: property tax is 3.8% of price; built in 1910 — expect roof / HVAC / electrical / plumbing capex.
Questions for the listing agent
- Built in 1910 — when were the roof, HVAC, electrical panel, plumbing, and water heater last replaced?
- Property tax is high relative to price — has the assessment been appealed recently, and will the sale trigger a re-assessment?
- Is there a deadline driving the sale (1031 exchange, divorce, estate, relocation)? That informs how much negotiation room exists.
- Schools are D-rated, which usually means shorter tenancies and higher turnover. Who's the typical renter profile here, and what's been the actual vacancy rate?
- Crime grade is F in this area — have there been break-ins, vandalism, or insurance claims at this property in the last 3 years? What carrier currently insures it and at what premium?
- What's the average days-on-market for RENTAL listings here right now (not sales)? A rising rental-DOM trend means longer vacancies and softer asking-rent achievability than the comps imply.
- What's the recent tenant-quality profile in this submarket — average credit score on applications, eviction rate, late-payment / NSF rate, and stable-employment percentage? A property-management company in the area should have these aggregated.
- How much new for-sale + rental construction is in the pipeline within 1–3 miles? Heavy new supply typically softens prices + rents 12–24 months out; constrained supply supports both.
Investment metrics
- 1% rule
- 1.45% ✓
- Cap rate
- 9.41%
- Cash-on-cash
- 11.14%
- DSCR
- 1.50
- GRM
- 5.8
CMA / ARV
- ARV (on-the-fly)
- $172,800
- Comps found
- 12
Show comp detail 12 sales within ~0.75 mi
| Address | Dist | Beds/Ba | Sqft | Sold | Price | $/sf | Match |
|---|---|---|---|---|---|---|---|
| 6 Aberystwyth Pl | 0.35mi | 3/1.5 | 1,416 (+5%) | 4mo | $166,000 | $117 | 72 |
| 19 Stokes Ave | 0.42mi | 3/1.0 | 1,369 (+1%) | 5mo | $175,000 | $128 | 72 |
| 134 Matthews St | 0.20mi | 3/1.0 | 1,239 (-8%) | 5mo | $144,000 | $116 | 71 |
| 22 Park St | 0.24mi | 3/1.0 | 1,200 (-11%) | 2mo | $175,257 | $146 | 67 |
| 88 Crestmont Rd | 0.26mi | 4/2.0 (+1) | 1,268 (-6%) | 7mo | $193,000 | $152 | 65 |
| 118 Helen St | 0.34mi | 2/1.0 (-1) | 1,260 (-7%) | 6mo | $158,000 | $125 | 61 |
| 8 Beverly Pl | 0.40mi | 3/1.5 | 1,163 (-14%) | 1mo | $152,580 | $131 | 57 |
| 119 Lincoln Ave | 0.52mi | 3/1.0 | 1,248 (-8%) | 5mo | $120,000 | $96 | 57 |
| 3 Cleveland Ave | 0.40mi | 3/2.0 | 1,152 (-15%) | 5mo | $154,500 | $134 | 51 |
| 53 Thorp St | 0.71mi | 3/1.5 | 1,445 (+7%) | 8mo | $135,000 | $93 | 48 |
| 9 Adams Ave | 0.70mi | 2/1.5 (-1) | 1,240 (-8%) | 6mo | $155,000 | $125 | 44 |
| 36 Narwood St | 0.65mi | 4/1.5 (+1) | 1,540 (+14%) | 8mo | $202,250 | $131 | 35 |
Match score weights: distance 35% · size 25% · config 20% · recency 20%. Top-matched comps best support the ARV.
Projected returns pro-forma
-3.0% appreciation · 8.0% rent growth · sell at horizon
- IRR
- 7.0%
- Equity multiple
- 1.29×
- Total profit
- $9,357
- Equity at exit
- $17,147
- IRR
- 20.9%
- Equity multiple
- 3.28×
- Total profit
- $73,319
- Equity at exit
- $9,943
Cash invested: $32,200 (down + closing). Projections, not guarantees.
Landlord ↔ Tenant lean methodology
- Overall (STATE)
- 15 Strongly Tenant-Friendly
- State New York
- 15 Strongly Tenant-Friendly · D+10
- County
- — inherits STATE
- City
- — inherits STATE
ZIP-level market 13905
- Home prices YoY
- -31.1%
- Rents YoY
- 11.2%
- Active inventory
- 136
- Price-to-rent
- 5.8×
Monthly cashflow live
- Estimated rent
- $1,663 high interval (Pro) →
- Mortgage (P&I)
- −$603
- Tax from tax record
- −$364 /mo · $4,365/yr
- Insurance
- −$48
- HOA
- −$0
- Vacancy / Maint / Mgmt
- −$349
- Net cashflow
- $299
Break-even live
UW: 25.0% down · 7.5% · 30yr · 1.5% tax · 5.0% vac · 8.0% maint · 8.0% mgmt
Financing live
Cash to close
- Down payment
- $28,750
- Closing costs
- $3,450
- Reserves months
- —
- Total cash needed
- —
Loan-product check · same deal, 3 products live
Conventional
25% down · 7.5% · 30yr
- Down + closing
- —
- Monthly P&I
- —
- Monthly cashflow
- —
- DSCR
- —
- Eligible?
- —
Personal DTI + credit; lowest rate.
DSCR
20% down · 8.5% · 30yr
- Down + closing
- —
- Monthly P&I
- —
- Monthly cashflow
- —
- DSCR
- —
- Eligible?
- —
No personal income docs; deal must DSCR.
Hard money
10% down · 12.0% · 12mo
- Down + closing
- —
- Monthly P&I
- —
- Monthly cashflow
- —
- DSCR
- —
- Eligible?
- —
Short-term bridge; refi at stabilization.
Rent comps 30 comps
| Address | Beds | Baths | Sqft | Rent | $/sqft | DOM | Units | Dist |
|---|---|---|---|---|---|---|---|---|
| 133 Crestmont Rd Unit 2 Binghamton, NY | 3.0 | 1.0 | 1300 | $1,900 | $1.46 | 43d | 1 | 0.03mi |
| 263 Main St Binghamton, NY | 2.0 | 1.0 | 920 | $1,200 | $1.30 | 13d | 1 | 0.12mi |
| 296 Main St Unit 6 Binghamton, NY | 3.0 | 1.0 | 1200 | $1,250 | $1.04 | 13d | 1 | 0.17mi |
| 129 Helen St Unit 1 Binghamton, NY | 4.0 | 2.0 | 1850 | $2,200 | $1.19 | 43d | 1 | 0.27mi |
| 36 Haendel St Unit 1 Binghamton, NY | 3.0 | 1.0 | 1600 | $1,650 | $1.03 | 43d | 1 | 0.40mi |
| 36 Haendel St Unit Second Floor Binghamton, NY | 3.0 | 1.0 | 1200 | $1,450 | $1.21 | 43d | 1 | 0.40mi |
| 99 Helen St Unit 2 Binghamton, NY | 3.0 | 1.0 | 1220 | $1,600 | $1.31 | 43d | 1 | 0.41mi |
| 4 Baxter St Unit Left Binghamton, NY | 4.0 | 2.5 | 1800 | $1,500 | $0.83 | 13d | 1 | 0.44mi |
| 16 Highland Ave Unit 1 Binghamton, NY | 3.0 | 1.0 | 1400 | $1,650 | $1.18 | 43d | 1 | 0.49mi |
| 127 Burbank Ave Unit 2 Johnson City, NY | 2.0 | 1.0 | 1032 | $1,000 | $0.97 | 21d | 1 | 0.57mi |
| 145 Floral Ave Unit 4 Johnson City, NY | 3.0 | 1.0 | 1095 | $1,250 | $1.14 | 21d | 1 | 0.68mi |
| 248 Main St Unit 2 Johnson City, NY | 2.0 | 1.0 | 1650 | $1,650 | $1.00 | 13d | 1 | 0.93mi |
| 4 Erie St Unit 2 Binghamton, NY | 3.0 | 1.0 | 1075 | $1,200 | $1.12 | 43d | 1 | 0.95mi |
| 46 North St Unit 4 Binghamton, NY | 2.0 | 1.0 | 1000 | $1,600 | $1.60 | 13d | 1 | 0.95mi |
| 50 Lathrop Ave Unit 2 Binghamton, NY | 3.0 | 1.0 | 1250 | $1,600 | $1.28 | 13d | 1 | 0.96mi |
| 5 Arthur St Unit 2 Binghamton, NY | 4.0 | 1.0 | 1200 | $1,800 | $1.50 | 43d | 1 | 1.00mi |
| 207 Saint Charles St #2 Johnson City, NY | 2.0 | 1.0 | 925 | $1,250 | $1.35 | 21d | 1 | 1.01mi |
| 53 Seminary Ave Unit 1 Binghamton, NY | 2.0 | 1.0 | 1722 | $925 | $0.54 | 21d | 1 | 1.02mi |
| 171 Chapin St Unit 1st FL Binghamton, NY | 4.0 | 1.5 | 1400 | $3,000 | $2.14 | 43d | 1 | 1.05mi |
| 171 Chapin St Unit 3rd FL Binghamton, NY | 2.0 | 1.0 | 1135 | $1,500 | $1.32 | 43d | 1 | 1.05mi |
| 171 Chapin St Unit 2nd FL Binghamton, NY | 4.0 | 2.0 | 1135 | $3,000 | $2.64 | 43d | 1 | 1.05mi |
| 73 Leroy St Unit 02 Binghamton, NY | 3.0 | 1.0 | 1100 | $1,950 | $1.77 | 43d | 1 | 1.07mi |
| 198 Chapin St Binghamton, NY | 4.0 | 2.0 | 1500 | $1,700 | $1.13 | 21d | 1 | 1.07mi |
| 26 Johnson Ave Unit 1 Binghamton, NY | 3.0 | 1.0 | 1633 | $1,600 | $0.98 | 43d | 1 | 1.12mi |
| 400 Riverside Dr Unit 212 Johnson City, NY | 3.0 | 1.0 | 1100 | $2,500 | $2.27 | 13d | 1 | 1.18mi |
| 400 Riverside Dr Unit 15 Johnson City, NY | 3.0 | 1.0 | 1000 | $2,425 | $2.42 | 13d | 1 | 1.18mi |
| 167 Oak St Unit 1 Binghamton, NY | 2.0 | 1.0 | 923 | $1,300 | $1.41 | 43d | 1 | 1.18mi |
| 51 Allen St Unit 1 Johnson City, NY | 3.0 | 1.0 | 1170 | $1,575 | $1.35 | 21d | 1 | 1.18mi |
| 29 Laurel Ave Unit 2 Binghamton, NY | 3.0 | 1.5 | 1500 | $2,250 | $1.50 | 43d | 1 | 1.25mi |
| 50 Crocker Ave Johnson City, NY | 4.0 | 2.0 | 1411 | $2,000 | $1.42 | 21d | 1 | 1.30mi |
Listing history 3 events
-
2026-04-20status Pending
-
2026-04-03$115,000 Active
-
2004-04-21soldstatus $25,000
ⓘ Source: listings_history table (triggers on properties + properties_extension) + one-shot
backfill from property_details.listing_events for pre-trigger history.
Tax reassessment forecast NY · Partial reset (capped growth)
- Current annual tax
- $4,365 · $364/mo
- Projected year-2 tax
- $4,365 · $364/mo
- Expected delta
- $0/yr ($0/mo · 0.0%)
ⓘ Screening estimate from a state-policy table — verify with the county assessor before closing.
Climate risk First Street
- Flood 1/10 Low FEMA zone X · 0% chance over 30 yrs
- Wildfire 2/10 Low
- Heat 3/10 Moderate 7 d/yr ≥92°F today · 16 d/yr by 30 yrs out
- Wind 2/10 Low 100% chance of damaging wind over 30 yrs
- Air quality 2/10 Low 0 unhealthy d/yr today · 1 by 30 yrs out
Nearby sold comps map
Loading sold comps map…
Walkable amenities ~0.75 mi
Loading nearby amenities…
Taxation est. · year 1
- Rental income
- $19,955
- − Mortgage interest
- −$6,442
- − Property taxes
- −$4,365
- − Insurance
- −$575
- − Repairs & maintenance
- −$1,596
- − Management
- −$1,596
- − Depreciation
- −$3,345
- Taxable income
- $2,035
- Est. tax owed @ 24.0%
- −$488
- After-tax cash flow
- $3,100/yr
For passive investors: Depreciation is non-cash, so a rental often shows a tax loss while cash-flowing — sheltering income. Rental losses are passive: they offset passive income freely, and up to $25,000/yr can offset ordinary (W-2) income if you actively participate and your MAGI is under $100k (phasing out to $0 by $150k); unused losses carry forward. On sale, claimed depreciation is recaptured at up to 25%, and gains may owe capital-gains tax (a 1031 exchange can defer both). Figures are a year-1 estimate at your 24.0% rate — not tax advice; consult a CPA.
Schools (NCES district)
- District
- Binghamton City School District
- NCES district ID
- 3604870
- Math proficiency
- 30% ▬ 0.00%
- Reading proficiency
- 44% ▲ 15.00%
- Median HH income
- $30,475
- Composite
- 30.09/100
- National rank
- #6342
- State rank
- #557 of 590 in NY
Livability — Binghamton
- Score
- 78/100
- State rank
- #174
- US rank
- #2710
Category grades
Schools grade is shown separately in the Schools card above.
Census & demographics
- Census place
- Binghamton, NY
- County
- Broome County · 126,805 people
- City population
- 65,170
- Metro
- Binghamton, NY
- Population (ZIP)
- 27,988
- Household income
- $53,362
- Rent vs Own
- Severe rent burden
- 1875.0
Population outlook (Broome County) Hauer SSP2
- Today (2025)
- 187,989 people
- By 2030
- 183,066 · -2.6%
- By 2040
- 172,228 · -8.4%
- By 2050
- 163,161 · -13.2%
- By 2075
- 153,641 · -18.3%
- By 2100
- 140,851 · -25.1%
Race, ethnicity, and origin ACS 2023
- Neighborhood character
- Predominantly White (68%)
- Race & ethnicity
- White 68% Asian 10% Black 10% Hispanic / Latino 7% Two or more races 7%
- Hispanic origin (detail)
- Mexican 2% Puerto Rican 3%
- Common ancestry
- Romanian 5% Lithuanian 3% Iranian 1%
- Foreign-born
- 11% · Canada, China, Vietnam
- Languages at home
- 87% English-only · Other Indo-European 5% Spanish 2% Other Asian/Pacific 1%
Political lean MEDSL · Broome
- 2024 margin
- Toss-up / Even · D 50.2% · R 49.8%
- 2008→2024 swing
- -7.6pp toward R · 2008: 8.0pp · 2024: 0.4pp
- All cycles
- 2024: D+0.4 2020: D+3.5 2016: R+3.7 2012: D+4.6 2008: D+8.0
Not yet ingested
- Civics
- —
Market trends
- HPI YoY
- ▼ -134.70%
- Current HPI
- 298.9847
- Rent YoY
- ▲ 11.19%
- Metro
- Binghamton, NY
- State GDP YoY
- ▲ 2.60%
- F500 in state
- 92
Industry mix (Fortune 500 HQ in NY)
| Industry | F500 HQs | Revenue |
|---|---|---|
| Financial Services | 10 | $950B |
|
||
| Consumer Goods | 9 | $162B |
|
||
| Insurance | 4 | $225B |
|
||
| Telecommunications | 2 | $144B |
|
||
| Pharmaceuticals | 2 | $112B |
|
||
| Media / Entertainment | 2 | $69B |
|
||
Price history
+360.0% since first listed3 events — show timeline
- 2026-04-20 Pending — UNYREIS
- 2026-04-03 Listed $115,000 UNYREIS
- 2004-04-21 Sold (Public Records) $25,000 Public Records
Property tax history
+4.7%/yrLatest (2025): $4,365 · +0.9% YoY. Source: county tax records.
Cash-flow waterfall
monthlySold comps — $/sqft
last 12 mo · ≤1 miLoading sold comps…