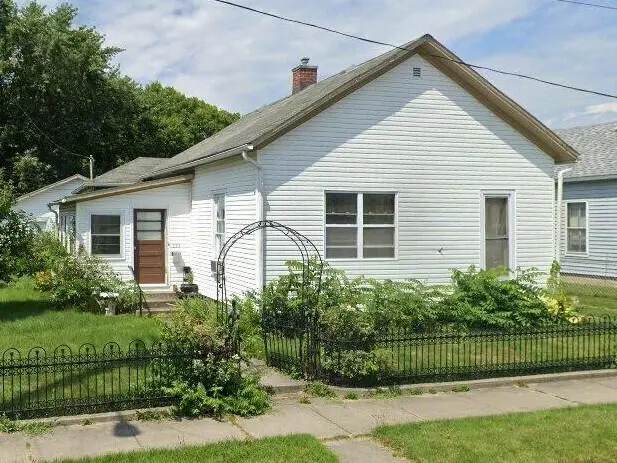
221 1st St · Piqua, OH
Flood risk 5/10 · Moderate
- FEMA flood zone
- X
- Chance of flooding over 30 yrs
- 0.24%
- Est. flood insurance / yr
- $507 – $1,088
Fire risk 1/10 · Minimal
- Est. fire insurance / yr
- $713 – $1,323
Heat risk 4/10 · Minor
- Hot days now (above 100°F)
- 7 days/yr
- Hot days in 30 yrs
- 19 days/yr
Wind risk 2/10 · Minimal
- Chance of severe wind over 30 yrs
- —
Air-quality risk 2/10 · Minimal
- Unhealthy air days now
- 1 days/yr
- Unhealthy air days in 30 yrs
- 2 days/yr
Risk factors via First Street. Map © Google.
Why this score? — see what drove the B grade
The composite is a weighted blend of 9 inputs, each scored 0–100. Each bar is that input's sub-score; the figure is the points it added to the 100-point composite (weight × sub-score).
- Cash flow +27.2/30.0
- ARV discount +15.0/15.0
- DSCR +9.5/10.0
- 1% rule +7.3/10.0
- Schools +4.0/10.0
- Livability +3.1/5.0
- Rent growth +2.5/5.0
- Condition / age +2.5/5.0
- Appreciation +0.0/10.0
$89,900
🖨 Deal sheet 📄 Offer letter ✓ Due diligence
Listing remarks MLS
Reasonably priced ~ 2 bedroom one floor plan ~ Large kitchen ~ Spacious living room & dining room ~ Enclosed front porch ~ 2 car attached garage and large fenced yard! Would make a great income property.
Key facts
- 9,148 sq ft lot
- 2 garage spots
- Built 1920
Neighborhood map
What this means for you Summary
Snapshot
- This is a 2-bed/1.0-bath single-family listed at $90k.
Deal economics
- At list price, monthly cash flow is $257 ($3k/yr) — positive.
- The deal already cash-flows at list — no discount required.
- Meets the 1% rule at list price ($1k rent vs $90k).
- Cap rate 9.7% vs local median 4.7% in Piqua — top-decile yield for the area; either an underpriced asset or a hidden risk that comps aren't pricing in. Stress-test before assuming the spread holds.
Location & tenants
- Location reads 62/100 on livability (#887 in OH) — a middle-class / working-renter tenant base. Strengths: cost of living A+, housing A+; Watch: employment D+, crime F, amenities F.
- Piqua City (rural): math 45% / reading 50% proficiency, ranked #482 of 656 in OH (top 74%) — families likely to look elsewhere, expect single-tenant / working-renter base with shorter leases.
- Market conditions: 139 active listings in the ZIP; 18 comparable units currently listed for rent nearby; rentals at typical pace (median 14d on market — plan ~3-4 weeks tenant-placement turnaround); 326 units permitted in Miami County in 2024 (0 in 5+ unit buildings).
Forward outlook
- Local home prices are declining (-3.0%/yr); year-one equity from $622 of loan paydown is wiped out by about $3k of value loss. Plan a longer hold.
- At projected returns (-3.0% appreciation + 3.0% rent growth), your $25k cash investment doubles in ~10 years — after that, you're playing with house money.
Negotiation context
- Only 0 days on market — expect competitive offers; lowballing is unlikely to land.
- 4 sale attempts since 19y ago with the ask held roughly flat each time — persistent listings suggest the price (not the market) is what's stuck; bring a comps-based counter.
- Current owner paid $45k; list at $90k implies a 100% gain — meaningful room to come down on a strong offer.
Risks & watch-outs
- Watch-outs: built in 1920 — expect roof / HVAC / electrical / plumbing capex.
- Climate carrying-cost: moderate flood risk — expect insurance premiums to compound above CPI over the hold.
Questions for the listing agent
- Built in 1920 — when were the roof, HVAC, electrical panel, plumbing, and water heater last replaced?
- Is there a deadline driving the sale (1031 exchange, divorce, estate, relocation)? That informs how much negotiation room exists.
- Crime grade is F in this area — have there been break-ins, vandalism, or insurance claims at this property in the last 3 years? What carrier currently insures it and at what premium?
- What's the average days-on-market for RENTAL listings here right now (not sales)? A rising rental-DOM trend means longer vacancies and softer asking-rent achievability than the comps imply.
- What's the recent tenant-quality profile in this submarket — average credit score on applications, eviction rate, late-payment / NSF rate, and stable-employment percentage? A property-management company in the area should have these aggregated.
- How much new for-sale + rental construction is in the pipeline within 1–3 miles? Heavy new supply typically softens prices + rents 12–24 months out; constrained supply supports both.
Investment metrics
- 1% rule
- 1.23% ✓
- Cap rate
- 9.72%
- Cash-on-cash
- 12.25%
- DSCR
- 1.55
- GRM
- 6.8
CMA / ARV
- ARV (on-the-fly)
- $146,640
- Comps found
- 12
Show comp detail 12 sales within ~0.75 mi
| Address | Dist | Beds/Ba | Sqft | Sold | Price | $/sf | Match |
|---|---|---|---|---|---|---|---|
| 309 Cleveland St | 0.16mi | 2/1.0 | 1,172 (+4%) | 4mo | $80,000 | $68 | 82 |
| 214 Cleveland St | 0.07mi | 2/1.0 | 1,028 (-9%) | 4mo | $79,000 | $77 | 79 |
| 709 S Main St | 0.48mi | 3/1.0 (+1) | 1,118 (-1%) | 12mo | $51,500 | $46 | 62 |
| 605 1st St | 0.44mi | 2/1.0 | 1,040 (-8%) | 9mo | $135,000 | $130 | 59 |
| 441 Miami St | 0.62mi | 3/1.0 (+1) | 1,106 (-2%) | 8mo | $159,900 | $145 | 56 |
| 624 Adams St | 0.59mi | 2/1.0 | 1,048 (-7%) | 7mo | $156,900 | $150 | 55 |
| 505 1st St | 0.29mi | 3/2.0 (+1) | 1,250 (+11%) | 9mo | $180,000 | $144 | 52 |
| 717 S Downing St | 0.58mi | 3/1.0 (+1) | 1,212 (+7%) | 13mo | $86,000 | $71 | 44 |
| 312 W Grant St | 0.46mi | 3/1.5 (+1) | 1,260 (+12%) | 11mo | $54,000 | $43 | 43 |
| 420 Summit St | 0.74mi | 3/2.0 (+1) | 1,200 (+6%) | 7mo | $184,900 | $154 | 40 |
| 465 Miami St | 0.64mi | 2/1.5 | 986 (-13%) | 11mo | $157,000 | $159 | 38 |
| 523 W Water St | 0.58mi | 3/2.5 (+1) | 1,264 (+12%) | 10mo | $80,000 | $63 | 33 |
Match score weights: distance 35% · size 25% · config 20% · recency 20%. Top-matched comps best support the ARV.
Projected returns pro-forma
-3.0% appreciation · 3.0% rent growth · sell at horizon
- IRR
- 1.9%
- Equity multiple
- 1.07×
- Total profit
- $1,820
- Equity at exit
- $13,404
- IRR
- 11.5%
- Equity multiple
- 1.90×
- Total profit
- $22,729
- Equity at exit
- $7,773
Cash invested: $25,172 (down + closing). Projections, not guarantees.
Landlord ↔ Tenant lean methodology
- Overall (STATE)
- 73 Landlord-Friendly
- State Ohio
- 73 Landlord-Friendly · R+6
- County
- — inherits STATE
- City
- — inherits STATE
ZIP-level market 45356
- Active inventory
- 139
- Price-to-rent
- 6.8×
Monthly cashflow live
- Estimated rent
- $1,109 high interval (Pro) →
- Mortgage (P&I)
- −$471
- Tax from tax record
- −$110 /mo · $1,317/yr
- Insurance
- −$37
- HOA
- −$0
- Vacancy / Maint / Mgmt
- −$233
- Net cashflow
- $257
Break-even live
UW: 25.0% down · 7.5% · 30yr · 1.5% tax · 5.0% vac · 8.0% maint · 8.0% mgmt
Financing live
Cash to close
- Down payment
- $22,475
- Closing costs
- $2,697
- Reserves months
- —
- Total cash needed
- —
Loan-product check · same deal, 3 products live
Conventional
25% down · 7.5% · 30yr
- Down + closing
- —
- Monthly P&I
- —
- Monthly cashflow
- —
- DSCR
- —
- Eligible?
- —
Personal DTI + credit; lowest rate.
DSCR
20% down · 8.5% · 30yr
- Down + closing
- —
- Monthly P&I
- —
- Monthly cashflow
- —
- DSCR
- —
- Eligible?
- —
No personal income docs; deal must DSCR.
Hard money
10% down · 12.0% · 12mo
- Down + closing
- —
- Monthly P&I
- —
- Monthly cashflow
- —
- DSCR
- —
- Eligible?
- —
Short-term bridge; refi at stabilization.
Rent comps 18 comps
| Address | Beds | Baths | Sqft | Rent | $/sqft | DOM | Units | Dist |
|---|---|---|---|---|---|---|---|---|
| 317 Cleveland St Piqua, OH | 2.0 | 1.0 | 1068 | $1,200 | $1.12 | 2d | 1 | 0.16mi |
| 310 Harrison St Piqua, OH | 1.0 | 1.0 | 1200 | $895 | $0.75 | 18d | 1 | 0.31mi |
| 310 Harrison St Piqua, OH | 1.0 | 1.0 | 850 | $895 | $1.05 | 23d | 1 | 0.31mi |
| 310 Harrison St Piqua, OH | 1.0 | 1.0 | 800 | $1,095 | $1.37 | 43d | 1 | 0.31mi |
| 200 E High St Piqua, OH | 3.0 | 1.0 | 1500 | $1,365 | $0.91 | 3d | 1 | 0.32mi |
| 619 S Wayne St Piqua, OH | 2.0 | 1.0 | 750 | $1,050 | $1.40 | 2d | 1 | 0.44mi |
| 611 N Main St Unit 611-A Piqua, OH | 1.0 | 1.0 | 857 | $995 | $1.16 | 14d | 1 | 0.55mi |
| 717 S Downing St Piqua, OH | 3.0 | 1.0 | 1212 | $1,100 | $0.91 | 2d | 1 | 0.58mi |
| 436 Wood St Unit 3 Piqua, OH | 2.0 | 1.0 | 720 | $1,050 | $1.46 | 43d | 1 | 0.58mi |
| 628 N Main St Piqua, OH | 1.0 | 1.0 | 914 | $895 | $0.98 | 23d | 1 | 0.58mi |
| 701 N Wayne St Unit 118 Piqua, OH | 2.0 | 1.0 | 944 | $1,095 | $1.16 | 23d | 1 | 0.63mi |
| 764 S Wayne St Piqua, OH | 3.0 | 1.0 | 1203 | $1,300 | $1.08 | 43d | 1 | 0.63mi |
| 521-523 Wood St Piqua, OH | 2.0 | 1.0 | 900 | $950 | $1.06 | 3d | 1 | 0.69mi |
| 316 N College St Piqua, OH | 2.0 | 1.0 | 782 | $1,075 | $1.37 | 2d | 3 | 0.84mi |
| 519 Ann St Piqua, OH | 3.0 | 1.0 | 1388 | $1,300 | $0.94 | 2d | 1 | 0.98mi |
| 715 Walker St Piqua, OH | 3.0 | 2.0 | 1100 | $1,650 | $1.50 | 3d | 1 | 0.98mi |
| 918 W Greene St Piqua, OH | 2.0 | 1.5 | 1270 | $900 | $0.71 | 14d | 1 | 1.01mi |
| 1103 Nicklin Ave Piqua, OH | 2.0 | 1.0 | 850 | $775 | $0.91 | 21d | 1 | 1.14mi |
Listing history 9 events
-
2026-05-21status Pending 207-char remark
Show marketing remark (207 chars)
Reasonably priced ~ 2 bedroom one floor plan ~ Large kitchen ~ Spacious living room & dining room ~ Enclosed front porch ~ 2 car attached garage and large fenced yard! Would make a great income property.
-
2026-05-18status Active 207-char remark
Show marketing remark (207 chars)
Reasonably priced ~ 2 bedroom one floor plan ~ Large kitchen ~ Spacious living room & dining room ~ Enclosed front porch ~ 2 car attached garage and large fenced yard! Would make a great income property.
-
2026-03-21status Pending 207-char remark
Show marketing remark (207 chars)
Reasonably priced ~ 2 bedroom one floor plan ~ Large kitchen ~ Spacious living room & dining room ~ Enclosed front porch ~ 2 car attached garage and large fenced yard! Would make a great income property.
-
2026-03-20$89,900 Active 207-char remark
Show marketing remark (207 chars)
Reasonably priced ~ 2 bedroom one floor plan ~ Large kitchen ~ Spacious living room & dining room ~ Enclosed front porch ~ 2 car attached garage and large fenced yard! Would make a great income property.
-
2026-03-20$89,900
Show marketing remark (207 chars)
Reasonably priced ~ 2 bedroom one floor plan ~ Large kitchen ~ Spacious living room & dining room ~ Enclosed front porch ~ 2 car attached garage and large fenced yard! Would make a great income property.
-
2026-03-20historical
Show marketing remark (207 chars)
Reasonably priced ~ 2 bedroom one floor plan ~ Large kitchen ~ Spacious living room & dining room ~ Enclosed front porch ~ 2 car attached garage and large fenced yard! Would make a great income property.
-
2008-10-08historical
-
2007-10-08$35,000
-
2005-03-22soldstatus $45,000
ⓘ Source: listings_history table (triggers on properties + properties_extension) + one-shot
backfill from property_details.listing_events for pre-trigger history.
Tax reassessment forecast OH · Partial reset (capped growth)
- Current annual tax
- $1,317 · $110/mo
- Projected year-2 tax
- $1,360 · $113/mo
- Expected delta
- +$43/yr (+$4/mo · 3.2%)
ⓘ Screening estimate from a state-policy table — verify with the county assessor before closing.
Climate risk First Street
- Flood 5/10 Major FEMA zone X · 24% chance over 30 yrs
- Wildfire 1/10 Low
- Heat 4/10 Moderate 7 d/yr ≥100°F today · 19 d/yr by 30 yrs out
- Wind 2/10 Low
- Air quality 2/10 Low 1 unhealthy d/yr today · 2 by 30 yrs out
Nearby sold comps map
Loading sold comps map…
Walkable amenities ~0.75 mi
Loading nearby amenities…
Taxation est. · year 1
- Rental income
- $13,302
- − Mortgage interest
- −$5,036
- − Property taxes
- −$1,317
- − Insurance
- −$450
- − Repairs & maintenance
- −$1,064
- − Management
- −$1,064
- − Depreciation
- −$2,615
- Taxable income
- $1,756
- Est. tax owed @ 24.0%
- −$421
- After-tax cash flow
- $2,663/yr
For passive investors: Depreciation is non-cash, so a rental often shows a tax loss while cash-flowing — sheltering income. Rental losses are passive: they offset passive income freely, and up to $25,000/yr can offset ordinary (W-2) income if you actively participate and your MAGI is under $100k (phasing out to $0 by $150k); unused losses carry forward. On sale, claimed depreciation is recaptured at up to 25%, and gains may owe capital-gains tax (a 1031 exchange can defer both). Figures are a year-1 estimate at your 24.0% rate — not tax advice; consult a CPA.
Schools (NCES district)
- District
- Piqua City
- NCES district ID
- 3904464
- Math proficiency
- 45% ▼ -11.00%
- Reading proficiency
- 50% ▼ -7.00%
- Median HH income
- $41,751
- Composite
- 39.91/100
- National rank
- #3855
- State rank
- #482 of 656 in OH
Livability — Piqua
- Score
- 62/100
- State rank
- #887
- US rank
- #16830
Category grades
Schools grade is shown separately in the Schools card above.
Census & demographics
- Census place
- Piqua, OH
- County
- Miami County · 85,667 people
- City population
- 25,237
- Metro
- Dayton-Kettering, OH
- Population (ZIP)
- 25,237
- Household income
- $69,188
- Rent vs Own
- Severe rent burden
- 748.0
Population outlook (Miami County) Hauer SSP2
- Today (2025)
- 107,816 people
- By 2030
- 108,896 · +1.0%
- By 2040
- 109,581 · +1.6%
- By 2050
- 108,110 · +0.3%
- By 2075
- 101,523 · -5.8%
- By 2100
- 85,787 · -20.4%
Race, ethnicity, and origin ACS 2023
- Neighborhood character
- Predominantly White (92%)
- Race & ethnicity
- White 92% Two or more races 3% Black 2% Hispanic / Latino 1%
- Common ancestry
- Iranian 2% Italian 2% Lithuanian 2%
- Foreign-born
- 1%
- Languages at home
- 99% English-only · Spanish 1% Vietnamese 0%
Political lean MEDSL · Miami
- 2024 margin
- Solid R (+45.1) · D 27.0% · R 72.1%
- 2008→2024 swing
- -16.6pp toward R · 2008: -28.5pp · 2024: -45.1pp
- All cycles
- 2024: R+45.1 2020: R+44.3 2016: R+45.6 2012: R+35.6 2008: R+28.5
Not yet ingested
- Civics
- —
Market trends
- HPI YoY
- ▼ -137.96%
- Current HPI
- 251.435
- Rent YoY
- —
- Metro
- Dayton-Kettering, OH
- State GDP YoY
- ▲ 1.98%
- F500 in state
- 48
Industry mix (Fortune 500 HQ in OH)
| Industry | F500 HQs | Revenue |
|---|---|---|
| Insurance | 3 | $145B |
|
||
| Industrial Machinery | 3 | $49B |
|
||
| Financial Services | 3 | $24B |
|
||
| Consumer Goods | 2 | $93B |
|
||
| Aerospace / Defense | 2 | $47B |
|
||
| Utilities | 2 | $33B |
|
||
Price history
+99.8% since first listed9 events — show timeline
- 2026-05-21 Pending — WRIST
- 2026-05-18 Relisted — WRIST
- 2026-03-21 Pending — WRIST
- 2026-03-20 Listing Removed — Dayton MLS
- 2026-03-20 Listed $89,900 Dayton MLS
- 2026-03-20 Listed $89,900 WRIST
- 2008-10-08 Listing Removed — WRIST
- 2007-10-08 Listed $35,000 WRIST
- 2005-03-22 Sold (Public Records) $45,000 Public Records
Property tax history
+5.5%/yrLatest (2025): $1,317 · +145.8% YoY. Source: county tax records.
Cash-flow waterfall
monthlySold comps — $/sqft
last 12 mo · ≤1 miLoading sold comps…