 Multi-family
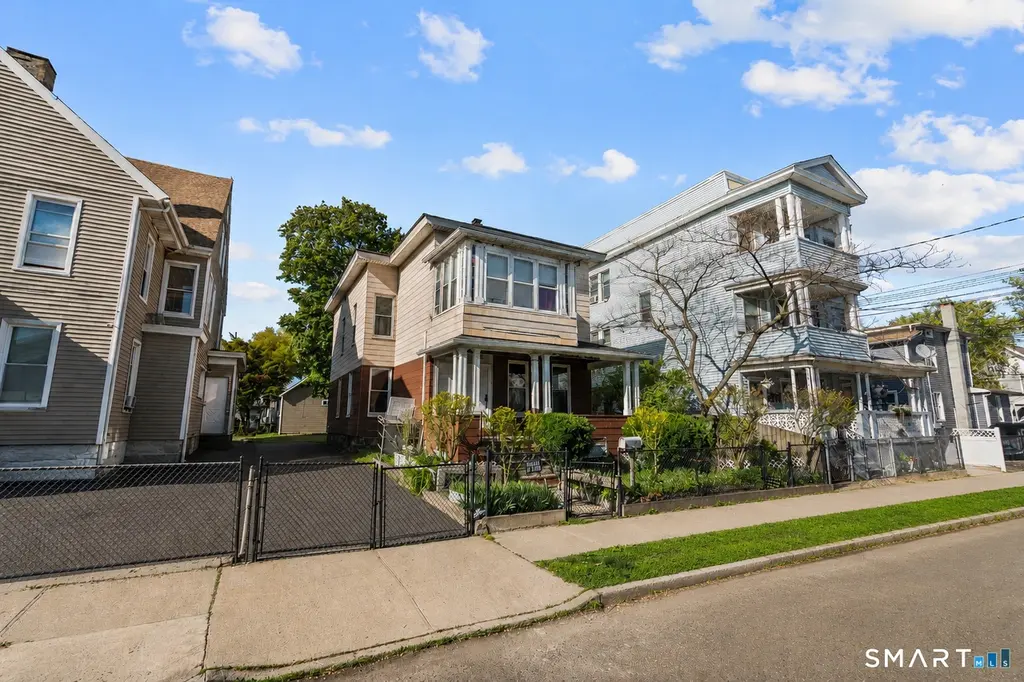
149 Shelton St · Bridgeport, CT
Flood risk 1/10 · Minimal
- FEMA flood zone
- X (unshaded)
- Chance of flooding over 30 yrs
- 0.0%
- Est. flood insurance / yr
- $473 – $860
Fire risk 1/10 · Minimal
- Est. fire insurance / yr
- $829 – $1,539
Heat risk 6/10 · Moderate
- Hot days now (above 97°F)
- 7 days/yr
- Hot days in 30 yrs
- 15 days/yr
Wind risk 6/10 · Moderate
- Chance of severe wind over 30 yrs
- 41.0%
Air-quality risk 4/10 · Minor
- Unhealthy air days now
- 5 days/yr
- Unhealthy air days in 30 yrs
- 7 days/yr
Risk factors via First Street. Map © Google.
Why this score? — see what drove the C- grade
The composite is a weighted blend of 9 inputs, each scored 0–100. Each bar is that input's sub-score; the figure is the points it added to the 100-point composite (weight × sub-score).
- Cash flow +14.8/30.0
- Appreciation +10.0/10.0
- ARV discount +6.0/15.0
- DSCR +4.5/10.0
- Livability +4.0/5.0
- 1% rule +3.8/10.0
- Rent growth +3.6/5.0
- Condition / age +2.5/5.0
- Schools +1.2/10.0
$458,888
🖨 Deal sheet 📄 Offer letter ✓ Due diligence
Multi-family units
County records classify this as Multi-Family (2-4 Unit). Listing-text estimate: 1 unit. estimate disagrees with records
Listing remarks
Welcome to 149-151 Shelton Street, a multi-family opportunity in the heart of Bridgeport - perfect for an owner-occupant ready to break into real estate investing while offsetting their mortgage with immediate rental income. With one unit already cash flowing, this property offers the ideal blend of affordability, functionality, and long-term upside. The heavy lifting has already been done for you. Major capital improvements have been completed, including the roof, mechanical systems, interior updates, and appliances, giving peace of mind to both investors and homeowners alike. Whether you're looking to live in one unit and rent the other, or expand your investment portfolio with a low-main
Key facts
- Cash flowing unit
- Strong rental appeal
- 4,356 sq ft lot
Tags
Property features AI
Exterior
- Parking: Driveway parking (3 spaces)
- Utilities: Public water; Public sewer; Natural gas
- Home design: Multi-family 2-unit property
- Construction: Frame construction; Asphalt shingle roof; Concrete and stone foundation; Exterior siding: Other
- Exterior features: Level lot; Private paved driveway
Interior
- Bedrooms: 4 bedrooms
- Bathrooms: 2 full bathrooms
- Heating & cooling: Hot water heat; Natural gas heating; 40-gallon natural gas hot water tank
- Interior features: 10 total rooms; Full unfinished basement; Window air conditioning units
Neighborhood map
What this means for you Summary
Snapshot
- This is a 4-bed/2.0-bath multifamily listed at $459k.
Deal economics
- At list price, monthly cash flow is $127 ($2k/yr) — positive.
- The deal already cash-flows at list — no discount required.
- To meet the 1% rule (rent ≥ 1% of price), the offer needs to be $406k (11.6% below list).
- Recommended offer: $406k (11.6% below list) — sets the bar for 1% rule.
- Cap rate 6.6% vs local median 5.0% in Bridgeport — top-decile yield for the area; either an underpriced asset or a hidden risk that comps aren't pricing in. Stress-test before assuming the spread holds.
Location & tenants
- Location reads 81/100 on livability (#15 in CT, #1,374 nationally) — a professional / high-income tenant draw. Strengths: amenities A+, commute A+, health & safety A+; Watch: crime C-, employment D+, schools D-.
- Bridgeport School District (urban): math 9% / reading 19% proficiency, ranked #151 of 153 in CT (top 99%) — low school quality limits family demand, transient renter base, plan for 1-2y turnover; 97% free/reduced lunch — lower-income household profile, screen leases tightly.
- Market conditions: Rents rising fast (+4.3%/yr); 30 active listings in the ZIP; 40 comparable units currently listed for rent nearby; rentals at typical pace (median 24d on market — plan ~3-4 weeks tenant-placement turnaround); 42% of comp listings sitting > 30 days — soft ceiling on asking rent; 852 units permitted in Greater Bridgeport Planning Region in 2024 (698 in 5+ unit buildings).
- At $4,058/mo this rent would consume 106% of the median local household income ($46k/yr) (locally 910% of renters already pay >50% of income on rent) — very limited rent-growth headroom before tenants either downsize or default.
Forward outlook
- In year one you build about $49k of equity ($3k loan paydown + $46k appreciation (10.0% local appreciation)).
- At projected returns (10.0% appreciation + 4.3% rent growth), your $128k cash investment doubles in ~3 years — after that, you're playing with house money.
- By year 2, paydown + projected appreciation supports a ~$79k cash-out refi (75% LTV) — recoverable capital for the next deal without selling this one.
Negotiation context
- It's been on market 29 days — a 2% lower offer ($452k) is reasonable based on typical stale-listing flexibility.
- 5 sale attempts; this cycle's ask is 24% above the opening price — seller raised mid-cycle; expect resistance to lowballs.
Risks & watch-outs
- Watch-outs: built in 1920 — expect roof / HVAC / electrical / plumbing capex.
- Climate carrying-cost: major wind risk, 41% chance of damaging wind over 30y; extreme-heat days projected 7→15/yr by 2055 (HVAC capex compounding) — expect insurance premiums to compound above CPI over the hold.
Questions for the listing agent
- Built in 1920 — when were the roof, HVAC, electrical panel, plumbing, and water heater last replaced?
- Is there a deadline driving the sale (1031 exchange, divorce, estate, relocation)? That informs how much negotiation room exists.
- Schools are D-rated, which usually means shorter tenancies and higher turnover. Who's the typical renter profile here, and what's been the actual vacancy rate?
- What's the average days-on-market for RENTAL listings here right now (not sales)? A rising rental-DOM trend means longer vacancies and softer asking-rent achievability than the comps imply.
- What's the recent tenant-quality profile in this submarket — average credit score on applications, eviction rate, late-payment / NSF rate, and stable-employment percentage? A property-management company in the area should have these aggregated.
- How much new apartment / multifamily construction is in the pipeline within 1–3 miles? Heavy new supply (>2% of stock underway) typically softens rents 12–24 months out; light construction supports rent growth.
Investment metrics
- 1% rule
- 0.88% ✗
- Cap rate
- 6.63%
- Cash-on-cash
- 1.19%
- DSCR
- 1.05
- GRM
- 9.4
CMA / ARV
- ARV (on-the-fly)
- $444,136
- Comps found
- 12
Show comp detail 12 sales within ~0.75 mi
| Address | Dist | Beds/Ba | Sqft | Sold | Price | $/sf | Match |
|---|---|---|---|---|---|---|---|
| 530 Jane St | 0.54mi | 4/2.0 | 2,217 (+3%) | 5mo | $599,000 | $270 | 66 |
| 107 Colony St | 0.71mi | 4/2.0 | 2,188 (+2%) | 3mo | $330,000 | $151 | 62 |
| 277 Helen St | 0.61mi | 4/2.0 | 1,997 (-7%) | 2mo | $375,000 | $188 | 57 |
| 44 Locust St | 0.70mi | 4/2.0 | 2,054 (-5%) | 6mo | $515,000 | $251 | 54 |
| 30-32 Hadley St | 0.61mi | 4/2.0 | 2,188 (+2%) | 20mo | $355,000 | $162 | 53 |
| 64 Locust St | 0.70mi | 4/2.0 | 2,028 (-6%) | 10mo | $515,000 | $254 | 49 |
| 8 Horace St | 0.63mi | 4/2.0 | 2,112 (-2%) | 22mo | $355,000 | $168 | 49 |
| 36-40 Carver St | 0.70mi | 4/2.0 | 2,188 (+2%) | 19mo | $450,000 | $206 | 49 |
| 41 Sedgewick St | 0.65mi | 5/2.0 (+1) | 2,037 (-6%) | 15mo | $500,000 | $245 | 43 |
| 75 Asylum St | 0.66mi | 4/2.0 | 2,014 (-7%) | 20mo | $330,000 | $164 | 42 |
| 27 Center St | 0.64mi | 4/2.0 | 2,361 (+10%) | 16mo | $385,000 | $163 | 41 |
| 75 Commercial St | 0.46mi | 5/2.0 (+1) | 2,478 (+15%) | 20mo | $575,000 | $232 | 32 |
Match score weights: distance 35% · size 25% · config 20% · recency 20%. Top-matched comps best support the ARV.
Projected returns pro-forma
10.0% appreciation · 4.35% rent growth · sell at horizon
- IRR
- 25.6%
- Equity multiple
- 3.05×
- Total profit
- $263,633
- Equity at exit
- $413,403
- IRR
- 22.9%
- Equity multiple
- 7.09×
- Total profit
- $781,953
- Equity at exit
- $891,518
Cash invested: $128,489 (down + closing). Projections, not guarantees.
Landlord ↔ Tenant lean methodology
- Overall (STATE)
- 27 Tenant-Leaning
- State Connecticut
- 27 Tenant-Leaning · D+7
- County
- — inherits STATE
- City
- — inherits STATE
ZIP-level market 06608
- Home prices YoY
- 3.6%
- Rents YoY
- 4.3%
- Active inventory
- 30
- Price-to-rent
- 18.8×
Monthly cashflow live
- Estimated rent
- $4,058 high interval (Pro) →
- Mortgage (P&I)
- −$2,406
- Tax from tax record
- −$481 /mo · $5,768/yr
- Insurance
- −$191
- HOA
- −$0
- Vacancy / Maint / Mgmt
- −$852
- Net cashflow
- $127
Break-even live
2-unit breakdown (identical units grouped — click to expand)
| Units | Beds | Baths | Est. rent |
|---|---|---|---|
| 2× units | 2 | 1 | $4,058 |
| #1 | 2 | 1 | $2,029 |
| #2 | 2 | 1 | $2,029 |
| Total (2 units) | $4,058 | ||
UW: 25.0% down · 7.5% · 30yr · 1.5% tax · 5.0% vac · 8.0% maint · 8.0% mgmt
Financing live
Cash to close
- Down payment
- $114,722
- Closing costs
- $13,767
- Reserves months
- —
- Total cash needed
- —
Loan-product check · same deal, 3 products live
Conventional
25% down · 7.5% · 30yr
- Down + closing
- —
- Monthly P&I
- —
- Monthly cashflow
- —
- DSCR
- —
- Eligible?
- —
Personal DTI + credit; lowest rate.
DSCR
20% down · 8.5% · 30yr
- Down + closing
- —
- Monthly P&I
- —
- Monthly cashflow
- —
- DSCR
- —
- Eligible?
- —
No personal income docs; deal must DSCR.
Hard money
10% down · 12.0% · 12mo
- Down + closing
- —
- Monthly P&I
- —
- Monthly cashflow
- —
- DSCR
- —
- Eligible?
- —
Short-term bridge; refi at stabilization.
Rent comps 40 comps
| Address | Beds | Baths | Sqft | Rent | $/sqft | DOM | Units | Dist |
|---|---|---|---|---|---|---|---|---|
| 141 Hicks St Bridgeport, CT | 4.0 | 1.0 | 2311 | $2,400 | $1.04 | 24d | 1 | 0.05mi |
| 36-38 Pleasant St Unit 2 Bridgeport, CT | 4.0 | 1.0 | 2395 | $2,700 | $1.13 | 14d | 1 | 0.12mi |
| 690 William St Unit 2 Bridgeport, CT | 3.0 | 1.0 | 1746 | $2,200 | $1.26 | 24d | 1 | 0.20mi |
| 281 Harriet St Unit 281 Bridgeport, CT | 4.0 | 2.5 | 2297 | $3,900 | $1.70 | 44d | 1 | 0.20mi |
| 7 Armstrong Pl Bridgeport, CT | 5.0 | 1.0 | 2449 | $2,750 | $1.12 | 24d | 1 | 0.21mi |
| 587 Brooks St Unit !st floor Bridgeport, CT | 3.0 | 2.0 | 1500 | $2,400 | $1.60 | 44d | 1 | 0.40mi |
| 426 Jane St Unit 1 Bridgeport, CT | 3.0 | 1.0 | 2886 | $2,400 | $0.83 | 3d | 1 | 0.42mi |
| 223 Spring St Bridgeport, CT | 3.0 | 1.0 | 2918 | $2,000 | $0.69 | 44d | 1 | 0.43mi |
| 52-54 Ives Ct Bridgeport, CT | 4.0 | 1.0 | 2092 | $2,750 | $1.31 | 44d | 1 | 0.46mi |
| 1325 Pembroke St Unit 2nd Floor Bridgeport, CT | 3.0 | 1.0 | 1600 | $3,500 | $2.19 | 44d | 1 | 0.46mi |
| 982 Pembroke St Unit 2L Bridgeport, CT | 4.0 | 1.0 | 2043 | $2,475 | $1.21 | 3d | 1 | 0.49mi |
| 695 Shelton St Unit 1st Floor Bridgeport, CT | 3.0 | 1.0 | 2387 | $2,200 | $0.92 | 44d | 1 | 0.50mi |
| 479 Putnam St Unit 3R Bridgeport, CT | 5.0 | 2.0 | 2000 | $2,350 | $1.18 | 19d | 1 | 0.51mi |
| 530 Jane St Unit 2B Bridgeport, CT | 3.0 | 2.0 | 2217 | $3,400 | $1.53 | 44d | 1 | 0.52mi |
| 704 Maple St #704 Bridgeport, CT | 3.0 | 1.5 | 1948 | $2,700 | $1.39 | 24d | 1 | 0.56mi |
| 95 Parrott Ave Bridgeport, CT | 4.0 | 1.0 | 1782 | $3,450 | $1.94 | 24d | 1 | 0.62mi |
| 588 E Main St Unit C Bridgeport, CT | 3.0 | 1.0 | 1400 | $2,475 | $1.77 | 14d | 1 | 0.63mi |
| 191 Parrott Ave Unit 1 Bridgeport, CT | 3.0 | 1.0 | 2662 | $2,000 | $0.75 | 44d | 1 | 0.72mi |
| 136 Sherman St Unit 142 Bridgeport, CT | 4.0 | 1.5 | 2116 | $2,800 | $1.32 | 3d | 1 | 0.86mi |
| 2048 E Main St Bridgeport, CT | 4.0 | 2.0 | 2000 | $3,000 | $1.50 | 44d | 1 | 0.88mi |
| 70 Hawthorne St Bridgeport, CT | 3.0 | 1.5 | 2376 | $3,500 | $1.47 | 44d | 1 | 0.89mi |
| 271 Vine St Unit 3 Bridgeport, CT | 3.0 | 1.0 | 1749 | $2,000 | $1.14 | 3d | 1 | 0.96mi |
| 64 Hickory St Bridgeport, CT | 4.0 | 3.0 | 2870 | $4,400 | $1.53 | 44d | 1 | 0.97mi |
| 1566 North Ave Bridgeport, CT | 5.0 | 1.0 | 2837 | $2,500 | $0.88 | 44d | 1 | 1.05mi |
| 55 E Main St Bridgeport, CT | 3.0 | 1.0–3.0 | 1115 | $9,085 | $8.14 | 3d | 189 | 1.07mi |
| 333 Ridgefield Ave Bridgeport, CT | 3.0 | 1.0 | 1400 | $2,250 | $1.61 | 3d | 1 | 1.13mi |
| 259 6th St Bridgeport, CT | 4.0 | 2.0 | 2269 | $3,000 | $1.32 | 44d | 1 | 1.13mi |
| 335 Ridgefield Ave Bridgeport, CT | 3.0 | 1.0 | 1400 | $2,250 | $1.61 | 3d | 1 | 1.13mi |
| 292 Ridgefield Ave Unit 3 Bridgeport, CT | 3.0 | 1.0 | 1792 | $2,450 | $1.37 | 44d | 1 | 1.16mi |
| 292 Ridgefield Ave Unit 2 Bridgeport, CT | 4.0 | 1.0 | 1792 | $2,650 | $1.48 | 44d | 1 | 1.16mi |
| 1577 Park Ave Bridgeport, CT | 3.0 | 1.0 | 1409 | $2,400 | $1.70 | 24d | 1 | 1.21mi |
| 1577 Park Ave Unit 3rd Flr Bridgeport, CT | 3.0 | 1.0 | 1890 | $2,300 | $1.22 | 3d | 1 | 1.21mi |
| 1515 Park Ave Unit 2 Bridgeport, CT | 3.0 | 2.0 | 1900 | $2,750 | $1.45 | 44d | 1 | 1.21mi |
| 1573 Park Ave Unit 1577 Bridgeport, CT | 3.0 | 1.0 | 1890 | $2,250 | $1.19 | 3d | 1 | 1.21mi |
| 22 Infield St Unit 22 Bridgeport, CT | 3.0 | 2.5 | 2688 | $3,500 | $1.30 | 3d | 1 | 1.21mi |
| 457 Summit St Bridgeport, CT | 3.0 | 1.5 | 1511 | $4,000 | $2.65 | 44d | 1 | 1.32mi |
| 64 Velvet St Bridgeport, CT | 3.0 | 1.0 | 1430 | $2,500 | $1.75 | 12d | 1 | 1.33mi |
| 183 Harlem Ave Unit 1 Bridgeport, CT | 3.0 | 1.0 | 2980 | $2,400 | $0.81 | 24d | 1 | 1.35mi |
| 125 High Ridge Dr Bridgeport, CT | 4.0 | 1.5 | 2160 | $3,400 | $1.57 | 3d | 1 | 1.35mi |
| 53 Pixlee Pl Unit 2nd Bridgeport, CT | 3.0 | 1.0 | 1475 | $2,195 | $1.49 | 3d | 1 | 1.35mi |
Listing history 26 events
-
2026-06-18days on market $458,888 Active 29 DOM
-
2026-06-17days on market $458,888 Active 28 DOM
-
2026-06-16days on market $458,888 Active 27 DOM
-
2026-06-15price $458,888 Active 26 DOM
-
2026-06-15days on market $459,990 Active 26 DOM
-
2026-06-13days on market $459,990 Active 24 DOM
-
2026-06-13statusdays on market $459,990 Active 23 DOM
-
2026-06-10days on market $459,990 Under Contract - Continue to Show 21 DOM
-
2026-06-09days on market $459,990 Under Contract - Continue to Show 20 DOM
-
2026-06-08days on market $459,990 Under Contract - Continue to Show 19 DOM
-
2026-06-07days on market $459,990 Under Contract - Continue to Show 18 DOM
-
2026-06-05statusdays on market $459,990 Under Contract - Continue to Show 15 DOM
-
2026-06-03days on market $459,990 Active 14 DOM
-
2026-06-03days on market $459,990 Active 13 DOM
-
2026-06-01days on market $459,990 Active 12 DOM
-
2026-05-31days on market $459,990 Active 11 DOM
-
2026-05-20status Active
-
2026-05-20historical
-
2026-05-20price $469,990
-
2026-05-20status Active
-
2026-05-20historical
-
2026-05-20historical
-
2026-05-20$369,990 Active
-
2026-05-19status Active
-
2026-05-12historical Under Contract - Continue to Show
-
2026-05-08$469,990 Active
ⓘ Source: listings_history table (triggers on properties + properties_extension) + one-shot
backfill from property_details.listing_events for pre-trigger history.
Tax reassessment forecast CT · Partial reset (capped growth)
- Current annual tax
- $5,768 · $481/mo
- Projected year-2 tax
- $7,794 · $650/mo
- Expected delta
- +$2,026/yr (+$169/mo · 35.1%)
ⓘ Screening estimate from a state-policy table — verify with the county assessor before closing.
Climate risk First Street
- Flood 1/10 Low FEMA zone X (unshaded) · 0% chance over 30 yrs
- Wildfire 1/10 Low
- Heat 6/10 Major 7 d/yr ≥97°F today · 15 d/yr by 30 yrs out
- Wind 6/10 Major 41% chance of damaging wind over 30 yrs
- Air quality 4/10 Moderate 5 unhealthy d/yr today · 7 by 30 yrs out
Nearby sold comps map
Loading sold comps map…
Walkable amenities ~0.75 mi
Loading nearby amenities…
Taxation est. · year 1
- Rental income
- $48,696
- − Mortgage interest
- −$25,705
- − Property taxes
- −$5,768
- − Insurance
- −$2,294
- − Repairs & maintenance
- −$3,896
- − Management
- −$3,896
- − Depreciation
- −$13,349
- Taxable loss
- −$6,212
- Est. tax savings @ 24.0%
- +$1,491
- After-tax cash flow
- $3,021/yr
For passive investors: Depreciation is non-cash, so a rental often shows a tax loss while cash-flowing — sheltering income. Rental losses are passive: they offset passive income freely, and up to $25,000/yr can offset ordinary (W-2) income if you actively participate and your MAGI is under $100k (phasing out to $0 by $150k); unused losses carry forward. On sale, claimed depreciation is recaptured at up to 25%, and gains may owe capital-gains tax (a 1031 exchange can defer both). Figures are a year-1 estimate at your 24.0% rate — not tax advice; consult a CPA.
Schools (NCES district)
- District
- Bridgeport School District
- NCES district ID
- 0900450
- Math proficiency
- 9% ▼ -7.00%
- Reading proficiency
- 19% ▼ -10.00%
- Median HH income
- $41,507
- Composite
- 12.09/100
- National rank
- #9656
- State rank
- #151 of 153 in CT
Livability — Bridgeport
- Score
- 81/100
- State rank
- #15
- US rank
- #1374
Category grades
Schools grade is shown separately in the Schools card above.
Census & demographics
- Census place
- Bridgeport, CT
- County
- Fairfield County · 765,532 people
- City population
- 149,153
- Metro
- Bridgeport-Stamford-Norwalk, CT
- Population (ZIP)
- 12,146
- Household income
- $45,754
- Rent vs Own
- Severe rent burden
- 910.0
Population outlook (Greater Bridgeport County) Hauer SSP2
- By 2040
- 365,581
Race, ethnicity, and origin ACS 2023
- Neighborhood character
- Predominantly Hispanic (69%)
- Race & ethnicity
- Hispanic / Latino 69% Black 22% Two or more races 19% White 4% Asian 4%
- Hispanic origin (detail)
- Mexican 5% Puerto Rican 32% Cuban 1% Dominican 14%
- Common ancestry
- Hispanic 1% Russian 1% Estonian 0%
- Foreign-born
- 34% · Canada, Jamaica
- Languages at home
- 33% English-only · Spanish 56% French/Haitian/Cajun 4% Other Asian/Pacific 3%
Political lean MEDSL · Greater Bridgeport
- 2024 margin
- Strong D (+23.3) · D 60.9% · R 37.6% · Other 1.5%
- All cycles
- 2024: D+23.3
Not yet ingested
- Civics
- —
Market trends
- HPI YoY
- ▲ 18.29%
- Current HPI
- 530.5125
- Rent YoY
- ▲ 4.35%
- Metro
- Bridgeport-Stamford-Norwalk, CT
- State GDP YoY
- ▲ 1.06%
- F500 in state
- 38
Industry mix (Fortune 500 HQ in CT)
| Industry | F500 HQs | Revenue |
|---|---|---|
| Industrial Machinery | 4 | $38B |
|
||
| Insurance | 3 | $71B |
|
||
| Financial Services | 2 | $25B |
|
||
| Transportation / Logistics | 2 | $18B |
|
||
| Healthcare | 1 | $247B |
|
||
| Telecommunications | 1 | $55B |
|
||
Price history
+0.0% since first listed10 events — show timeline
- 2026-05-20 Relisted — Smart MLS
- 2026-05-20 Listing Removed — Smart MLS
- 2026-05-20 Price Changed $469,990 Smart MLS
- 2026-05-20 Relisted — Smart MLS
- 2026-05-20 Listing Removed — Smart MLS
- 2026-05-20 Listed $369,990 Smart MLS
- 2026-05-20 Listing Removed — Smart MLS
- 2026-05-19 Relisted — Smart MLS
- 2026-05-12 Contingent — Smart MLS
- 2026-05-08 Listed $469,990 Smart MLS
Property tax history
+0.2%/yrLatest (2023): $5,768 · +0.0% YoY. Source: county tax records.
Cash-flow waterfall
monthlySold comps — $/sqft
last 12 mo · ≤1 miLoading sold comps…