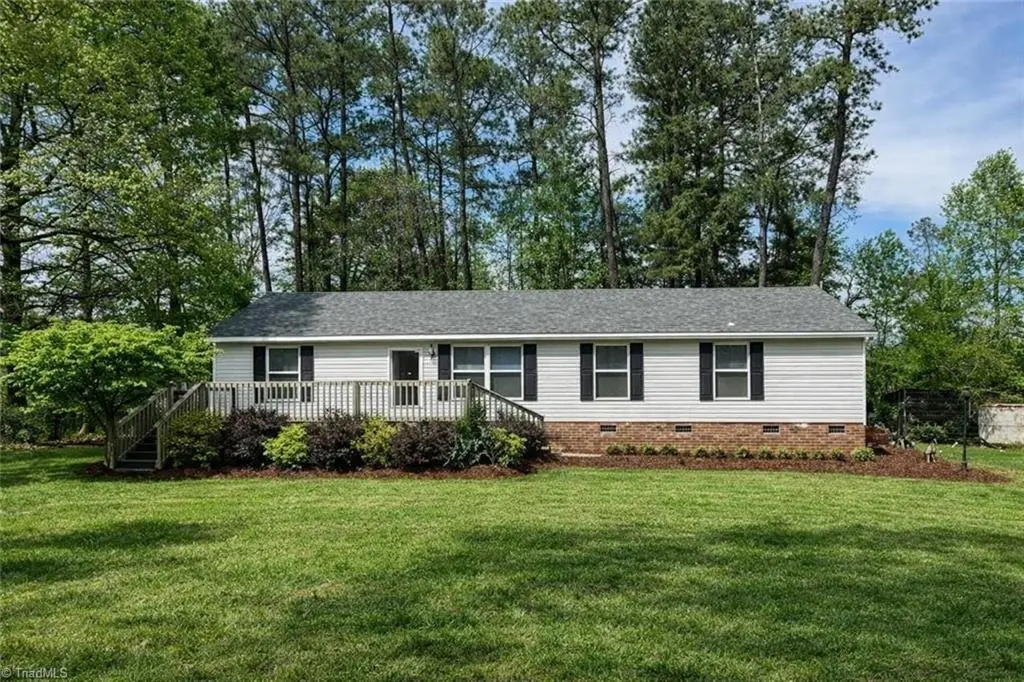
544 Little Pond Rd · Midway, NC
Flood risk 1/10 · Minimal
- FEMA flood zone
- X (unshaded)
- Chance of flooding over 30 yrs
- 0.0%
- Est. flood insurance / yr
- $507 – $1,088
Fire risk 3/10 · Minor
- Est. fire insurance / yr
- $906 – $1,684
Heat risk 5/10 · Moderate
- Hot days now (above 103°F)
- 7 days/yr
- Hot days in 30 yrs
- 18 days/yr
Wind risk 4/10 · Minor
- Chance of severe wind over 30 yrs
- 9.0%
Air-quality risk 2/10 · Minimal
- Unhealthy air days now
- 1 days/yr
- Unhealthy air days in 30 yrs
- 1 days/yr
Risk factors via First Street. Map © Google.
Why this score? — see what drove the C grade
The composite is a weighted blend of 9 inputs, each scored 0–100. Each bar is that input's sub-score; the figure is the points it added to the 100-point composite (weight × sub-score).
- Cash flow +20.3/30.0
- ARV discount +15.0/15.0
- DSCR +6.4/10.0
- Schools +4.3/10.0
- 1% rule +4.2/10.0
- Rent growth +3.0/5.0
- Livability +3.0/5.0
- Condition / age +2.5/5.0
- Appreciation +0.0/10.0
$224,900
🖨 Deal sheet 📄 Offer letter ✓ Due diligence
Listing remarks
Tucked away on a quiet dead-end street in Northern Davidson County, this private property offers the perfect blend of comfort, space, and affordability. Thoughtfully updated with a new roof (2024), fresh interior paint, new blinds, and refreshed landscaping, the home is truly move-in ready. Enjoy peaceful mornings on the large front porch which is also perfect for entertaining. The property also features a spacious outbuilding ideal for storage, tools, or hobbies, plus an RV hookup with 30-amp service—perfect for guests or recreation. The HVAC system has been recently tuned, cleaned, and charged for added peace of mind. Conveniently located in a sought-after school district, adding to
Key facts
- 0.99 acre lot
- Built 2003
- Listed 26 days
Property features AI
Finance
- Other: Private maintained road
- Financial info: Annual tax amount listed (excluded per instructions)
- HOA & community: No homeowners association; Subdivision: Kimberly Village; Association listed as Winston-Salem (no active association)
Exterior
- Parking: Driveway with gravel
- Security: Security system; Carbon monoxide detector(s); Smoke detector(s)
- Utilities: Public water; Public sewer; Electric water heater; Electric power
- Home design: Residential manufactured home (double wide); One-story; Built in 2003; Den fireplace with gas log
- Construction: Vinyl siding; Crawl space foundation; Shingle roof (not explicitly listed — inferred standard for manufactured homes)
- Exterior features: Exterior lighting; Cable available; Dead end, level and secluded lot in a subdivision; Subdivided lot
Interior
- Kitchen: Microwave; Dishwasher; Free-standing range; Kitchen island; Electric water heater
- Bedrooms: Primary on main
- Flooring: Carpet; Laminate; Vinyl
- Bathrooms: 2 full bathrooms
- Heating & cooling: Heat pump (heating and cooling); Electric heating
- Interior features: Primary bedroom located on the main level; Attic with no access; Insulated and storm doors; Storm windows; Built-in features; Ceiling fans; Deadbolts; Soaking tub; Kitchen island; Separate shower; Sound system; Vaulted ceilings
- Laundry & utility: Washer hookup on main level; Dryer connection
Neighborhood map
What this means for you Summary
Snapshot
- This is a 3-bed/2.0-bath single-family listed at $225k.
Deal economics
- At list price, monthly cash flow is $289 ($3k/yr) — positive.
- The deal already cash-flows at list — no discount required.
- To meet the 1% rule (rent ≥ 1% of price), the offer needs to be $207k (7.8% below list).
- Recommended offer: $207k (7.8% below list) — sets the bar for 1% rule.
- Cap rate 7.8% vs local median 3.7% in Midway — top-decile yield for the area; either an underpriced asset or a hidden risk that comps aren't pricing in. Stress-test before assuming the spread holds.
Location & tenants
- Location reads 60/100 on livability (#508 in NC) — a middle-class / working-renter tenant base. Strengths: cost of living A+, housing A+, crime B+; Watch: employment D+, amenities F, commute F.
- Davidson County Schools (rural): math 50% / reading 50% proficiency, ranked #62 of 178 in NC (top 35%) — acceptable for families but not a draw, mixed tenant base, ~2y average lease.
- Zoned schools: Midway Elementary (math 58% / reading 53%, grade C, #293 of 1,410 statewide, top 21%, 498 students, 47% FRL); Oak Grove Middle (math 57% / reading 62%, grade B, #48 of 475 statewide, top 11%, 727 students, 37% FRL); Oak Grove High (math 72% / reading 71%, grade B+, #115 of 535 statewide, top 21%, 958 students, 30% FRL) — zoned schools at 38% FRL track the district average.
- Zoned-school proficiency averages 62% at this address vs 50% district-wide (+12 pts) — the actual schools serving this property are materially stronger than the Davidson County Schools average implies; a family-tenant draw the district grade alone would hide.
- Market conditions: Rents rising (+2.2%/yr); 40 active listings in the ZIP; 2 comparable units currently listed for rent nearby; 990 units permitted in Davidson County in 2024 (54 in 5+ unit buildings).
- This rent runs 40% of the median local income ($62k/yr) — at the standard rent-burdened threshold; future hikes will face affordability resistance.
Forward outlook
- Local home prices are declining (-3.0%/yr); year-one equity from $2k of loan paydown is wiped out by about $7k of value loss. Plan a longer hold.
- Davidson County population projected to shrink 6% by 2050 — rents likely to lag national; underwrite the cash flow, not the appreciation.
Negotiation context
- It's been on market 26 days — a 2% lower offer ($222k) is reasonable based on typical stale-listing flexibility.
- Current owner paid $112k; list at $225k implies a 101% gain — meaningful room to come down on a strong offer.
Risks & watch-outs
- Climate carrying-cost: extreme-heat days projected 7→18/yr by 2055 (HVAC capex compounding) — expect insurance premiums to compound above CPI over the hold.
Questions for the listing agent
- Is there a deadline driving the sale (1031 exchange, divorce, estate, relocation)? That informs how much negotiation room exists.
- Schools are F-rated, which usually means shorter tenancies and higher turnover. Who's the typical renter profile here, and what's been the actual vacancy rate?
- What's the average days-on-market for RENTAL listings here right now (not sales)? A rising rental-DOM trend means longer vacancies and softer asking-rent achievability than the comps imply.
- What's the recent tenant-quality profile in this submarket — average credit score on applications, eviction rate, late-payment / NSF rate, and stable-employment percentage? A property-management company in the area should have these aggregated.
- How much new for-sale + rental construction is in the pipeline within 1–3 miles? Heavy new supply typically softens prices + rents 12–24 months out; constrained supply supports both.
Investment metrics
- 1% rule
- 0.92% ✗
- Cap rate
- 7.83%
- Cash-on-cash
- 5.50%
- DSCR
- 1.24
- GRM
- 9.0
CMA / ARV
- ARV (on-the-fly)
- $325,620
- Comps found
- 11
Show comp detail 11 sales within ~0.75 mi
| Address | Dist | Beds/Ba | Sqft | Sold | Price | $/sf | Match |
|---|---|---|---|---|---|---|---|
| 543 Lori Ln | 0.04mi | 3/2.5 | 1,717 (+6%) | 3mo | $345,000 | $201 | 83 |
| 561 Lori Ln | 0.04mi | 3/2.0 | 1,493 (-8%) | 7mo | $330,000 | $221 | 79 |
| 1830 Eller Rd | 0.41mi | 3/2.0 | 1,668 (+3%) | 0mo | $325,000 | $195 | 76 |
| 1106 Crescent Ct | 0.40mi | 3/2.5 | 1,581 (-2%) | 8mo | $292,500 | $185 | 69 |
| 240 Midpines Dr | 0.64mi | 3/2.0 | 1,652 (+2%) | 9mo | $285,000 | $173 | 59 |
| 180 Woodwind Dr | 0.27mi | 3/2.0 | 1,449 (-11%) | 14mo | $293,000 | $202 | 58 |
| 162 Midpines Dr | 0.71mi | 3/1.5 | 1,536 (-5%) | 8mo | $251,000 | $163 | 50 |
| 6102 Hunters Ridge Dr | 0.64mi | 3/2.0 | 1,717 (+6%) | 13mo | $312,000 | $182 | 50 |
| 246 Sinkland Dr | 0.68mi | 3/1.5 | 1,521 (-6%) | 12mo | $305,000 | $201 | 46 |
| 175 Frances Ln | 0.73mi | 3/2.0 | 1,541 (-5%) | 15mo | $312,000 | $202 | 45 |
| 6201 Hunters Ridge Dr | 0.73mi | 3/2.0 | 1,401 (-14%) | 21mo | $317,000 | $226 | 26 |
Match score weights: distance 35% · size 25% · config 20% · recency 20%. Top-matched comps best support the ARV.
Projected returns pro-forma
-3.0% appreciation · 2.19% rent growth · sell at horizon
- IRR
- -8.6%
- Equity multiple
- 0.69×
- Total profit
- $-19,834
- Equity at exit
- $33,533
- IRR
- -0.2%
- Equity multiple
- 0.99×
- Total profit
- $-756
- Equity at exit
- $19,445
Cash invested: $62,972 (down + closing). Projections, not guarantees.
Landlord ↔ Tenant lean methodology
- Overall (STATE)
- 85 Strongly Landlord-Friendly
- State North Carolina
- 85 Strongly Landlord-Friendly · R+3
- County
- — inherits STATE
- City
- — inherits STATE
ZIP-level market 27127
- Home prices YoY
- -34.9%
- Rents YoY
- 2.2%
- Active inventory
- 40
- Price-to-rent
- 9.0×
Monthly cashflow live
- Estimated rent
- $2,073 medium interval (Pro) →
- Mortgage (P&I)
- −$1,179
- Tax from tax record
- −$76 /mo · $913/yr
- Insurance
- −$94
- HOA
- −$0
- Vacancy / Maint / Mgmt
- −$435
- Net cashflow
- $289
Break-even live
UW: 25.0% down · 7.5% · 30yr · 1.5% tax · 5.0% vac · 8.0% maint · 8.0% mgmt
Financing live
Cash to close
- Down payment
- $56,225
- Closing costs
- $6,747
- Reserves months
- —
- Total cash needed
- —
Loan-product check · same deal, 3 products live
Conventional
25% down · 7.5% · 30yr
- Down + closing
- —
- Monthly P&I
- —
- Monthly cashflow
- —
- DSCR
- —
- Eligible?
- —
Personal DTI + credit; lowest rate.
DSCR
20% down · 8.5% · 30yr
- Down + closing
- —
- Monthly P&I
- —
- Monthly cashflow
- —
- DSCR
- —
- Eligible?
- —
No personal income docs; deal must DSCR.
Hard money
10% down · 12.0% · 12mo
- Down + closing
- —
- Monthly P&I
- —
- Monthly cashflow
- —
- DSCR
- —
- Eligible?
- —
Short-term bridge; refi at stabilization.
Rent comps 2 comps
| Address | Beds | Baths | Sqft | Rent | $/sqft | DOM | Units | Dist |
|---|---|---|---|---|---|---|---|---|
| 203 Lois Ln Lexington, NC | 3.0 | 2.0 | 1734 | $2,155 | $1.24 | 14d | 1 | 1.27mi |
| 6100 Radds St Lexington, NC | 3.0 | 2.0 | 1690 | $1,895 | $1.12 | 23d | 1 | 1.30mi |
Listing history 5 events
-
2026-05-05status Pending
-
2026-04-13historical Due Diligence Period
-
2026-04-08$224,900 Active
-
2003-06-09soldstatus $112,000
-
1996-03-01soldstatus $10,000
ⓘ Source: listings_history table (triggers on properties + properties_extension) + one-shot
backfill from property_details.listing_events for pre-trigger history.
Tax reassessment forecast NC · Resets to sale price
- Current annual tax
- $913 · $76/mo
- Projected year-2 tax
- $1,844 · $154/mo
- Expected delta
- +$931/yr (+$78/mo · 101.9%)
ⓘ Screening estimate from a state-policy table — verify with the county assessor before closing.
Climate risk First Street
- Flood 1/10 Low FEMA zone X (unshaded) · 0% chance over 30 yrs
- Wildfire 3/10 Moderate
- Heat 5/10 Major 7 d/yr ≥103°F today · 18 d/yr by 30 yrs out
- Wind 4/10 Moderate 9% chance of damaging wind over 30 yrs
- Air quality 2/10 Low 1 unhealthy d/yr today · 1 by 30 yrs out
Nearby sold comps map
Loading sold comps map…
Walkable amenities ~0.75 mi
Loading nearby amenities…
Taxation est. · year 1
- Rental income
- $24,878
- − Mortgage interest
- −$12,598
- − Property taxes
- −$913
- − Insurance
- −$1,124
- − Repairs & maintenance
- −$1,990
- − Management
- −$1,990
- − Depreciation
- −$6,543
- Taxable loss
- −$281
- Est. tax savings @ 24.0%
- +$67
- After-tax cash flow
- $3,530/yr
For passive investors: Depreciation is non-cash, so a rental often shows a tax loss while cash-flowing — sheltering income. Rental losses are passive: they offset passive income freely, and up to $25,000/yr can offset ordinary (W-2) income if you actively participate and your MAGI is under $100k (phasing out to $0 by $150k); unused losses carry forward. On sale, claimed depreciation is recaptured at up to 25%, and gains may owe capital-gains tax (a 1031 exchange can defer both). Figures are a year-1 estimate at your 24.0% rate — not tax advice; consult a CPA.
Schools (NCES district)
- District
- Davidson County Schools
- NCES district ID
- 3701140
- Math proficiency
- 50% ▲ 2.00%
- Reading proficiency
- 50% ▲ 2.00%
- Median HH income
- $49,696
- Composite
- 42.76/100
- National rank
- #3157
- State rank
- #62 of 178 in NC
Livability — Midway
- Score
- 60/100
- State rank
- #508
- US rank
- #18622
Category grades
Schools grade is shown separately in the Schools card above.
Census & demographics
- Census place
- Midway, NC
- County
- Forsyth County · 397,191 people
- Metro
- Winston-Salem, NC
- Population (ZIP)
- 41,443
- Household income
- $61,926
- Rent vs Own
- Severe rent burden
- 975.0
Population outlook (Davidson County) Hauer SSP2
- Today (2025)
- 167,156 people
- By 2030
- 167,216 · +0.0%
- By 2040
- 164,524 · -1.6%
- By 2050
- 157,229 · -5.9%
- By 2075
- 138,084 · -17.4%
- By 2100
- 112,729 · -32.6%
Race, ethnicity, and origin ACS 2023
- Neighborhood character
- Diverse neighborhood (Simpson 0.66)
- Race & ethnicity
- White 47% Black 27% Hispanic / Latino 21% Two or more races 12% Asian 1%
- Hispanic origin (detail)
- Mexican 11% Puerto Rican 1%
- Common ancestry
- Italian 2% Slovak 1% Serbian 1%
- Foreign-born
- 11% · Canada, Jamaica, China
- Languages at home
- 79% English-only · Spanish 19%
Political lean MEDSL · Davidson
- 2024 margin
- Solid R (+47.1) · D 25.9% · R 73.0% · Other 1.1%
- 2008→2024 swing
- -13.5pp toward R · 2008: -33.5pp · 2024: -47.1pp
- All cycles
- 2024: R+47.1 2020: R+47.5 2016: R+49.4 2012: R+40.9 2008: R+33.5
Not yet ingested
- Civics
- —
Market trends
- HPI YoY
- ▼ -124.06%
- Current HPI
- 231.8755
- Rent YoY
- ▲ 2.19%
- Metro
- Winston-Salem, NC
- State GDP YoY
- ▲ 3.28%
- F500 in state
- 26
Industry mix (Fortune 500 HQ in NC)
| Industry | F500 HQs | Revenue |
|---|---|---|
| Financial Services | 2 | $213B |
|
||
| Retail | 2 | $95B |
|
||
| Industrial Conglomerate | 1 | $38B |
|
||
| Metals / Steel | 1 | $35B |
|
||
| Utilities | 1 | $30B |
|
||
| Industrial Machinery | 1 | $19B |
|
||
Price history
+2149.0% since first listed5 events — show timeline
- 2026-05-05 Pending — Triad MLS
- 2026-04-13 Contingent — Triad MLS
- 2026-04-08 Listed $224,900 Triad MLS
- 2003-06-09 Sold (Public Records) $112,000 Public Records
- 1996-03-01 Sold (Public Records) $10,000 Public Records
Property tax history
+0.6%/yrLatest (2025): $913 · +0.0% YoY. Source: county tax records.
Cash-flow waterfall
monthlySold comps — $/sqft
last 12 mo · ≤1 miLoading sold comps…