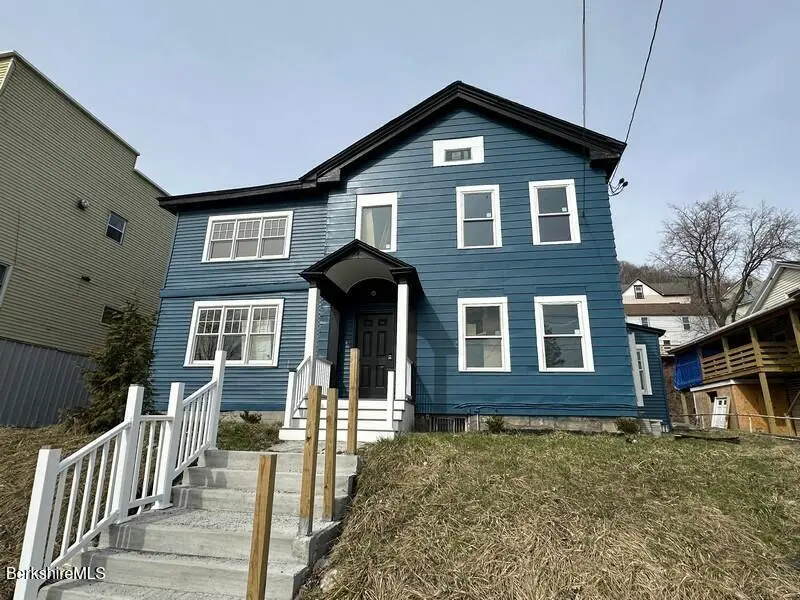
 Duplex
131 State St · North Adams, MA
Flood risk 5/10 · Moderate
- FEMA flood zone
- X
- Chance of flooding over 30 yrs
- 0.5%
- Est. flood insurance / yr
- $473 – $860
Fire risk 3/10 · Minor
- Est. fire insurance / yr
- $915 – $1,699
Heat risk 3/10 · Minor
- Hot days now (above 92°F)
- 9 days/yr
- Hot days in 30 yrs
- 20 days/yr
Wind risk 4/10 · Minor
- Chance of severe wind over 30 yrs
- 9.0%
Air-quality risk 2/10 · Minimal
- Unhealthy air days now
- 0 days/yr
- Unhealthy air days in 30 yrs
- 1 days/yr
Risk factors via First Street. Map © Google.
Why this score? — see what drove the B+ grade
The composite is a weighted blend of 9 inputs, each scored 0–100. Each bar is that input's sub-score; the figure is the points it added to the 100-point composite (weight × sub-score).
- Cash flow +30.0/30.0
- ARV discount +15.0/15.0
- 1% rule +10.0/10.0
- DSCR +10.0/10.0
- Livability +2.8/5.0
- Rent growth +2.5/5.0
- Condition / age +2.5/5.0
- Appreciation +1.9/10.0
- Schools +1.8/10.0
$99,900
🖨 Deal sheet (PDF) 📄 Offer letter ✓ Due diligence
Multi-family units
County records classify this as Multi-Family (2-4 Unit). Listing-text estimate: 2 units. confirmed
Listing remarks MLS
Two family flat located just outside of downtown North Adams. Walking distance to MASS MoCA, restaurants, and many local shops. This duplex features two bedrooms and one bathroom in lower unit and one bedroom and one bathroom in upper unit. Separate electric, heating, and hot water systems. Roof, exterior painting, windows, electric service, wiring, and framing have recently been updated.
Key facts
- 4,792 sq ft lot
- Built 1900
- Listed 107 days
Tags
Neighborhood map
What this means for you Summary
Snapshot
- This is a 2 × 3-bed/2.0-bath units multifamily listed at $100k.
Deal economics
- At list price, monthly cash flow is $2k ($23k/yr) — positive. Per door: $964/mo.
- The deal already cash-flows at list — no discount required.
- Meets the 1% rule at list price ($3k rent vs $100k).
- Recommended offer: $91k (9.0% below list) — sets the bar for market timing.
- Cap rate 29.5% vs local median 5.9% in North Adams — top-decile yield for the area; either an underpriced asset or a hidden risk that comps aren't pricing in. Stress-test before assuming the spread holds.
Location & tenants
- Location reads 55/100 on livability (#242 in MA) — a working-class tenant base; expect higher turnover. Strengths: housing A+, cost of living A-; Watch: employment C-, health & safety D, crime F.
- North Adams (town): math 14% / reading 29% proficiency, ranked #291 of 302 in MA (top 96%) — low school quality limits family demand, transient renter base, plan for 1-2y turnover.
- Zoned schools: Brayton (math 8% / reading 27%, grade F, #819 of 938 statewide, top 88%, 228 students, 0% FRL); Drury High (math 16% / reading 24%, grade F, #308 of 343 statewide, top 91%, 493 students, 0% FRL) — zoned schools average 0% FRL vs 53% district-wide (53 pts lower); this property's tenant base skews higher-income than the district average.
- Market conditions: 99 active listings in the ZIP; 1 comparable units currently listed for rent nearby; 130 units permitted in Berkshire County in 2024 (10 in 5+ unit buildings).
Forward outlook
- Local home prices are declining (-3.0%/yr); year-one equity from $691 of loan paydown is wiped out by about $3k of value loss. Plan a longer hold.
- Berkshire County population projected at -24% by 2050 — secular population decline; favor cash flow + early exit over multi-decade hold.
- At projected returns (-3.0% appreciation + 3.0% rent growth), your $28k cash investment doubles in ~2 years — after that, you're playing with house money.
Negotiation context
- It's been on market 108 days — a 9% lower offer ($91k) is reasonable based on typical stale-listing flexibility.
- 14 sale attempts since 27y ago; this cycle's ask has dropped $10k (9%) from the opening price — seller is motivated, your offer sets the floor, not the list.
- Current owner paid $43k; list at $100k implies a 132% gain — meaningful room to come down on a strong offer.
Risks & watch-outs
- Watch-outs: built in 1900 — expect roof / HVAC / electrical / plumbing capex.
- Climate carrying-cost: moderate flood risk — expect insurance premiums to compound above CPI over the hold.
Questions for the listing agent
- It's been on market 108 days. Have you received any prior offers? Is the seller open to a 9% concession, seller financing, or rate buy-down credit?
- Can we see the unit-by-unit rent roll, current vacancy, and any below-market leases? What's the average tenancy length?
- What capital expenditures (roof, boiler, parking lot, exteriors) have been made in the last 5 years, and what's planned in the next 2?
- Built in 1900 — when were the roof, HVAC, electrical panel, plumbing, and water heater last replaced?
- Why hasn't it sold? Are there any deal-killer items the seller is aware of (foundation, flood, title, zoning, code violations)?
- Is there a deadline driving the sale (1031 exchange, divorce, estate, relocation)? That informs how much negotiation room exists.
- Schools are F-rated, which usually means shorter tenancies and higher turnover. Who's the typical renter profile here, and what's been the actual vacancy rate?
- Crime grade is F in this area — have there been break-ins, vandalism, or insurance claims at this property in the last 3 years? What carrier currently insures it and at what premium?
- What's the average days-on-market for RENTAL listings here right now (not sales)? A rising rental-DOM trend means longer vacancies and softer asking-rent achievability than the comps imply.
- What's the recent tenant-quality profile in this submarket — average credit score on applications, eviction rate, late-payment / NSF rate, and stable-employment percentage? A property-management company in the area should have these aggregated.
- How much new apartment / multifamily construction is in the pipeline within 1–3 miles? Heavy new supply (>2% of stock underway) typically softens rents 12–24 months out; light construction supports rent growth.
Investment metrics
- 1% rule
- 3.33% ✓
- Cap rate
- 29.46%
- Cash-on-cash
- 82.75%
- DSCR
- 4.68
- GRM
- 2.5
CMA / ARV
- ARV (median comp)
- $184,442
- List price
- $99,900
- Delta
- -45.84%
- Verdict
- UNDERPRICED
- Comps
- 20 within 1.0 mi
Show comp detail 3 sales within ~0.75 mi
| Address | Dist | Beds/Ba | Sqft | Sold | Price | $/sf | Match |
|---|---|---|---|---|---|---|---|
| 44-46 Charles St | 0.67mi | 4/2.0 | 2,142 (-3%) | 13mo | $140,000 | $65 | 52 |
| 35 Willow Dell | 0.46mi | 4/3.0 | 2,149 (-3%) | 23mo | $305,000 | $142 | 51 |
| 28 Washington Ave | 0.33mi | 3/2.0 (-1) | 1,977 (-11%) | 18mo | $100,000 | $51 | 47 |
Match score weights: distance 35% · size 25% · config 20% · recency 20%. Top-matched comps best support the ARV.
Projected returns pro-forma
-3.0% appreciation · 3.0% rent growth · sell at horizon
- IRR
- 83.1%
- Equity multiple
- 4.82×
- Total profit
- $106,721
- Equity at exit
- $14,895
- IRR
- 86.4%
- Equity multiple
- 9.99×
- Total profit
- $251,354
- Equity at exit
- $8,638
Cash invested: $27,972 (down + closing). Projections, not guarantees.
Landlord ↔ Tenant lean methodology
- Overall (STATE)
- 20 Strongly Tenant-Friendly
- State Massachusetts
- 20 Strongly Tenant-Friendly · D+15
- County
- — inherits STATE
- City
- — inherits STATE
ZIP-level market 01247
- Home prices YoY
- -2.0%
- Active inventory
- 99
- Price-to-rent
- 5.0×
Monthly cashflow live
- Estimated rent
- $3,329 high interval (Pro) →
- Mortgage (P&I)
- −$524
- Tax from tax record
- −$136 /mo · $1,626/yr
- Insurance
- −$42
- HOA
- −$0
- Lot rent
- −$0
- Vacancy / Maint / Mgmt
- −$699
- Net cashflow
- $1,929
Break-even live
Sensitivity live
| Price | -10% $1,985 | -5% $1,957 | +0% $1,929 | +5% $1,901 | +10% $1,872 |
|---|---|---|---|---|---|
| Rent | -10% $1,666 | -5% $1,797 | +0% $1,929 | +5% $2,060 | +10% $2,192 |
| Rate | -1.0pp $1,979 | -0.5pp $1,954 | base $1,929 | +0.5pp $1,903 | +1.0pp $1,877 |
2-unit breakdown (identical units grouped — click to expand)
| Units | Beds | Baths | Est. rent |
|---|---|---|---|
| 2× units | 3 | 2 | $3,330 |
| #1 | 3 | 2 | $1,665 |
| #2 | 3 | 2 | $1,665 |
| Total (2 units) | $3,329 | ||
UW: 25.0% down · 7.5% · 30yr · 1.5% tax · 5.0% vac · 8.0% maint · 8.0% mgmt
Financing live
Cash to close
- Down payment
- $24,975
- Closing costs
- $2,997
- Reserves months
- —
- Total cash needed
- —
Loan-product check · same deal, 3 products live
Conventional
25% down · 7.5% · 30yr
- Down + closing
- —
- Monthly P&I
- —
- Monthly cashflow
- —
- DSCR
- —
- Eligible?
- —
Personal DTI + credit; lowest rate.
DSCR
20% down · 8.5% · 30yr
- Down + closing
- —
- Monthly P&I
- —
- Monthly cashflow
- —
- DSCR
- —
- Eligible?
- —
No personal income docs; deal must DSCR.
Hard money
10% down · 12.0% · 12mo
- Down + closing
- —
- Monthly P&I
- —
- Monthly cashflow
- —
- DSCR
- —
- Eligible?
- —
Short-term bridge; refi at stabilization.
Rent comps 1 comps
| Address | Beds | Baths | Sqft | Rent | $/sqft | DOM | Units | Dist |
|---|---|---|---|---|---|---|---|---|
| 40 Cady St North Adams, MA | 3.0 | 1.5 | 1467 | $2,475 | $1.69 | 46d | 1 | 0.71mi |
Listing history 44 events
-
2026-06-08days on market $99,900 Active 108 DOM
-
2026-06-07days on market $99,900 Active 107 DOM
-
2026-06-07days on market $99,900 Active 106 DOM
-
2026-06-04days on market $99,900 Active 103 DOM
-
2026-06-02days on market $99,900 Active 102 DOM
-
2026-06-01days on market $99,900 Active 101 DOM
-
2026-05-31days on market $99,900 Active 100 DOM
-
2026-05-31days on market $99,900 Active 99 DOM
-
2026-05-06price $99,900 391-char remark
Show marketing remark (391 chars)
Two family flat located just outside of downtown North Adams. Walking distance to MASS MoCA, restaurants, and many local shops. This duplex features two bedrooms and one bathroom in lower unit and one bedroom and one bathroom in upper unit. Separate electric, heating, and hot water systems. Roof, exterior painting, windows, electric service, wiring, and framing have recently been updated.
-
2026-02-19$109,900 Active 391-char remark
Show marketing remark (391 chars)
Two family flat located just outside of downtown North Adams. Walking distance to MASS MoCA, restaurants, and many local shops. This duplex features two bedrooms and one bathroom in lower unit and one bedroom and one bathroom in upper unit. Separate electric, heating, and hot water systems. Roof, exterior painting, windows, electric service, wiring, and framing have recently been updated.
-
2025-08-08historical
-
2025-06-06price $100,000
-
2025-04-02price $117,900
-
2025-03-02$124,900 Active
-
2022-11-30soldstatus $43,000 Closed
-
2022-11-08status Pending
-
2022-11-01status Active
-
2022-09-24status Pending
-
2022-09-07price $49,900
-
2022-08-13price $59,900
-
2022-07-21price $75,000
-
2022-07-01$79,900 Active
-
2021-07-02historical
-
2021-04-21historical
-
2021-03-18$65,000
-
2021-03-18$65,000
-
2021-02-15historical
-
2021-01-15$69,900
-
2020-12-31historical
-
2020-10-30historical
-
2020-10-02$69,900
-
2020-10-02$75,000
-
2019-04-23historical
-
2017-04-23$81,900
-
2009-07-18historical
-
2008-11-17$96,000
-
2005-07-31soldstatus $80,000
-
2005-05-31soldstatus $80,000
-
2005-04-28$89,000
-
2005-03-09historical
-
2004-09-09$89,000
-
1999-08-27soldstatus $40,000
-
1999-08-27soldstatus $40,000
-
1999-06-25$45,000
ⓘ Source: listings_history table (triggers on properties + properties_extension) + one-shot
backfill from property_details.listing_events for pre-trigger history.
Tax reassessment forecast MA · Partial reset (capped growth)
- Current annual tax
- $1,626 · $136/mo
- Projected year-2 tax
- $1,626 · $136/mo
- Expected delta
- $0/yr ($0/mo · 0.0%)
ⓘ Screening estimate from a state-policy table — verify with the county assessor before closing.
Climate risk First Street
- Flood 5/10 Major FEMA zone X · 50% chance over 30 yrs
- Wildfire 3/10 Moderate
- Heat 3/10 Moderate 9 d/yr ≥92°F today · 20 d/yr by 30 yrs out
- Wind 4/10 Moderate 9% chance of damaging wind over 30 yrs
- Air quality 2/10 Low 0 unhealthy d/yr today · 1 by 30 yrs out
Nearby sold comps map
Loading sold comps map…
Walkable amenities ~0.75 mi
Loading nearby amenities…
Taxation est. · year 1
- Rental income
- $39,948
- − Mortgage interest
- −$5,596
- − Property taxes
- −$1,626
- − Insurance
- −$500
- − Repairs & maintenance
- −$3,196
- − Management
- −$3,196
- − Depreciation
- −$2,906
- Taxable income
- $22,929
- Est. tax owed @ 24.0%
- −$5,503
- After-tax cash flow
- $17,644/yr
For passive investors: Depreciation is non-cash, so a rental often shows a tax loss while cash-flowing — sheltering income. Rental losses are passive: they offset passive income freely, and up to $25,000/yr can offset ordinary (W-2) income if you actively participate and your MAGI is under $100k (phasing out to $0 by $150k); unused losses carry forward. On sale, claimed depreciation is recaptured at up to 25%, and gains may owe capital-gains tax (a 1031 exchange can defer both). Figures are a year-1 estimate at your 24.0% rate — not tax advice; consult a CPA.
Schools (NCES district)
- District
- North Adams
- NCES district ID
- 2508670
- Math proficiency
- 14% ▼ -13.00%
- Reading proficiency
- 29% ▼ -11.00%
- Median HH income
- $36,746
- Composite
- 17.83/100
- National rank
- #9006
- State rank
- #291 of 302 in MA
Livability — North Adams
- Score
- 55/100
- State rank
- #242
- US rank
- #23506
Category grades
Schools grade is shown separately in the Schools card above.
Census & demographics
- Census place
- North Adams, MA
- City population
- 14,967
- Population (ZIP)
- 14,967
Population outlook (Berkshire County) Hauer SSP2
- Today (2025)
- 119,723 people
- By 2030
- 114,608 · -4.3%
- By 2040
- 102,806 · -14.1%
- By 2050
- 91,305 · -23.7%
- By 2075
- 71,517 · -40.3%
- By 2100
- 57,988 · -51.6%
Race, ethnicity, and origin ACS 2023
- Neighborhood character
- Predominantly White (88%)
- Race & ethnicity
- White 88% Hispanic / Latino 5% Two or more races 4% Asian 3%
- Hispanic origin (detail)
- Puerto Rican 1%
- Common ancestry
- Lithuanian 15% Romanian 4% German 2%
- Foreign-born
- 5% · Canada
- Languages at home
- 95% English-only · Other Indo-European 2% Spanish 2% French/Haitian/Cajun 0%
Political lean MEDSL · Berkshire
- 2024 margin
- Solid D (+39.9) · D 68.9% · R 29.0% · Other 2.1%
- 2008→2024 swing
- -12.5pp toward R · 2008: 52.4pp · 2024: 39.9pp
- All cycles
- 2024: D+39.9 2020: D+47.1 2016: D+41.5 2012: D+53.7 2008: D+52.4
Not yet ingested
- Civics
- —
Market trends
- HPI YoY
- ▼ -6.22%
- Current HPI
- 298.8949
- Rent YoY
- —
- Metro
- —
- State GDP YoY
- ▲ 2.28%
- F500 in state
- 38
Industry mix (Fortune 500 HQ in MA)
| Industry | F500 HQs | Revenue |
|---|---|---|
| Technology | 3 | $17B |
|
||
| Insurance | 2 | $84B |
|
||
| Retail | 2 | $76B |
|
||
| Life Sciences | 1 | $43B |
|
||
| Energy Technology | 1 | $31B |
|
||
| Aerospace / Defense | 1 | $18B |
|
||
Price history
+122.0% since first listed36 events — show timeline
- 2026-05-06 Price Changed $99,900 BCMLS
- 2026-02-19 Listed $109,900 BCMLS
- 2025-08-08 Listing Removed — BCMLS
- 2025-06-06 Price Changed $100,000 BCMLS
- 2025-04-02 Price Changed $117,900 BCMLS
- 2025-03-02 Listed $124,900 BCMLS
- 2022-11-30 Sold (MLS) $43,000 BCMLS
- 2022-11-08 Pending — BCMLS
- 2022-11-01 Relisted — BCMLS
- 2022-09-24 Pending — BCMLS
- 2022-09-07 Price Changed $49,900 BCMLS
- 2022-08-13 Price Changed $59,900 BCMLS
- 2022-07-21 Price Changed $75,000 BCMLS
- 2022-07-01 Listed $79,900 BCMLS
- 2021-07-02 Listing Removed — BCMLS
- 2021-04-21 Listing Removed — BCMLS
- 2021-03-18 Listed $65,000 BCMLS
- 2021-03-18 Listed $65,000 BCMLS
- 2021-02-15 Listing Removed — BCMLS
- 2021-01-15 Listed $69,900 BCMLS
- 2020-12-31 Listing Removed — BCMLS
- 2020-10-30 Listing Removed — BCMLS
- 2020-10-02 Listed $75,000 BCMLS
- 2020-10-02 Listed $69,900 BCMLS
- 2019-04-23 Listing Removed — BCMLS
- 2017-04-23 Listed $81,900 BCMLS
- 2009-07-18 Listing Removed — BCMLS
- 2008-11-17 Listed $96,000 BCMLS
- 2005-07-31 Sold (MLS) $80,000 BCMLS
- 2005-05-31 Sold (Public Records) $80,000 Public Records
- 2005-04-28 Listed $89,000 BCMLS
- 2005-03-09 Listing Removed — BCMLS
- 2004-09-09 Listed $89,000 BCMLS
- 1999-08-27 Sold (Public Records) $40,000 Public Records
- 1999-08-27 Sold (MLS) $40,000 BCMLS
- 1999-06-25 Listed $45,000 BCMLS
Property tax history
+0.2%/yrLatest (2023): $1,626 · -13.0% YoY. Source: county tax records.
Cash-flow waterfall
monthlySold comps — $/sqft
last 12 mo · ≤1 miLoading sold comps…