211 Cherry St · Weatherford, TX
Flood risk 7/10 · Major
- FEMA flood zone
- X (unshaded)
- Chance of flooding over 30 yrs
- 0.99%
- Est. flood insurance / yr
- $507 – $1,088
Fire risk 6/10 · Moderate
- Est. fire insurance / yr
- $1,222 – $2,270
Heat risk 7/10 · Major
- Hot days now (above 107°F)
- 7 days/yr
- Hot days in 30 yrs
- 22 days/yr
Wind risk 4/10 · Minor
- Chance of severe wind over 30 yrs
- 19.0%
Air-quality risk 2/10 · Minimal
- Unhealthy air days now
- 1 days/yr
- Unhealthy air days in 30 yrs
- 2 days/yr
Risk factors via First Street. Map © Google.
Why this score? — see what drove the B- grade
The composite is a weighted blend of 9 inputs, each scored 0–100. Each bar is that input's sub-score; the figure is the points it added to the 100-point composite (weight × sub-score).
- Cash flow +30.0/30.0
- 1% rule +10.0/10.0
- DSCR +10.0/10.0
- ARV discount +7.5/15.0
- Schools +3.6/10.0
- Livability +3.6/5.0
- Rent growth +2.5/5.0
- Condition / age +2.5/5.0
- Appreciation +0.0/10.0
$99,000
🖨 Deal sheet 📄 Offer letter ✓ Due diligence
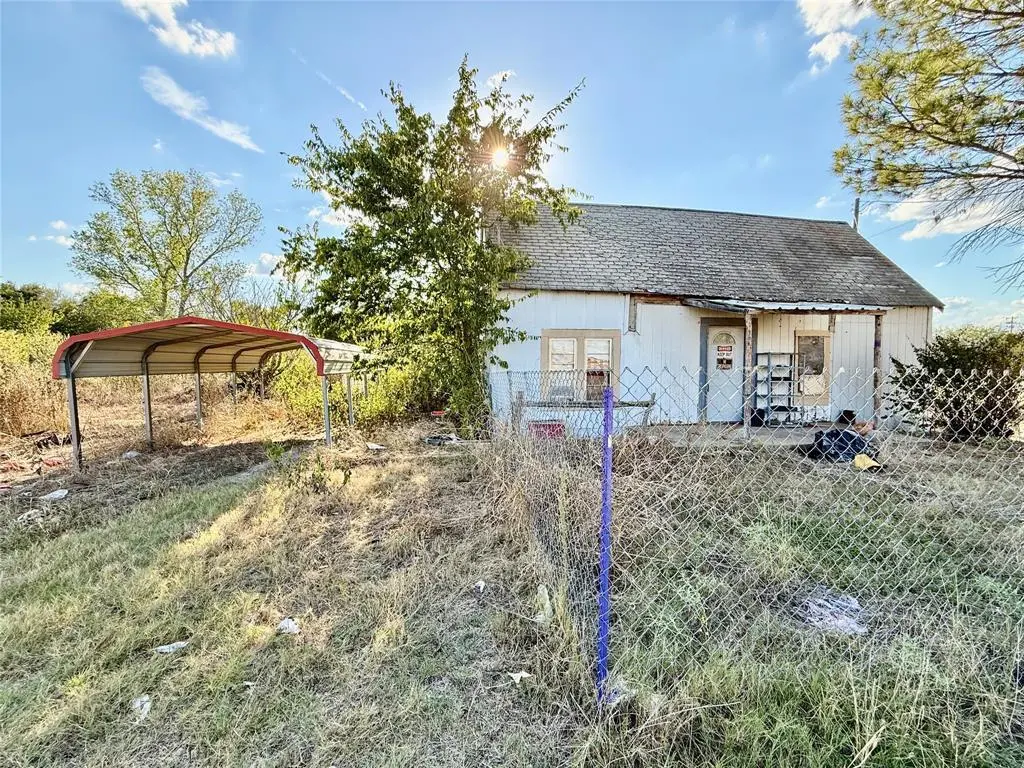
Listing remarks MLS
So many possibilities for this property! Over a half acre next to the Millsap Middle School & administrative offices. Perfect place to build multi-family housing to supply housing for the teachers that are currently unable to afford to buy in town and that don't want to make the commute from outlying communities. Millsap has VERY few rental properties overall and this is a niche ready to be filled and taken advantage of. Value is in the land. Home could be salvaged but is in a state of disrepair. Must see property for all investors interested in the Millsap area. The Millsap School district is highly touted for their outstanding teachers and facilities. Minutes from Mineral Wells and 20 minutes from Weatherford make it a hot location. All OFFERS need submitted through FinalOffer.com
Key facts
- Half acre
- 0.52 acre lot
- Parking
Tags
Neighborhood map
What this means for you Summary
Snapshot
- This is a 2-bed/1.0-bath single-family listed at $99k.
Deal economics
- At list price, monthly cash flow is $395 ($5k/yr) — positive.
- The deal already cash-flows at list — no discount required.
- Meets the 1% rule at list price ($2k rent vs $99k).
- Recommended offer: $87k (12.0% below list) — sets the bar for market timing.
- Cap rate 11.9% vs local median 2.7% in Weatherford — top-decile yield for the area; either an underpriced asset or a hidden risk that comps aren't pricing in. Stress-test before assuming the spread holds.
Location & tenants
- Location reads 71/100 on livability (#289 in TX) — a middle-class / working-renter tenant base. Strengths: cost of living A+, housing A+, crime B+; Watch: schools D+, health & safety D+, amenities F.
- Weatherford ISD (town): math 39% / reading 44% proficiency, ranked #321 of 826 in TX (top 39%) — families likely to look elsewhere, expect single-tenant / working-renter base with shorter leases.
- Market conditions: 70 active listings in the ZIP; 23 comparable units currently listed for rent nearby; rentals at typical pace (median 22d on market — plan ~3-4 weeks tenant-placement turnaround); 437 units permitted in Parker County in 2024 (0 in 5+ unit buildings).
Forward outlook
- Local home prices are declining (-3.0%/yr); year-one equity from $684 of loan paydown is wiped out by about $3k of value loss. Plan a longer hold.
- Parker County population projected at +32% by 2050 — long-run rental-demand tailwind backs the buy-and-hold thesis.
- At projected returns (-3.0% appreciation + 3.0% rent growth), your $28k cash investment doubles in ~7 years — after that, you're playing with house money.
Negotiation context
- It's been on market 248 days — a 12% lower offer ($87k) is reasonable based on typical stale-listing flexibility.
Risks & watch-outs
- Watch-outs: flood insurance adds $66/mo.
- Climate carrying-cost: major flood risk; major wildfire risk; extreme-heat days projected 7→22/yr by 2055 (HVAC capex compounding) — expect insurance premiums to compound above CPI over the hold.
Questions for the listing agent
- It's been on market 248 days. Have you received any prior offers? Is the seller open to a 12% concession, seller financing, or rate buy-down credit?
- What's the actual annual flood-insurance premium (NFIP or private), and is the property in a SFHA with mandatory coverage?
- Why hasn't it sold? Are there any deal-killer items the seller is aware of (foundation, flood, title, zoning, code violations)?
- Is there a deadline driving the sale (1031 exchange, divorce, estate, relocation)? That informs how much negotiation room exists.
- Schools are D-rated, which usually means shorter tenancies and higher turnover. Who's the typical renter profile here, and what's been the actual vacancy rate?
- What's the average days-on-market for RENTAL listings here right now (not sales)? A rising rental-DOM trend means longer vacancies and softer asking-rent achievability than the comps imply.
- What's the recent tenant-quality profile in this submarket — average credit score on applications, eviction rate, late-payment / NSF rate, and stable-employment percentage? A property-management company in the area should have these aggregated.
- How much new for-sale + rental construction is in the pipeline within 1–3 miles? Heavy new supply typically softens prices + rents 12–24 months out; constrained supply supports both.
Investment metrics
- 1% rule
- 1.52% ✓
- Cap rate
- 11.88%
- Cash-on-cash
- 19.97%
- DSCR
- 1.89
- GRM
- 5.5
CMA / ARV
- ARV (median comp)
- $263,436
- List price
- $99,000
- Delta
- -62.42%
- Verdict
- UNDERPRICED
- Comps
- 20 within 1.0 mi
Show comp detail 11 sales within ~0.75 mi
| Address | Dist | Beds/Ba | Sqft | Sold | Price | $/sf | Match |
|---|---|---|---|---|---|---|---|
| 210 Cherry St | 0.03mi | 2/1.0 | 1,044 (-3%) | 15mo | $229,995 | $220 | 82 |
| 206 Cherry St | 0.04mi | 3/2.0 (+1) | 1,039 (-3%) | 3mo | $254,900 | $245 | 81 |
| 1003 E Columbia St | 0.28mi | 2/2.0 | 1,124 (+5%) | 7mo | $205,000 | $182 | 69 |
| 214 Cedar St | 0.31mi | 3/2.0 (+1) | 1,167 (+9%) | 4mo | $275,000 | $236 | 59 |
| 322 Cherry St | 0.25mi | 3/2.0 (+1) | 1,181 (+10%) | 9mo | $235,000 | $199 | 55 |
| 1419 Cypress St | 0.43mi | 2/1.0 | 1,026 (-4%) | 23mo | $245,000 | $239 | 54 |
| 210 Mesquite St | 0.28mi | 3/2.0 (+1) | 1,140 (+6%) | 23mo | $249,000 | $218 | 48 |
| 802 Johnson St | 0.54mi | 2/2.0 | 1,232 (+15%) | 1mo | $210,000 | $170 | 45 |
| 244 Allen St | 0.32mi | 3/2.0 (+1) | 1,210 (+13%) | 17mo | $270,000 | $223 | 40 |
| 407 Hogle St | 0.74mi | 2/1.5 | 1,218 (+14%) | 2mo | $239,500 | $197 | 40 |
| 205 Hickory Ln | 0.53mi | 3/2.0 (+1) | 1,170 (+9%) | 15mo | $260,000 | $222 | 39 |
Match score weights: distance 35% · size 25% · config 20% · recency 20%. Top-matched comps best support the ARV.
Projected returns pro-forma
-3.0% appreciation · 3.0% rent growth · sell at horizon
- IRR
- 8.4%
- Equity multiple
- 1.33×
- Total profit
- $9,195
- Equity at exit
- $14,761
- IRR
- 17.7%
- Equity multiple
- 2.47×
- Total profit
- $40,758
- Equity at exit
- $8,560
Cash invested: $27,720 (down + closing). Projections, not guarantees.
Landlord ↔ Tenant lean methodology
- Overall (STATE)
- 87 Strongly Landlord-Friendly
- State Texas
- 87 Strongly Landlord-Friendly · R+5
- County
- — inherits STATE
- City
- — inherits STATE
ZIP-level market 76066
- Active inventory
- 70
- Price-to-rent
- 5.5×
Monthly cashflow live
- Estimated rent
- $1,508 high interval (Pro) →
- Mortgage (P&I)
- −$519
- Tax from tax record
- −$169 /mo · $2,033/yr
- Insurance
- −$41
- Flood insurance flood zone
- −$66 /mo · $798/yr
- HOA
- −$0
- Vacancy / Maint / Mgmt
- −$317
- Net cashflow
- $395
Break-even live
UW: 25.0% down · 7.5% · 30yr · 1.5% tax · 5.0% vac · 8.0% maint · 8.0% mgmt
Financing live
Cash to close
- Down payment
- $24,750
- Closing costs
- $2,970
- Reserves months
- —
- Total cash needed
- —
Loan-product check · same deal, 3 products live
Conventional
25% down · 7.5% · 30yr
- Down + closing
- —
- Monthly P&I
- —
- Monthly cashflow
- —
- DSCR
- —
- Eligible?
- —
Personal DTI + credit; lowest rate.
DSCR
20% down · 8.5% · 30yr
- Down + closing
- —
- Monthly P&I
- —
- Monthly cashflow
- —
- DSCR
- —
- Eligible?
- —
No personal income docs; deal must DSCR.
Hard money
10% down · 12.0% · 12mo
- Down + closing
- —
- Monthly P&I
- —
- Monthly cashflow
- —
- DSCR
- —
- Eligible?
- —
Short-term bridge; refi at stabilization.
Rent comps 23 comps
| Address | Beds | Baths | Sqft | Rent | $/sqft | DOM | Units | Dist |
|---|---|---|---|---|---|---|---|---|
| 109 Mimosa St Weatherford, TX | 2.0 | 1.0 | 840 | $975 | $1.16 | 24d | 1 | 0.21mi |
| 1140 Jameson St Unit B Weatherford, TX | 2.0 | 2.0 | 1085 | $1,475 | $1.36 | 20d | 1 | 0.24mi |
| 610 E Water St Weatherford, TX | 3.0 | 2.0 | 1474 | $1,700 | $1.15 | 43d | 1 | 0.74mi |
| 510 E Akard St Unit 400 Weatherford, TX | 2.0 | 2.0 | 1200 | $1,499 | $1.25 | 5d | 1 | 0.81mi |
| 509 Eureka St Unit 100 Weatherford, TX | 2.0 | 2.0 | 1200 | $1,499 | $1.25 | 24d | 1 | 0.85mi |
| 314 Beaumont Dr Weatherford, TX | 3.0 | 2.0 | 1418 | $2,150 | $1.52 | 12d | 1 | 0.85mi |
| 806 Tremont St Weatherford, TX | 3.0 | 1.0 | 840 | $1,450 | $1.73 | 22d | 1 | 0.87mi |
| 936 Sylvia St Weatherford, TX | 3.0 | 2.0 | 1200 | $1,595 | $1.33 | 43d | 1 | 0.88mi |
| 936 Sylvia St Unit 936 Weatherford, TX | 3.0 | 2.0 | 1250 | $1,625 | $1.30 | 43d | 1 | 0.88mi |
| 206 E Columbia St Weatherford, TX | 2.0 | 2.0 | 1340 | $2,200 | $1.64 | 43d | 1 | 1.05mi |
| 202 E Oak St Weatherford, TX | 2.0 | 1.0 | 895 | $1,295 | $1.45 | 7d | 1 | 1.05mi |
| 202 E Oak St Apt 4 Weatherford, TX | 1.0 | 1.0 | 750 | $995 | $1.33 | 12d | 1 | 1.05mi |
| 710 N Rusk St Weatherford, TX | 3.0 | 2.0 | 1280 | $2,095 | $1.64 | 43d | 1 | 1.13mi |
| 1110 Curtis Dr Weatherford, TX | 2.0 | 1.5 | 1004 | $1,295 | $1.29 | 7d | 1 | 1.18mi |
| 1117 S Rusk St #1117 Weatherford, TX | 2.0 | 2.0 | 1285 | $1,700 | $1.32 | 24d | 1 | 1.19mi |
| 1117 S Rusk St Weatherford, TX | 2.0 | 2.0 | 1285 | $1,750 | $1.36 | 43d | 1 | 1.20mi |
| 1801 Fort Worth Hwy Weatherford, TX | 1.0–3.0 | 1.0–2.0 | 921 | $1,582 | $1.72 | 3d | 34 | 1.22mi |
| 1650 Holland Lake Dr Weatherford, TX | 1.0–2.0 | 1.0 | 748 | $1,449 | $1.94 | 1d | 8 | 1.29mi |
| 202 W Oak St Unit 4 Weatherford, TX | 1.0 | 1.0 | 750 | $995 | $1.33 | 43d | 1 | 1.31mi |
| 950 Austin Ct Unit 950 Weatherford, TX | 2.0 | 2.0 | 1147 | $2,300 | $2.01 | 15d | 1 | 1.31mi |
| 928 Austin Ct Unit 930 Weatherford, TX | 2.0 | 2.0 | 1000 | $1,850 | $1.85 | 2d | 1 | 1.32mi |
| 303 E 2nd St Weatherford, TX | 3.0 | 2.0 | 1291 | $1,595 | $1.24 | 43d | 1 | 1.37mi |
| 309 Tyler Ct Weatherford, TX | 3.0 | 2.0 | 1110 | $1,522 | $1.37 | 22d | 1 | 1.45mi |
Listing history 18 events
-
2026-06-18days on market $99,000 Active 248 DOM
-
2026-06-17days on market $99,000 Active 247 DOM
-
2026-06-16days on market $99,000 Active 246 DOM
-
2026-06-15days on market $99,000 Active 245 DOM
-
2026-06-13days on market $99,000 Active 243 DOM
-
2026-06-09days on market $99,000 Active 239 DOM
-
2026-06-08days on market $99,000 Active 238 DOM
-
2026-06-07days on market $99,000 Active 237 DOM
-
2026-06-04days on market $99,000 Active 234 DOM
-
2026-06-03days on market $99,000 Active 233 DOM
-
2026-06-02days on market $99,000 Active 232 DOM
-
2026-06-01days on market $99,000 Active 231 DOM
-
2026-05-31days on market $99,000 Active 230 DOM
-
2026-02-11price $99,000 797-char remark
Show marketing remark (797 chars)
So many possibilities for this property! Over a half acre next to the Millsap Middle School & administrative offices. Perfect place to build multi-family housing to supply housing for the teachers that are currently unable to afford to buy in town and that don't want to make the commute from outlying communities. Millsap has VERY few rental properties overall and this is a niche ready to be filled and taken advantage of. Value is in the land. Home could be salvaged but is in a state of disrepair. Must see property for all investors interested in the Millsap area. The Millsap School district is highly touted for their outstanding teachers and facilities. Minutes from Mineral Wells and 20 minutes from Weatherford make it a hot location. All OFFERS need submitted through FinalOffer.com
-
2025-11-13price $119,000 797-char remark
Show marketing remark (797 chars)
So many possibilities for this property! Over a half acre next to the Millsap Middle School & administrative offices. Perfect place to build multi-family housing to supply housing for the teachers that are currently unable to afford to buy in town and that don't want to make the commute from outlying communities. Millsap has VERY few rental properties overall and this is a niche ready to be filled and taken advantage of. Value is in the land. Home could be salvaged but is in a state of disrepair. Must see property for all investors interested in the Millsap area. The Millsap School district is highly touted for their outstanding teachers and facilities. Minutes from Mineral Wells and 20 minutes from Weatherford make it a hot location. All OFFERS need submitted through FinalOffer.com
-
2025-10-13$125,000 Active 797-char remark
Show marketing remark (797 chars)
So many possibilities for this property! Over a half acre next to the Millsap Middle School & administrative offices. Perfect place to build multi-family housing to supply housing for the teachers that are currently unable to afford to buy in town and that don't want to make the commute from outlying communities. Millsap has VERY few rental properties overall and this is a niche ready to be filled and taken advantage of. Value is in the land. Home could be salvaged but is in a state of disrepair. Must see property for all investors interested in the Millsap area. The Millsap School district is highly touted for their outstanding teachers and facilities. Minutes from Mineral Wells and 20 minutes from Weatherford make it a hot location. All OFFERS need submitted through FinalOffer.com
-
2015-10-01soldstatus
-
2001-11-20soldstatus
ⓘ Source: listings_history table (triggers on properties + properties_extension) + one-shot
backfill from property_details.listing_events for pre-trigger history.
Tax reassessment forecast TX · Resets to sale price
- Current annual tax
- $2,033 · $169/mo
- Projected year-2 tax
- $2,033 · $169/mo
- Expected delta
- $0/yr ($0/mo · 0.0%)
ⓘ Screening estimate from a state-policy table — verify with the county assessor before closing.
Climate risk First Street
- Flood 7/10 Severe FEMA zone X (unshaded) · 99% chance over 30 yrs
- Wildfire 6/10 Major
- Heat 7/10 Severe 7 d/yr ≥107°F today · 22 d/yr by 30 yrs out
- Wind 4/10 Moderate 19% chance of damaging wind over 30 yrs
- Air quality 2/10 Low 1 unhealthy d/yr today · 2 by 30 yrs out
Nearby sold comps map
Loading sold comps map…
Walkable amenities ~0.75 mi
Loading nearby amenities…
Taxation est. · year 1
- Rental income
- $18,092
- − Mortgage interest
- −$5,546
- − Property taxes
- −$2,033
- − Insurance
- −$1,292
- − Repairs & maintenance
- −$1,447
- − Management
- −$1,447
- − Depreciation
- −$2,880
- Taxable income
- $3,447
- Est. tax owed @ 24.0%
- −$827
- After-tax cash flow
- $3,910/yr
For passive investors: Depreciation is non-cash, so a rental often shows a tax loss while cash-flowing — sheltering income. Rental losses are passive: they offset passive income freely, and up to $25,000/yr can offset ordinary (W-2) income if you actively participate and your MAGI is under $100k (phasing out to $0 by $150k); unused losses carry forward. On sale, claimed depreciation is recaptured at up to 25%, and gains may owe capital-gains tax (a 1031 exchange can defer both). Figures are a year-1 estimate at your 24.0% rate — not tax advice; consult a CPA.
Schools (NCES district)
- District
- Weatherford ISD
- NCES district ID
- 4844800
- Math proficiency
- 39% ▼ -3.00%
- Reading proficiency
- 44% ▼ -2.00%
- Median HH income
- $57,087
- Composite
- 36.4/100
- National rank
- #4679
- State rank
- #321 of 826 in TX
Livability — Weatherford
- Score
- 71/100
- State rank
- #289
- US rank
- #6648
Category grades
Schools grade is shown separately in the Schools card above.
Census & demographics
- Census place
- Weatherford, TX
- City population
- 60,150
- Population (ZIP)
- 5,615
Population outlook (Parker County) Hauer SSP2
- Today (2025)
- 147,426 people
- By 2030
- 157,863 · +7.1%
- By 2040
- 177,519 · +20.4%
- By 2050
- 194,786 · +32.1%
- By 2075
- 238,799 · +62.0%
- By 2100
- 264,126 · +79.2%
Race, ethnicity, and origin ACS 2023
- Neighborhood character
- Predominantly White (79%)
- Race & ethnicity
- White 79% Two or more races 19% Hispanic / Latino 15%
- Hispanic origin (detail)
- Mexican 9%
- Common ancestry
- Italian 2% European 2% Scotch-Irish 1%
- Foreign-born
- 6% · Canada
- Languages at home
- 90% English-only · Spanish 10%
Political lean MEDSL · Parker
- 2024 margin
- Solid R (+66.4) · D 16.4% · R 82.8%
- 2008→2024 swing
- -11.2pp toward R · 2008: -55.2pp · 2024: -66.4pp
- All cycles
- 2024: R+66.4 2020: R+64.4 2016: R+67.5 2012: R+65.8 2008: R+55.2
Not yet ingested
- Civics
- —
Market trends
- HPI YoY
- ▼ -81.09%
- Current HPI
- 140.3208
- Rent YoY
- —
- Metro
- —
- State GDP YoY
- ▲ 3.95%
- F500 in state
- 110
Industry mix (Fortune 500 HQ in TX)
| Industry | F500 HQs | Revenue |
|---|---|---|
| Energy | 16 | $1,198B |
|
||
| Technology | 5 | $198B |
|
||
| Engineering / Construction | 4 | $72B |
|
||
| Energy Services | 3 | $60B |
|
||
| Utilities | 3 | $41B |
|
||
| Healthcare | 2 | $330B |
|
||
Price history
-20.8% since first listed5 events — show timeline
- 2026-02-11 Price Changed $99,000 NTREIS
- 2025-11-13 Price Changed $119,000 NTREIS
- 2025-10-13 Listed $125,000 NTREIS
- 2015-10-01 Sold (Public Records) — Public Records
- 2001-11-20 Sold (Public Records) — Public Records
Property tax history
+7.5%/yrLatest (2025): $2,033 · -18.8% YoY. Source: county tax records.
Cash-flow waterfall
monthlySold comps — $/sqft
last 12 mo · ≤1 miLoading sold comps…