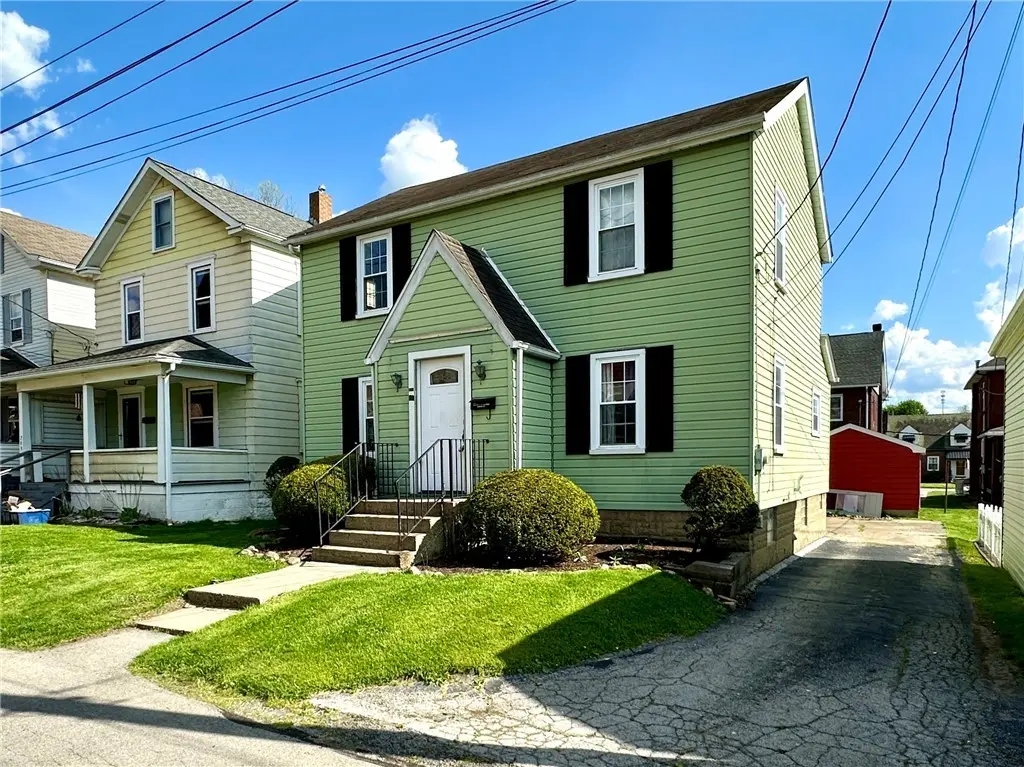
211 Hickory Way · Ellwood City, PA
Flood risk 1/10 · Minimal
- FEMA flood zone
- X (unshaded)
- Chance of flooding over 30 yrs
- 0.0%
- Est. flood insurance / yr
- $473 – $860
Fire risk 1/10 · Minimal
- Est. fire insurance / yr
- $511 – $949
Heat risk 3/10 · Minor
- Hot days now (above 97°F)
- 7 days/yr
- Hot days in 30 yrs
- 18 days/yr
Wind risk 1/10 · Minimal
- Chance of severe wind over 30 yrs
- 0.0%
Air-quality risk 3/10 · Minor
- Unhealthy air days now
- 2 days/yr
- Unhealthy air days in 30 yrs
- 3 days/yr
Risk factors via First Street. Map © Google.
Why this score? — see what drove the B+ grade
The composite is a weighted blend of 9 inputs, each scored 0–100. Each bar is that input's sub-score; the figure is the points it added to the 100-point composite (weight × sub-score).
- Cash flow +29.0/30.0
- ARV discount +15.0/15.0
- DSCR +10.0/10.0
- 1% rule +9.7/10.0
- Livability +3.6/5.0
- Schools +3.5/10.0
- Rent growth +2.5/5.0
- Condition / age +2.5/5.0
- Appreciation +0.0/10.0
$92,000
🖨 Deal sheet 📄 Offer letter ✓ Due diligence
Listing remarks
Located at 211 Hickory Way, nestled in the heart of Ellwood City, this property is ready for someone with a vision! This property requires just a little bit of cosmetic elbow grease to make a great home. 211 Hickory Way is all about convenience. Easy to maintain yard. Close to several parks. It is within walking distance of most of the restaurants and stores that Ellwood City has to offer. This home is of ample size and would make a great starter home. It is priced to sell, so hurry up and get on the schedule!
Key facts
- 2,962 sq ft lot
- Garage
- Built 1940
Tags
Property features AI
Exterior
- Parking: Detached garage; Off-street parking; Total parking for 2 vehicles
- Utilities: Public water; Public sewer
- Home design: Resale property
- Exterior features: Asphalt roof; Small lot (approximately 0.068 acres)
Interior
- Bathrooms: 2 full bathrooms; 1 half bathroom
- Heating & cooling: Gas heating; Central air conditioning
- Interior features: Unfinished interior-entry basement; Public transportation nearby
Neighborhood map
What this means for you Summary
Snapshot
- This is a 3-bed/1.5-bath single-family listed at $92k.
Deal economics
- At list price, monthly cash flow is $314 ($4k/yr) — positive.
- The deal already cash-flows at list — no discount required.
- Meets the 1% rule at list price ($1k rent vs $92k).
- Recommended offer: $89k (3.0% below list) — sets the bar for market timing.
- Cap rate 10.4% vs local median 5.3% in Ellwood City — top-decile yield for the area; either an underpriced asset or a hidden risk that comps aren't pricing in. Stress-test before assuming the spread holds.
Location & tenants
- Location reads 72/100 on livability (#610 in PA) — a middle-class / working-renter tenant base. Strengths: crime A+, cost of living A+, housing A+; Watch: health & safety C-, amenities F, commute F.
- Ellwood City Area SD (town): math 28% / reading 56% proficiency, ranked #334 of 539 in PA (top 62%) — families likely to look elsewhere, expect single-tenant / working-renter base with shorter leases.
- Market conditions: 53 active listings in the ZIP; 1 comparable units currently listed for rent nearby; 51 units permitted in Lawrence County in 2024 (0 in 5+ unit buildings).
Forward outlook
- Local home prices are declining (-3.0%/yr); year-one equity from $636 of loan paydown is wiped out by about $3k of value loss. Plan a longer hold.
- Lawrence County population projected at -25% by 2050 — secular population decline; favor cash flow + early exit over multi-decade hold.
- At projected returns (-3.0% appreciation + 3.0% rent growth), your $26k cash investment doubles in ~8 years — after that, you're playing with house money.
Negotiation context
- It's been on market 54 days — a 3% lower offer ($89k) is reasonable based on typical stale-listing flexibility.
- Current owner paid $74k; 25% above their basis — modest negotiation headroom, anchor on the comps not their cost.
Risks & watch-outs
- Watch-outs: property tax is 3.0% of price; built in 1940 — expect roof / HVAC / electrical / plumbing capex.
Questions for the listing agent
- It's been on market 54 days. Have you received any prior offers? Is the seller open to a 3% concession, seller financing, or rate buy-down credit?
- Built in 1940 — when were the roof, HVAC, electrical panel, plumbing, and water heater last replaced?
- Property tax is high relative to price — has the assessment been appealed recently, and will the sale trigger a re-assessment?
- Is there a deadline driving the sale (1031 exchange, divorce, estate, relocation)? That informs how much negotiation room exists.
- Schools are B-rated — typically a magnet for longer-tenancy family renters. What's the average tenant stay here, and is there a school-zone premium baked into asking?
- What's the average days-on-market for RENTAL listings here right now (not sales)? A rising rental-DOM trend means longer vacancies and softer asking-rent achievability than the comps imply.
- What's the recent tenant-quality profile in this submarket — average credit score on applications, eviction rate, late-payment / NSF rate, and stable-employment percentage? A property-management company in the area should have these aggregated.
- How much new for-sale + rental construction is in the pipeline within 1–3 miles? Heavy new supply typically softens prices + rents 12–24 months out; constrained supply supports both.
Investment metrics
- 1% rule
- 1.47% ✓
- Cap rate
- 10.39%
- Cash-on-cash
- 14.63%
- DSCR
- 1.65
- GRM
- 5.7
CMA / ARV
- ARV (median comp)
- $155,447
- List price
- $92,000
- Delta
- -40.82%
- Verdict
- UNDERPRICED
- Comps
- 20 within 1.0 mi
Show comp detail 12 sales within ~0.75 mi
| Address | Dist | Beds/Ba | Sqft | Sold | Price | $/sf | Match |
|---|---|---|---|---|---|---|---|
| 421 Wayne Ave | 0.38mi | 3/2.0 | 1,375 (-2%) | 1mo | $167,500 | $122 | 76 |
| 434 1st Ave | 0.48mi | 3/2.5 | 1,392 (-1%) | 3mo | $65,000 | $47 | 69 |
| 511 Bridge St | 0.62mi | 3/1.5 | 1,404 (-0%) | 2mo | $135,000 | $96 | 69 |
| 705 Park Ave | 0.48mi | 3/1.5 | 1,330 (-6%) | 1mo | $155,000 | $117 | 68 |
| 412 Orchard Ave | 0.66mi | 3/1.5 | 1,400 (-1%) | 3mo | $170,000 | $121 | 66 |
| 624 Line Ave | 0.63mi | 3/1.5 | 1,443 (+2%) | 3mo | $154,000 | $107 | 64 |
| 316 Line Ave | 0.51mi | 3/2.0 | 1,526 (+8%) | 3mo | $260,000 | $170 | 58 |
| 805 National Way | 0.45mi | 3/2.0 | 1,568 (+11%) | 2mo | $178,000 | $114 | 56 |
| 501 Summit Ave | 0.57mi | 3/2.0 | 1,555 (+10%) | 2mo | $174,900 | $112 | 52 |
| 209 Line Ave | 0.50mi | 3/1.5 | 1,206 (-14%) | 3mo | $180,000 | $149 | 50 |
| 212 Evans Dr | 0.67mi | 4/2.0 (+1) | 1,500 (+6%) | 2mo | $174,000 | $116 | 49 |
| 328 Line Ave | 0.51mi | 2/2.5 (-1) | 1,203 (-15%) | 2mo | $205,000 | $170 | 41 |
Match score weights: distance 35% · size 25% · config 20% · recency 20%. Top-matched comps best support the ARV.
Projected returns pro-forma
-3.0% appreciation · 3.0% rent growth · sell at horizon
- IRR
- 5.2%
- Equity multiple
- 1.20×
- Total profit
- $5,190
- Equity at exit
- $13,717
- IRR
- 14.7%
- Equity multiple
- 2.19×
- Total profit
- $30,654
- Equity at exit
- $7,954
Cash invested: $25,760 (down + closing). Projections, not guarantees.
Landlord ↔ Tenant lean methodology
- Overall (STATE)
- 62 Landlord-Friendly
- State Pennsylvania
- 62 Landlord-Friendly · EVEN
- County
- — inherits STATE
- City
- — inherits STATE
ZIP-level market 16117
- Home prices YoY
- -7.5%
- Active inventory
- 53
- Price-to-rent
- 5.7×
Monthly cashflow live
- Estimated rent
- $1,350 medium interval (Pro) →
- Mortgage (P&I)
- −$482
- Tax from tax record
- −$232 /mo · $2,779/yr
- Insurance
- −$38
- HOA
- −$0
- Vacancy / Maint / Mgmt
- −$284
- Net cashflow
- $314
Break-even live
UW: 25.0% down · 7.5% · 30yr · 1.5% tax · 5.0% vac · 8.0% maint · 8.0% mgmt
Financing live
Cash to close
- Down payment
- $23,000
- Closing costs
- $2,760
- Reserves months
- —
- Total cash needed
- —
Loan-product check · same deal, 3 products live
Conventional
25% down · 7.5% · 30yr
- Down + closing
- —
- Monthly P&I
- —
- Monthly cashflow
- —
- DSCR
- —
- Eligible?
- —
Personal DTI + credit; lowest rate.
DSCR
20% down · 8.5% · 30yr
- Down + closing
- —
- Monthly P&I
- —
- Monthly cashflow
- —
- DSCR
- —
- Eligible?
- —
No personal income docs; deal must DSCR.
Hard money
10% down · 12.0% · 12mo
- Down + closing
- —
- Monthly P&I
- —
- Monthly cashflow
- —
- DSCR
- —
- Eligible?
- —
Short-term bridge; refi at stabilization.
Rent comps 1 comps
| Address | Beds | Baths | Sqft | Rent | $/sqft | DOM | Units | Dist |
|---|---|---|---|---|---|---|---|---|
| 716 Hazel Ave Ellwood City, PA | 3.0 | 1.5 | 1037 | $1,350 | $1.30 | 3d | 1 | 0.73mi |
Listing history 18 events
-
2026-06-17days on market $92,000 Active 54 DOM
-
2026-06-16days on market $92,000 Active 53 DOM
-
2026-06-15days on market $92,000 Active 52 DOM
-
2026-06-14days on market $92,000 Active 50 DOM
-
2026-06-12days on market $92,000 Active 49 DOM
-
2026-06-09days on market $92,000 Active 46 DOM
-
2026-06-08days on market $92,000 Active 45 DOM
-
2026-06-07days on market $92,000 Active 44 DOM
-
2026-06-03days on market $92,000 Active 40 DOM
-
2026-06-02days on market $92,000 Active 39 DOM
-
2026-06-01days on market $92,000 Active 38 DOM
-
2026-05-31days on market $92,000 Active 37 DOM
-
2026-05-30days on market $92,000 Active 36 DOM
-
2026-05-14price $92,000 515-char remark
-
2026-04-24$99,000 Active 515-char remark
-
2007-06-22soldstatus $73,500
-
2007-06-22soldstatus $73,500
-
2005-06-07soldstatus $66,500
ⓘ Source: listings_history table (triggers on properties + properties_extension) + one-shot
backfill from property_details.listing_events for pre-trigger history.
Tax reassessment forecast PA · Partial reset (capped growth)
- Current annual tax
- $2,779 · $232/mo
- Projected year-2 tax
- $2,779 · $232/mo
- Expected delta
- $0/yr ($0/mo · 0.0%)
ⓘ Screening estimate from a state-policy table — verify with the county assessor before closing.
Climate risk First Street
- Flood 1/10 Low FEMA zone X (unshaded) · 0% chance over 30 yrs
- Wildfire 1/10 Low
- Heat 3/10 Moderate 7 d/yr ≥97°F today · 18 d/yr by 30 yrs out
- Wind 1/10 Low 0% chance of damaging wind over 30 yrs
- Air quality 3/10 Moderate 2 unhealthy d/yr today · 3 by 30 yrs out
Nearby sold comps map
Loading sold comps map…
Walkable amenities ~0.75 mi
Loading nearby amenities…
Taxation est. · year 1
- Rental income
- $16,200
- − Mortgage interest
- −$5,153
- − Property taxes
- −$2,779
- − Insurance
- −$460
- − Repairs & maintenance
- −$1,296
- − Management
- −$1,296
- − Depreciation
- −$2,676
- Taxable income
- $2,539
- Est. tax owed @ 24.0%
- −$609
- After-tax cash flow
- $3,160/yr
For passive investors: Depreciation is non-cash, so a rental often shows a tax loss while cash-flowing — sheltering income. Rental losses are passive: they offset passive income freely, and up to $25,000/yr can offset ordinary (W-2) income if you actively participate and your MAGI is under $100k (phasing out to $0 by $150k); unused losses carry forward. On sale, claimed depreciation is recaptured at up to 25%, and gains may owe capital-gains tax (a 1031 exchange can defer both). Figures are a year-1 estimate at your 24.0% rate — not tax advice; consult a CPA.
Schools (NCES district)
- District
- Ellwood City Area SD
- NCES district ID
- 4209240
- Math proficiency
- 28% ▼ -17.00%
- Reading proficiency
- 56% ▼ -14.00%
- Median HH income
- $44,230
- Composite
- 35.49/100
- National rank
- #4921
- State rank
- #334 of 539 in PA
Livability — Ellwood City
- Score
- 72/100
- State rank
- #610
- US rank
- #5866
Category grades
Schools grade is shown separately in the Schools card above.
Census & demographics
- Census place
- Ellwood City, PA
- Population (ZIP)
- 16,013
Population outlook (Lawrence County) Hauer SSP2
- Today (2025)
- 81,781 people
- By 2030
- 77,978 · -4.7%
- By 2040
- 69,522 · -15.0%
- By 2050
- 61,344 · -25.0%
- By 2075
- 45,027 · -44.9%
- By 2100
- 31,305 · -61.7%
Race, ethnicity, and origin ACS 2023
- Neighborhood character
- Predominantly White (95%)
- Race & ethnicity
- White 95% Two or more races 3% Hispanic / Latino 2%
- Common ancestry
- Romanian 6% Serbian 3% Lithuanian 2%
- Foreign-born
- 1%
- Languages at home
- 97% English-only · Spanish 2%
Political lean MEDSL · Lawrence
- 2024 margin
- Solid R (+33.8) · D 32.8% · R 66.5%
- 2008→2024 swing
- -28.7pp toward R · 2008: -5.1pp · 2024: -33.8pp
- All cycles
- 2024: R+33.8 2020: R+29.6 2016: R+28.1 2012: R+9.0 2008: R+5.1
Not yet ingested
- Civics
- —
Market trends
- HPI YoY
- ▼ -20.81%
- Current HPI
- 257.3336
- Rent YoY
- —
- Metro
- —
- State GDP YoY
- ▲ 1.68%
- F500 in state
- 34
Industry mix (Fortune 500 HQ in PA)
| Industry | F500 HQs | Revenue |
|---|---|---|
| Healthcare | 2 | $309B |
|
||
| Insurance | 2 | $27B |
|
||
| Telecommunications / Media | 1 | $124B |
|
||
| Industrial Distribution | 1 | $22B |
|
||
| Financial Services | 1 | $20B |
|
||
| Chemicals / Materials | 1 | $18B |
|
||
Price history
+38.3% since first listed5 events — show timeline
- 2026-05-14 Price Changed $92,000 West Penn MLS
- 2026-04-24 Listed $99,000 West Penn MLS
- 2007-06-22 Sold (Public Records) $73,500 Public Records
- 2007-06-22 Sold (Public Records) $73,500 Public Records
- 2005-06-07 Sold (Public Records) $66,500 Public Records
Property tax history
+2.2%/yrLatest (2026): $2,779 · +10.8% YoY. Source: county tax records.
Cash-flow waterfall
monthlySold comps — $/sqft
last 12 mo · ≤1 miLoading sold comps…