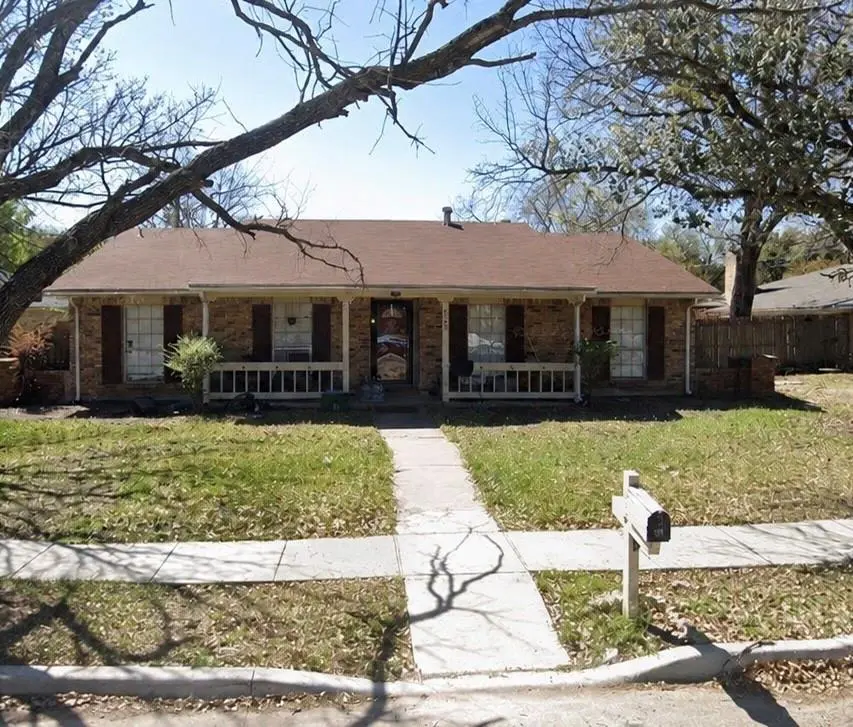
825 Pinoak Dr · Grand Prairie, TX
Flood risk 1/10 · Minimal
- FEMA flood zone
- X (unshaded)
- Chance of flooding over 30 yrs
- 0.0%
- Est. flood insurance / yr
- $507 – $1,088
Fire risk 1/10 · Minimal
- Est. fire insurance / yr
- $1,222 – $2,270
Heat risk 7/10 · Major
- Hot days now (above 110°F)
- 7 days/yr
- Hot days in 30 yrs
- 23 days/yr
Wind risk 6/10 · Moderate
- Chance of severe wind over 30 yrs
- 27.0%
Air-quality risk 3/10 · Minor
- Unhealthy air days now
- 2 days/yr
- Unhealthy air days in 30 yrs
- 4 days/yr
Risk factors via First Street. Map © Google.
Why this score? — see what drove the D grade
The composite is a weighted blend of 9 inputs, each scored 0–100. Each bar is that input's sub-score; the figure is the points it added to the 100-point composite (weight × sub-score).
- ARV discount +15.0/15.0
- Cash flow +10.6/30.0
- 1% rule +4.0/10.0
- Livability +4.0/5.0
- DSCR +3.1/10.0
- Schools +2.8/10.0
- Rent growth +2.5/5.0
- Condition / age +2.5/5.0
- Appreciation +0.0/10.0
$270,000
🖨 Deal sheet (PDF) 📄 Offer letter ✓ Due diligence
Listing remarks MLS
* * * Shiny Dime * * * Talk about open, uncluttered look! This beautiful home has had owner pride touches galore. Ceramic, laminate, except one bathroom- vinyl, granite, some replaced appliances, dream well lit kitchen, interior paint and decorator wall tile in guest bathroom. Bonus screened, windowed patio room brings the outdoors inside. Frig is negotiable. Don't miss out on this one! Model COVID-19 Certification For Property Access needed. It is found in the transaction documents in MLS. Foundation Structural Engineer's report has been ordered.
Key facts
- 8,494 sq ft lot
- 2 garage spots
- Built 1974
Property features AI
Finance
- Other: Property type: Residential single-family; Lot smaller than 0.5 acre
- HOA & community: No association
Exterior
- Parking: Attached garage with 2 covered spaces (approx. 20' x 20'); Driveway parking
- Utilities: City water; City sewer; Electricity connected; Individual gas meter; Individual water meter
- Home design: Single-family residence; One level
- Construction: Built in 1974; Brick construction; Composition roof; Slab foundation
- Exterior features: Covered patio/porch; Wood fence; Concrete and curbs; Sidewalk; Alley access
Interior
- Kitchen: Gas cooktop; Gas oven; Dishwasher; Garbage disposal; Refrigerator; Plumbed for gas in kitchen
- Bedrooms: Primary bedroom with ensuite bath (first level); Two additional bedrooms (first level)
- Flooring: Ceramic tile; Laminate
- Bathrooms: Two full bathrooms (both on first level, primary ensuite)
- Heating & cooling: Central heating; Electric heating; Fireplace(s) heating; Central air conditioning; Electric cooling; Ceiling fans
- Interior features: Vaulted ceilings; Eat-in kitchen; Pantry; Cable TV available; High-speed internet available; Chandelier
- Laundry & utility: Washer hookup; Laundry area in kitchen; Gas water heater
Neighborhood map
What this means for you Summary
Snapshot
- This is a 3-bed/2.0-bath single-family listed at $270k.
Deal economics
- At list price, monthly cash flow is $-134 ($-2k/yr) — negative.
- To cash-flow at today's rent, offer at most $246k (8.8% below list).
- To meet the 1% rule (rent ≥ 1% of price), the offer needs to be $244k (9.8% below list).
- Recommended offer: $244k (9.8% below list) — sets the bar for 1% rule.
- Cap rate 5.7% vs local median 3.7% in Grand Prairie — top-decile yield for the area; either an underpriced asset or a hidden risk that comps aren't pricing in. Stress-test before assuming the spread holds.
Location & tenants
- Location reads 80/100 on livability (#33 in TX, #1,660 nationally) — a professional / high-income tenant draw. Strengths: amenities A+, cost of living A+, housing A+; Watch: commute F.
- Grand Prairie ISD (suburban): math 29% / reading 35% proficiency, ranked #572 of 826 in TX (top 69%) — families likely to look elsewhere, expect single-tenant / working-renter base with shorter leases; 63% free/reduced lunch — lower-income household profile, screen leases tightly.
- Zoned schools: Thurgood Marshall Leadership Academy (math 35% / reading 41%, grade F, #1,709 of 4,322 statewide, top 40%, 629 students, 74% FRL).
- Market conditions: Rents flat; 290 active listings in the ZIP; 31 comparable units currently listed for rent nearby; rentals at typical pace (median 24d on market — plan ~3-4 weeks tenant-placement turnaround); 42% of comp listings sitting > 30 days — soft ceiling on asking rent; solid renter incomes; 12,577 units permitted in Dallas County in 2024 (6,829 in 5+ unit buildings).
- This rent runs 33% of the median local income ($89k/yr) — at the standard rent-burdened threshold; future hikes will face affordability resistance.
Forward outlook
- Local home prices are declining (-3.0%/yr); year-one equity from $2k of loan paydown is wiped out by about $8k of value loss. Plan a longer hold.
- Dallas County population projected at +35% by 2050 — long-run rental-demand tailwind backs the buy-and-hold thesis.
Negotiation context
- Only 2 days on market — expect competitive offers; lowballing is unlikely to land.
- 5 sale attempts since 6y ago with the ask held roughly flat each time — persistent listings suggest the price (not the market) is what's stuck; bring a comps-based counter.
Risks & watch-outs
- Climate carrying-cost: major wind risk, 27% chance of damaging wind over 30y; extreme-heat days projected 7→23/yr by 2055 (HVAC capex compounding) — expect insurance premiums to compound above CPI over the hold.
Questions for the listing agent
- What do current leases actually rent for vs. the listed asking? Can we see a recent rent roll and the last 12 months of T-12 income?
- Built in 1974 — when were the roof, HVAC, electrical panel, plumbing, and water heater last replaced?
- Is there a deadline driving the sale (1031 exchange, divorce, estate, relocation)? That informs how much negotiation room exists.
- The area grade is low — what's the realistic commute time and amenity access for the typical tenant pool here? Any planned neighborhood developments (good or bad) we should know about?
- What's the average days-on-market for RENTAL listings here right now (not sales)? A rising rental-DOM trend means longer vacancies and softer asking-rent achievability than the comps imply.
- What's the recent tenant-quality profile in this submarket — average credit score on applications, eviction rate, late-payment / NSF rate, and stable-employment percentage? A property-management company in the area should have these aggregated.
- How much new for-sale + rental construction is in the pipeline within 1–3 miles? Heavy new supply typically softens prices + rents 12–24 months out; constrained supply supports both.
Investment metrics
- 1% rule
- 0.90% ✗
- Cap rate
- 5.70%
- Cash-on-cash
- -2.13%
- DSCR
- 0.91
- GRM
- 9.2
CMA / ARV
- ARV (on-the-fly)
- $342,183
- Comps found
- 12
Show comp detail 12 sales within ~0.75 mi
| Address | Dist | Beds/Ba | Sqft | Sold | Price | $/sf | Match |
|---|---|---|---|---|---|---|---|
| 806 Pinehill Ln | 0.07mi | 3/2.0 | 1,951 (-5%) | 2mo | $239,900 | $123 | 87 |
| 509 Royal Valley Rd | 0.50mi | 3/2.0 | 2,089 (+2%) | 2mo | $405,000 | $194 | 72 |
| 829 Brentwood Dr | 0.24mi | 3/2.5 | 1,859 (-9%) | 0mo | $345,000 | $186 | 71 |
| 750 Greenhill Ln | 0.21mi | 4/2.0 (+1) | 1,860 (-9%) | 2mo | $310,000 | $167 | 68 |
| 834 Brian Dr | 0.21mi | 3/2.5 | 1,796 (-12%) | 0mo | $278,000 | $155 | 67 |
| 706 Greenhill Ln | 0.31mi | 3/2.0 | 1,815 (-11%) | 5mo | $310,000 | $171 | 62 |
| 535 W Crossland Blvd | 0.50mi | 3/2.5 | 1,887 (-8%) | 5mo | $375,000 | $199 | 58 |
| 3717 Corn Valley Rd | 0.43mi | 4/2.0 (+1) | 1,852 (-10%) | 4mo | $309,990 | $167 | 55 |
| 402 Chestnut Dr | 0.75mi | 4/2.0 (+1) | 2,144 (+5%) | 1mo | $334,900 | $156 | 52 |
| 501 Beatty Dr | 0.57mi | 3/2.0 | 1,826 (-11%) | 5mo | $299,900 | $164 | 51 |
| 2024 Brazos Ct | 0.71mi | 3/2.5 | 2,209 (+8%) | 3mo | $345,000 | $156 | 50 |
| 709 Raywood Dr | 0.59mi | 4/2.0 (+1) | 1,821 (-11%) | 0mo | $295,000 | $162 | 49 |
Match score weights: distance 35% · size 25% · config 20% · recency 20%. Top-matched comps best support the ARV.
Projected returns pro-forma
-3.0% appreciation · 0.08% rent growth · sell at horizon
- IRR
- -23.5%
- Equity multiple
- 0.22×
- Total profit
- $-59,092
- Equity at exit
- $40,258
- IRR
- -30.5%
- Equity multiple
- -0.17×
- Total profit
- $-88,744
- Equity at exit
- $23,345
Cash invested: $75,600 (down + closing). Projections, not guarantees.
Landlord ↔ Tenant lean methodology
- Overall (STATE)
- 87 Strongly Landlord-Friendly
- State Texas
- 87 Strongly Landlord-Friendly · R+5
- County
- — inherits STATE
- City
- — inherits STATE
ZIP-level market 75052
- Home prices YoY
- -26.3%
- Rents YoY
- 0.1%
- Active inventory
- 290
- Price-to-rent
- 9.2×
Monthly cashflow live
- Estimated rent
- $2,436 high interval (Pro) →
- Mortgage (P&I)
- −$1,416
- Tax from tax record
- −$530 /mo · $6,364/yr
- Insurance
- −$112
- HOA
- −$0
- Vacancy / Maint / Mgmt
- −$512
- Net cashflow
- $-134
Break-even live
Sensitivity live
| Price | -10% $19 | -5% $-58 | +0% $-134 | +5% $-211 | +10% $-287 |
|---|---|---|---|---|---|
| Rent | -10% $-327 | -5% $-230 | +0% $-134 | +5% $-38 | +10% $58 |
| Rate | -1.0pp $2 | -0.5pp $-65 | base $-134 | +0.5pp $-204 | +1.0pp $-275 |
UW: 25.0% down · 7.5% · 30yr · 1.5% tax · 5.0% vac · 8.0% maint · 8.0% mgmt
Financing live
Cash to close
- Down payment
- $67,500
- Closing costs
- $8,100
- Reserves months
- —
- Total cash needed
- —
Loan-product check · same deal, 3 products live
Conventional
25% down · 7.5% · 30yr
- Down + closing
- —
- Monthly P&I
- —
- Monthly cashflow
- —
- DSCR
- —
- Eligible?
- —
Personal DTI + credit; lowest rate.
DSCR
20% down · 8.5% · 30yr
- Down + closing
- —
- Monthly P&I
- —
- Monthly cashflow
- —
- DSCR
- —
- Eligible?
- —
No personal income docs; deal must DSCR.
Hard money
10% down · 12.0% · 12mo
- Down + closing
- —
- Monthly P&I
- —
- Monthly cashflow
- —
- DSCR
- —
- Eligible?
- —
Short-term bridge; refi at stabilization.
Rent comps 31 comps
| Address | Beds | Baths | Sqft | Rent | $/sqft | DOM | Units | Dist |
|---|---|---|---|---|---|---|---|---|
| 854 Timberdale St Grand Prairie, TX | 3.0 | 2.0 | 1612 | $2,200 | $1.36 | 45d | 1 | 0.14mi |
| 3550 S Robinson Rd Grand Prairie, TX | 1.0–2.0 | 1.0–2.0 | 1057 | $2,490 | $2.36 | 0d | 14 | 0.18mi |
| 3401 Glenda Dr Grand Prairie, TX | 3.0 | 2.0 | 1554 | $2,206 | $1.42 | 45d | 1 | 0.25mi |
| 614 Brian Dr Grand Prairie, TX | 3.0 | 2.0 | 1469 | $2,130 | $1.45 | 0d | 1 | 0.36mi |
| 1661 S Forum Dr Grand Prairie, TX | 3.0 | 1.0–3.0 | 1061 | $2,515 | $2.37 | 0d | 25 | 0.38mi |
| 819 Over Ridge Dr Grand Prairie, TX | 4.0 | 2.5 | 2046 | $2,500 | $1.22 | 22d | 1 | 0.39mi |
| 3802 State Highway 161 Unit 2064 Grand Prairie, TX | 2.0 | 2.0 | 1758 | $1,785 | $1.02 | 45d | 1 | 0.44mi |
| 618 Thornwood Trl Grand Prairie, TX | 4.0 | 2.0 | 1803 | $2,600 | $1.44 | 0d | 1 | 0.46mi |
| 3914 Willowood Ln Grand Prairie, TX | 3.0 | 2.0 | 1963 | $2,519 | $1.28 | 9d | 1 | 0.59mi |
| 3740 Pierce Ln Grand Prairie, TX | 4.0 | 3.5 | 2100 | $3,300 | $1.57 | 45d | 1 | 0.59mi |
| 3705 Pierce Ln Grand Prairie, TX | 3.0 | 2.5 | 1819 | $3,000 | $1.65 | 26d | 1 | 0.61mi |
| 3765 Pierce Ln Grand Prairie, TX | 3.0 | 2.5 | 1822 | $3,100 | $1.70 | 0d | 1 | 0.63mi |
| 2136 Sara Jane Pkwy Grand Prairie, TX | 3.0 | 1.0–2.0 | 985 | $2,999 | $3.04 | 0d | 17 | 0.87mi |
| 3316 Sir Stewart Cir Grand Prairie, TX | 4.0 | 4.0 | 2420 | $3,000 | $1.24 | 45d | 1 | 0.91mi |
| 2136 Dayton Ln Unit 1019626P Grand Prairie, TX | 4.0 | 2.5 | 2303 | $12,424 | $5.39 | 24d | 1 | 0.92mi |
| 2136 Dayton Ln Grand Prairie, TX | 4.0 | 2.5 | 2313 | $7,900 | $3.42 | 0d | 1 | 0.92mi |
| 418 David Dr Grand Prairie, TX | 3.0 | 2.0 | 1437 | $2,029 | $1.41 | 18d | 1 | 0.96mi |
| 608 Laura Ln Grand Prairie, TX | 4.0 | 3.0 | 2806 | $3,100 | $1.10 | 0d | 1 | 1.12mi |
| 4255 Fall Creek Dr Grand Prairie, TX | 3.0 | 2.0 | 2264 | $2,600 | $1.15 | 45d | 1 | 1.13mi |
| 860 Roaring Springs Rd Grand Prairie, TX | 3.0 | 2.5 | 2857 | $2,716 | $0.95 | 26d | 1 | 1.14mi |
| 2410 Lost Mesa Grand Prairie, TX | 4.0 | 2.0 | 2220 | $2,900 | $1.31 | 45d | 1 | 1.23mi |
| 2823 Brookhurst Dr Grand Prairie, TX | 4.0 | 2.0 | 1839 | $2,900 | $1.58 | 16d | 1 | 1.33mi |
| 738 Hawthorne Ln Grand Prairie, TX | 3.0 | 2.0 | 1736 | $2,325 | $1.34 | 9d | 1 | 1.35mi |
| 2468 Ranchview Dr Grand Prairie, TX | 3.0 | 2.0 | 2200 | $3,000 | $1.36 | 45d | 1 | 1.36mi |
| 3951 Dechman Dr Grand Prairie, TX | 1.0–3.0 | 1.0–2.0 | 1130 | $2,514 | $2.22 | 45d | 11 | 1.37mi |
| 2361 Shirecreek Cir Grand Prairie, TX | 4.0 | 2.5 | 2588 | $2,675 | $1.03 | 45d | 1 | 1.37mi |
| 615 Delores Dr Grand Prairie, TX | 4.0 | 3.0 | 2432 | $3,000 | $1.23 | 45d | 1 | 1.38mi |
| 3930 Westcliff Rd Unit 1228618P Grand Prairie, TX | 1.0–2.0 | 1.0–2.0 | 6861 | $5,024 | $0.73 | 3d | 2 | 1.43mi |
| 2504 Frontier Dr Grand Prairie, TX | 4.0 | 2.5 | 2541 | $2,820 | $1.11 | 45d | 1 | 1.43mi |
| 340 Clayton St Grand Prairie, TX | 3.0 | 2.5 | 1943 | $2,300 | $1.18 | 45d | 1 | 1.48mi |
| 729 Cranbrook Ln Grand Prairie, TX | 4.0 | 2.0 | 1600 | $2,175 | $1.36 | 13d | 1 | 1.48mi |
Listing history 2 events
-
2026-06-21remarks 699-char remark
-
2026-06-21$270,000 Active 2 DOM
ⓘ Source: listings_history table (triggers on properties + properties_extension) + one-shot
backfill from property_details.listing_events for pre-trigger history.
Tax reassessment forecast TX · Resets to sale price
- Current annual tax
- $6,364 · $530/mo
- Projected year-2 tax
- $6,364 · $530/mo
- Expected delta
- $0/yr ($0/mo · 0.0%)
ⓘ Screening estimate from a state-policy table — verify with the county assessor before closing.
Climate risk First Street
- Flood 1/10 Low FEMA zone X (unshaded) · 0% chance over 30 yrs
- Wildfire 1/10 Low
- Heat 7/10 Severe 7 d/yr ≥110°F today · 23 d/yr by 30 yrs out
- Wind 6/10 Major 27% chance of damaging wind over 30 yrs
- Air quality 3/10 Moderate 2 unhealthy d/yr today · 4 by 30 yrs out
Nearby sold comps map
Loading sold comps map…
Walkable amenities ~0.75 mi
Loading nearby amenities…
Taxation est. · year 1
- Rental income
- $29,235
- − Mortgage interest
- −$15,124
- − Property taxes
- −$6,364
- − Insurance
- −$1,350
- − Repairs & maintenance
- −$2,339
- − Management
- −$2,339
- − Depreciation
- −$7,855
- Taxable loss
- −$6,135
- Est. tax savings @ 24.0%
- +$1,472
- After-tax cash flow
- $-137/yr
For passive investors: Depreciation is non-cash, so a rental often shows a tax loss while cash-flowing — sheltering income. Rental losses are passive: they offset passive income freely, and up to $25,000/yr can offset ordinary (W-2) income if you actively participate and your MAGI is under $100k (phasing out to $0 by $150k); unused losses carry forward. On sale, claimed depreciation is recaptured at up to 25%, and gains may owe capital-gains tax (a 1031 exchange can defer both). Figures are a year-1 estimate at your 24.0% rate — not tax advice; consult a CPA.
Schools (NCES district)
- District
- Grand Prairie ISD
- NCES district ID
- 4821420
- Math proficiency
- 29% ▼ -21.00%
- Reading proficiency
- 35% ▼ -8.00%
- Median HH income
- $51,094
- Composite
- 27.95/100
- National rank
- #6861
- State rank
- #572 of 826 in TX
Livability — Grand Prairie
- Score
- 80/100
- State rank
- #33
- US rank
- #1660
Category grades
Schools grade is shown separately in the Schools card above.
Census & demographics
- Census place
- Grand Prairie, TX
- County
- Dallas County · 2,612,404 people
- City population
- 201,439
- Metro
- Dallas-Fort Worth-Arlington, TX
- Population (ZIP)
- 97,278
- Household income
- $89,301
- Rent vs Own
- Severe rent burden
- 3118.0
Population outlook (Dallas County) Hauer SSP2
- Today (2025)
- 2,979,839 people
- By 2030
- 3,191,823 · +7.1%
- By 2040
- 3,619,611 · +21.5%
- By 2050
- 4,026,915 · +35.1%
- By 2075
- 4,957,073 · +66.4%
- By 2100
- 5,508,725 · +84.9%
Race, ethnicity, and origin ACS 2023
- Neighborhood character
- Highly diverse neighborhood (Simpson 0.71)
- Race & ethnicity
- Hispanic / Latino 39% Black 29% White 19% Two or more races 16% Asian 9%
- Hispanic origin (detail)
- Mexican 31% Puerto Rican 1%
- Common ancestry
- Slovak 1% Lithuanian 1% Italian 1%
- Foreign-born
- 21% · Canada, Vietnam, China
- Languages at home
- 62% English-only · Spanish 27% Vietnamese 4% Chinese 1%
Political lean MEDSL · Dallas
- 2024 margin
- Strong D (+22.2) · D 60.2% · R 38.0% · Other 1.8%
- 2008→2024 swing
- +6.9pp toward D · 2008: 15.3pp · 2024: 22.2pp
- All cycles
- 2024: D+22.2 2020: D+31.6 2016: D+26.2 2012: D+15.4 2008: D+15.3
Not yet ingested
- Civics
- —
Market trends
- HPI YoY
- ▼ -103.08%
- Current HPI
- 289.3711
- Rent YoY
- ▲ 0.08%
- Metro
- Dallas-Fort Worth-Arlington, TX
- State GDP YoY
- ▲ 3.95%
- F500 in state
- 110
Industry mix (Fortune 500 HQ in TX)
| Industry | F500 HQs | Revenue |
|---|---|---|
| Energy | 16 | $1,198B |
|
||
| Technology | 5 | $198B |
|
||
| Engineering / Construction | 4 | $72B |
|
||
| Energy Services | 3 | $60B |
|
||
| Utilities | 3 | $41B |
|
||
| Healthcare | 2 | $330B |
|
||
Price history
+17.6% since first listed13 events — show timeline
- 2026-06-19 Listed $270,000 NTREIS
- 2020-10-26 Sold (MLS) — NTREIS
- 2020-10-20 Sold (Public Records) — Public Records
- 2020-09-29 Pending — NTREIS
- 2020-09-20 Contingent — NTREIS
- 2020-09-13 Relisted — NTREIS
- 2020-09-06 Contingent — NTREIS
- 2020-08-29 Relisted — NTREIS
- 2020-08-27 Contingent — NTREIS
- 2020-08-26 Relisted — NTREIS
- 2020-08-21 Contingent — NTREIS
- 2020-07-23 Listed $229,500 NTREIS
- 1992-04-29 Sold (Public Records) — Public Records
Property tax history
+6.0%/yrLatest (2025): $6,364 · +1.2% YoY. Source: county tax records.
Cash-flow waterfall
monthlySold comps — $/sqft
last 12 mo · ≤1 miLoading sold comps…