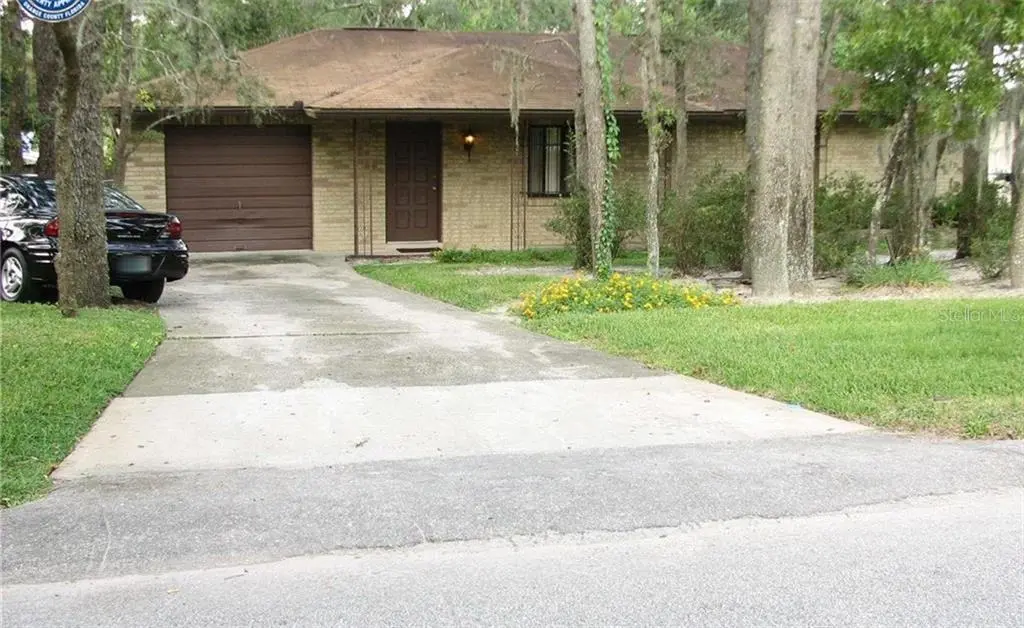
1108 N Hart Blvd · Pine Hills, FL
Flood risk 1/10 · Minimal
- FEMA flood zone
- X (unshaded)
- Chance of flooding over 30 yrs
- 0.0%
- Est. flood insurance / yr
- $507 – $1,088
Fire risk 1/10 · Minimal
- Est. fire insurance / yr
- $947 – $1,759
Heat risk 9/10 · Severe
- Hot days now (above 108°F)
- 7 days/yr
- Hot days in 30 yrs
- 23 days/yr
Wind risk 9/10 · Severe
- Chance of severe wind over 30 yrs
- 99.0%
Air-quality risk 1/10 · Minimal
- Unhealthy air days now
- 0 days/yr
- Unhealthy air days in 30 yrs
- 0 days/yr
Risk factors via First Street. Map © Google.
Why this score? — see what drove the B- grade
The composite is a weighted blend of 9 inputs, each scored 0–100. Each bar is that input's sub-score; the figure is the points it added to the 100-point composite (weight × sub-score).
- Cash flow +26.8/30.0
- ARV discount +15.0/15.0
- DSCR +9.2/10.0
- 1% rule +6.2/10.0
- Schools +4.1/10.0
- Livability +3.7/5.0
- Condition / age +2.5/5.0
- Rent growth +1.8/5.0
- Appreciation +0.0/10.0
$175,000
🖨 Deal sheet 📄 Offer letter ✓ Due diligence
Listing remarks MLS
LOVELY TWO BED/TWO BATH HOME WITH BONUS ROOM. PERFECT FOR FIRST TIME BUYERS. SPACIOUS LIVING ROOM/GREAT ROOM, EAT-IN KITCHEN, SCREENED PORCH, LARGE BACKYARD WITH SHED, BONUS ROOM CAN BE USED AS OFFICE OR 3RD BEDROOM. INSIDE UTILITY. CLOSE TO SHOPPING, RESTAURANTS, I-4 AND MUCH MORE. THIS IS A GREAT STARTER HOME, COME SEE INSIDE!
Key facts
- 0.23 acre lot
- Built 1980
Neighborhood map
What this means for you Summary
Snapshot
- This is a 2-bed/2.0-bath single-family listed at $175k.
Deal economics
- At list price, monthly cash flow is $481 ($6k/yr) — positive.
- The deal already cash-flows at list — no discount required.
- Meets the 1% rule at list price ($2k rent vs $175k).
- Cap rate 9.6% vs local median 4.9% in Pine Hills — top-decile yield for the area; either an underpriced asset or a hidden risk that comps aren't pricing in. Stress-test before assuming the spread holds.
Location & tenants
- Location reads 73/100 on livability (#317 in FL) — a middle-class / working-renter tenant base. Strengths: commute A+, cost of living A+, housing A+; Watch: crime D+, employment D, amenities F.
- Orange (suburban): math 46% / reading 51% proficiency, ranked #43 of 73 in FL (top 59%) — families likely to look elsewhere, expect single-tenant / working-renter base with shorter leases.
- Market conditions: Rents soft (-2.7%/yr); 178 active listings in the ZIP; 31 comparable units currently listed for rent nearby; rentals at typical pace (median 22d on market — plan ~3-4 weeks tenant-placement turnaround); 8,053 units permitted in Orange County in 2024 (3,133 in 5+ unit buildings).
- This rent runs 37% of the median local income ($63k/yr) — at the standard rent-burdened threshold; future hikes will face affordability resistance.
Forward outlook
- Local home prices are declining (-3.0%/yr); year-one equity from $1k of loan paydown is wiped out by about $5k of value loss. Plan a longer hold.
- Orange County population projected at +52% by 2050 — long-run rental-demand tailwind backs the buy-and-hold thesis.
Negotiation context
- Only 1 days on market — expect competitive offers; lowballing is unlikely to land.
- 3 sale attempts since 19y ago with the ask held roughly flat each time — persistent listings suggest the price (not the market) is what's stuck; bring a comps-based counter.
Risks & watch-outs
- Climate carrying-cost: severe wind risk, 99% chance of damaging wind over 30y; extreme-heat days projected 7→23/yr by 2055 (HVAC capex compounding) — expect insurance premiums to compound above CPI over the hold.
Questions for the listing agent
- Is there a deadline driving the sale (1031 exchange, divorce, estate, relocation)? That informs how much negotiation room exists.
- Schools are B-rated — typically a magnet for longer-tenancy family renters. What's the average tenant stay here, and is there a school-zone premium baked into asking?
- Crime grade is D in this area — have there been break-ins, vandalism, or insurance claims at this property in the last 3 years? What carrier currently insures it and at what premium?
- What's the average days-on-market for RENTAL listings here right now (not sales)? A rising rental-DOM trend means longer vacancies and softer asking-rent achievability than the comps imply.
- What's the recent tenant-quality profile in this submarket — average credit score on applications, eviction rate, late-payment / NSF rate, and stable-employment percentage? A property-management company in the area should have these aggregated.
- How much new for-sale + rental construction is in the pipeline within 1–3 miles? Heavy new supply typically softens prices + rents 12–24 months out; constrained supply supports both.
Investment metrics
- 1% rule
- 1.12% ✓
- Cap rate
- 9.59%
- Cash-on-cash
- 11.78%
- DSCR
- 1.52
- GRM
- 7.5
CMA / ARV
- ARV (on-the-fly)
- $278,200
- Comps found
- 4
Show comp detail 4 sales within ~0.75 mi
| Address | Dist | Beds/Ba | Sqft | Sold | Price | $/sf | Match |
|---|---|---|---|---|---|---|---|
| 6206 N Hudson St | 0.55mi | 3/2.0 (+1) | 1,308 (+1%) | 8mo | $280,000 | $214 | 62 |
| 6154 Balboa Dr | 0.40mi | 3/1.5 (+1) | 1,206 (-7%) | 9mo | $215,250 | $178 | 55 |
| 424 N Powers Dr | 0.59mi | 3/1.0 (+1) | 1,185 (-9%) | 14mo | $252,000 | $213 | 37 |
| 1182 Lake Blanche Dr | 0.59mi | 3/2.0 (+1) | 1,409 (+8%) | 22mo | $320,000 | $227 | 35 |
Match score weights: distance 35% · size 25% · config 20% · recency 20%. Top-matched comps best support the ARV.
Projected returns pro-forma
-3.0% appreciation · 0.0% rent growth · sell at horizon
- IRR
- -2.0%
- Equity multiple
- 0.93×
- Total profit
- $-3,523
- Equity at exit
- $26,093
- IRR
- 4.5%
- Equity multiple
- 1.29×
- Total profit
- $13,980
- Equity at exit
- $15,131
Cash invested: $49,000 (down + closing). Projections, not guarantees.
Landlord ↔ Tenant lean methodology
- Overall (STATE)
- 87 Strongly Landlord-Friendly
- State Florida
- 87 Strongly Landlord-Friendly · R+3
- County
- — inherits STATE
- City
- — inherits STATE
ZIP-level market 32818
- Home prices YoY
- -22.5%
- Rents YoY
- -2.7%
- Active inventory
- 178
- Price-to-rent
- 7.5×
Monthly cashflow live
- Estimated rent
- $1,955 high interval (Pro) →
- Mortgage (P&I)
- −$918
- Tax from tax record
- −$73 /mo · $875/yr
- Insurance
- −$73
- HOA
- −$0
- Vacancy / Maint / Mgmt
- −$411
- Net cashflow
- $481
Break-even live
UW: 25.0% down · 7.5% · 30yr · 1.5% tax · 5.0% vac · 8.0% maint · 8.0% mgmt
Financing live
Cash to close
- Down payment
- $43,750
- Closing costs
- $5,250
- Reserves months
- —
- Total cash needed
- —
Loan-product check · same deal, 3 products live
Conventional
25% down · 7.5% · 30yr
- Down + closing
- —
- Monthly P&I
- —
- Monthly cashflow
- —
- DSCR
- —
- Eligible?
- —
Personal DTI + credit; lowest rate.
DSCR
20% down · 8.5% · 30yr
- Down + closing
- —
- Monthly P&I
- —
- Monthly cashflow
- —
- DSCR
- —
- Eligible?
- —
No personal income docs; deal must DSCR.
Hard money
10% down · 12.0% · 12mo
- Down + closing
- —
- Monthly P&I
- —
- Monthly cashflow
- —
- DSCR
- —
- Eligible?
- —
Short-term bridge; refi at stabilization.
Rent comps 31 comps
| Address | Beds | Baths | Sqft | Rent | $/sqft | DOM | Units | Dist |
|---|---|---|---|---|---|---|---|---|
| 1303 Charles St Orlando, FL | 3.0 | 2.0 | 1780 | $2,200 | $1.24 | 22d | 1 | 0.31mi |
| 6033 Balboa Dr Orlando, FL | 3.0 | 2.0 | 1269 | $2,300 | $1.81 | 22d | 1 | 0.52mi |
| 812 N Hudson St Pine Hills, FL | 2.0 | 2.0 | 950 | $1,600 | $1.68 | 24d | 1 | 0.59mi |
| 7097 Balboa Dr #7097 Orlando, FL | 2.0 | 1.0 | 1042 | $1,500 | $1.44 | 24d | 1 | 0.62mi |
| 6215 Melbourne Ave Orlando, FL | 3.0 | 2.0 | 1250 | $850 | $0.68 | 18d | 1 | 0.70mi |
| 6119 Melbourne Ave Orlando, FL | 3.0 | 2.0 | 1109 | $1,999 | $1.80 | 20d | 1 | 0.72mi |
| 7108 Steffie Ln Orlando, FL | 3.0 | 2.0 | 1501 | $2,277 | $1.52 | 22d | 1 | 0.72mi |
| 137 N Nowell St Orlando, FL | 3.0 | 1.5 | 1167 | $2,300 | $1.97 | 18d | 1 | 0.94mi |
| 222 N Hiawassee Rd Orlando, FL | 2.0 | 1.0–2.5 | 875 | $1,514 | $1.73 | 10d | 9 | 0.96mi |
| 7222 Nima Ct Orlando, FL | 3.0 | 2.5 | 1449 | $2,400 | $1.66 | 15d | 1 | 0.99mi |
| 7320 Balboa Dr #7320 Orlando, FL | 2.0 | 1.0 | 1000 | $1,600 | $1.60 | 24d | 1 | 1.01mi |
| 245 Alston Dr Orlando, FL | 3.0 | 2.5 | 1385 | $2,300 | $1.66 | 4d | 1 | 1.03mi |
| 7364 Balboa Dr #7364 Orlando, FL | 2.0 | 1.0 | 971 | $1,500 | $1.54 | 24d | 1 | 1.06mi |
| 1020 barnett villas Dr Orlando, FL | 1.0–3.0 | 1.0–2.0 | 934 | $1,439 | $1.54 | 24d | 1 | 1.06mi |
| 7376 Balboa Dr #7376 Orlando, FL | 2.0 | 1.0 | 971 | $1,500 | $1.54 | 24d | 1 | 1.07mi |
| 7350 Oak Meadows Cir Orlando, FL | 2.0 | 2.0 | 1012 | $2,350 | $2.32 | 24d | 1 | 1.20mi |
| 6872 Alta Westgate Dr Orlando, FL | 2.0–3.0 | 2.0 | 1190 | $1,466 | $1.23 | 7d | 1 | 1.25mi |
| 7102 Harbor Heights Cir Orlando, FL | 3.0 | 2.0 | 1192 | $2,400 | $2.01 | 24d | 1 | 1.30mi |
| 1529 Ridge Pointe Dr Orlando, FL | 3.0 | 2.0 | 1108 | $1,995 | $1.80 | 7d | 1 | 1.30mi |
| 1537 Ridge Pointe Dr Orlando, FL | 3.0 | 2.0 | 1108 | $2,200 | $1.99 | 24d | 1 | 1.32mi |
| 2429 Sandy Ln Orlando, FL | 3.0 | 2.0 | 1418 | $2,490 | $1.76 | 22d | 1 | 1.36mi |
| 414 Sandpiper Ridge Dr Orlando, FL | 3.0 | 2.0 | 1620 | $2,500 | $1.54 | 18d | 1 | 1.40mi |
| 8008 Balasands Blvd Orlando, FL | 1.0–3.0 | 1.0–2.0 | 1091 | $1,870 | $1.71 | 1d | 11 | 1.40mi |
| 4918 Cortez Dr Orlando, FL | 1.0 | 1.0 | 1511 | $788 | $0.52 | 24d | 1 | 1.40mi |
| 325 Crabtree Ave Orlando, FL | 3.0 | 2.0 | 1749 | $2,106 | $1.20 | 22d | 1 | 1.41mi |
| 403 Crabtree Ave Orlando, FL | 3.0 | 2.0 | 1105 | $2,095 | $1.90 | 24d | 1 | 1.42mi |
| 219 Ashbourne Dr Orlando, FL | 3.0 | 2.0 | 1080 | $2,205 | $2.04 | 7d | 1 | 1.43mi |
| 1109 Woodman Way Orlando, FL | 3.0 | 2.0 | 1124 | $1,750 | $1.56 | 22d | 1 | 1.43mi |
| 1275 Woodman Way Orlando, FL | 2.0 | 2.0 | 891 | $1,450 | $1.63 | 7d | 1 | 1.46mi |
| 4919 Erleen Pl Orlando, FL | 1.0 | 1.0 | 965 | $800 | $0.83 | 24d | 1 | 1.47mi |
| 1300 Woodman Way Orlando, FL | 2.0 | 2.0 | 1240 | $2,300 | $1.85 | 24d | 1 | 1.50mi |
Listing history 8 events
-
2021-04-01status Pending
-
2019-07-25status Pending
-
2019-07-25$175,000 Active
-
2008-01-16soldstatus $162,000
-
2007-12-28soldstatus $162,000 330-char remark
Show marketing remark (330 chars)
LOVELY TWO BED/TWO BATH HOME WITH BONUS ROOM. PERFECT FOR FIRST TIME BUYERS. SPACIOUS LIVING ROOM/GREAT ROOM, EAT-IN KITCHEN, SCREENED PORCH, LARGE BACKYARD WITH SHED, BONUS ROOM CAN BE USED AS OFFICE OR 3RD BEDROOM. INSIDE UTILITY. CLOSE TO SHOPPING, RESTAURANTS, I-4 AND MUCH MORE. THIS IS A GREAT STARTER HOME, COME SEE INSIDE!
-
2007-08-21$179,900 330-char remark
Show marketing remark (330 chars)
LOVELY TWO BED/TWO BATH HOME WITH BONUS ROOM. PERFECT FOR FIRST TIME BUYERS. SPACIOUS LIVING ROOM/GREAT ROOM, EAT-IN KITCHEN, SCREENED PORCH, LARGE BACKYARD WITH SHED, BONUS ROOM CAN BE USED AS OFFICE OR 3RD BEDROOM. INSIDE UTILITY. CLOSE TO SHOPPING, RESTAURANTS, I-4 AND MUCH MORE. THIS IS A GREAT STARTER HOME, COME SEE INSIDE!
-
2007-08-07historical
-
2007-06-11$189,000
ⓘ Source: listings_history table (triggers on properties + properties_extension) + one-shot
backfill from property_details.listing_events for pre-trigger history.
Tax reassessment forecast FL · Resets to sale price
- Current annual tax
- $875 · $73/mo
- Projected year-2 tax
- $1,452 · $121/mo
- Expected delta
- +$578/yr (+$48/mo · 66.1%)
ⓘ Screening estimate from a state-policy table — verify with the county assessor before closing.
Climate risk First Street
- Flood 1/10 Low FEMA zone X (unshaded) · 0% chance over 30 yrs
- Wildfire 1/10 Low
- Heat 9/10 Extreme 7 d/yr ≥108°F today · 23 d/yr by 30 yrs out
- Wind 9/10 Extreme 99% chance of damaging wind over 30 yrs
- Air quality 1/10 Low 0 unhealthy d/yr today · 0 by 30 yrs out
Nearby sold comps map
Loading sold comps map…
Walkable amenities ~0.75 mi
Loading nearby amenities…
Taxation est. · year 1
- Rental income
- $23,458
- − Mortgage interest
- −$9,803
- − Property taxes
- −$875
- − Insurance
- −$875
- − Repairs & maintenance
- −$1,877
- − Management
- −$1,877
- − Depreciation
- −$5,091
- Taxable income
- $3,062
- Est. tax owed @ 24.0%
- −$735
- After-tax cash flow
- $5,035/yr
For passive investors: Depreciation is non-cash, so a rental often shows a tax loss while cash-flowing — sheltering income. Rental losses are passive: they offset passive income freely, and up to $25,000/yr can offset ordinary (W-2) income if you actively participate and your MAGI is under $100k (phasing out to $0 by $150k); unused losses carry forward. On sale, claimed depreciation is recaptured at up to 25%, and gains may owe capital-gains tax (a 1031 exchange can defer both). Figures are a year-1 estimate at your 24.0% rate — not tax advice; consult a CPA.
Schools (NCES district)
- District
- Orange
- NCES district ID
- 1201440
- Math proficiency
- 46% ▼ -9.00%
- Reading proficiency
- 51% ▼ -2.00%
- Median HH income
- $49,350
- Composite
- 41.47/100
- National rank
- #3461
- State rank
- #43 of 73 in FL
Livability — Pine Hills
- Score
- 73/100
- State rank
- #317
- US rank
- #5362
Category grades
Schools grade is shown separately in the Schools card above.
Census & demographics
- Census place
- Pine Hills, FL
- County
- Orange County · 1,471,359 people
- City population
- 60,203
- Metro
- Orlando-Kissimmee-Sanford, FL
- Population (ZIP)
- 59,114
- Household income
- $63,061
- Rent vs Own
- Severe rent burden
- 2059.0
Population outlook (Orange County) Hauer SSP2
- Today (2025)
- 1,618,226 people
- By 2030
- 1,787,404 · +10.5%
- By 2040
- 2,125,621 · +31.4%
- By 2050
- 2,454,016 · +51.6%
- By 2075
- 3,173,711 · +96.1%
- By 2100
- 3,607,781 · +122.9%
Race, ethnicity, and origin ACS 2023
- Neighborhood character
- Predominantly Black (69%)
- Race & ethnicity
- Black 69% Hispanic / Latino 14% White 10% Two or more races 6% Asian 3%
- Hispanic origin (detail)
- Mexican 3% Puerto Rican 5% Cuban 1%
- Common ancestry
- Hispanic 21% Estonian 1% Romanian 1%
- Foreign-born
- 40% · Canada, Vietnam, China
- Languages at home
- 59% English-only · French/Haitian/Cajun 25% Spanish 11% Vietnamese 2%
Political lean MEDSL · Orange
- 2024 margin
- D (+13.6) · D 56.1% · R 42.5% · Other 1.3%
- 2008→2024 swing
- -5.0pp toward R · 2008: 18.6pp · 2024: 13.6pp
- All cycles
- 2024: D+13.6 2020: D+23.1 2016: D+24.6 2012: D+18.2 2008: D+18.6
Not yet ingested
- Civics
- —
Market trends
- HPI YoY
- ▼ -93.40%
- Current HPI
- 321.5821
- Rent YoY
- ▼ -2.66%
- Metro
- Orlando-Kissimmee-Sanford, FL
- State GDP YoY
- ▲ 3.28%
- F500 in state
- 36
Industry mix (Fortune 500 HQ in FL)
| Industry | F500 HQs | Revenue |
|---|---|---|
| Industrial Technology | 2 | $29B |
|
||
| Insurance | 2 | $17B |
|
||
| Retail | 1 | $60B |
|
||
| Technology Distribution | 1 | $58B |
|
||
| Homebuilding | 1 | $35B |
|
||
| Technology Manufacturing | 1 | $35B |
|
||
Price history
-7.4% since first listed8 events — show timeline
- 2021-04-01 Pending — Stellar MLS as Distributed by MLS Grid
- 2019-07-25 Pending — Stellar MLS as Distributed by MLS Grid
- 2019-07-25 Listed $175,000 Stellar MLS as Distributed by MLS Grid
- 2008-01-16 Sold (Public Records) $162,000 Public Records
- 2007-12-28 Sold (MLS) $162,000 Stellar MLS as Distributed by MLS Grid
- 2007-08-21 Listed $179,900 Stellar MLS as Distributed by MLS Grid
- 2007-08-07 Listing Removed — Stellar MLS as Distributed by MLS Grid
- 2007-06-11 Listed $189,000 Stellar MLS as Distributed by MLS Grid
Property tax history
+3.7%/yrLatest (2025): $875 · +13.8% YoY. Source: county tax records.
Cash-flow waterfall
monthlySold comps — $/sqft
last 12 mo · ≤1 miLoading sold comps…