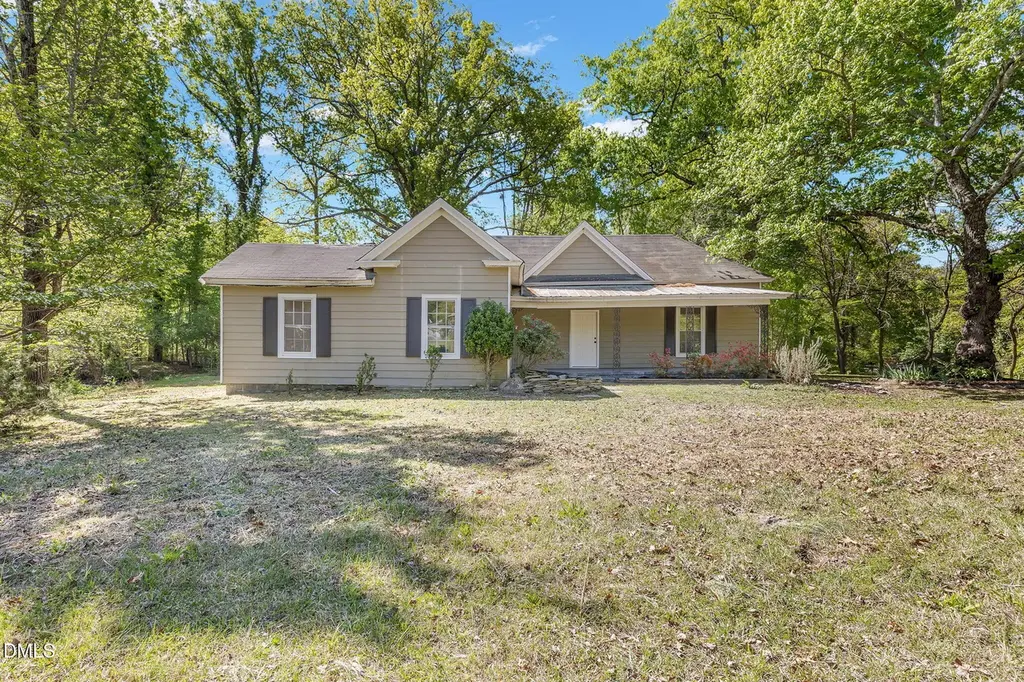
162 Lin Tilley Rd · Durham, NC
Flood risk 1/10 · Minimal
- FEMA flood zone
- X (unshaded)
- Chance of flooding over 30 yrs
- 0.0%
- Est. flood insurance / yr
- $507 – $1,088
Fire risk 3/10 · Minor
- Est. fire insurance / yr
- $906 – $1,684
Heat risk 6/10 · Moderate
- Hot days now (above 105°F)
- 7 days/yr
- Hot days in 30 yrs
- 17 days/yr
Wind risk 6/10 · Moderate
- Chance of severe wind over 30 yrs
- 27.0%
Air-quality risk 2/10 · Minimal
- Unhealthy air days now
- 1 days/yr
- Unhealthy air days in 30 yrs
- 1 days/yr
Risk factors via First Street. Map © Google.
Why this score? — see what drove the D+ grade
The composite is a weighted blend of 9 inputs, each scored 0–100. Each bar is that input's sub-score; the figure is the points it added to the 100-point composite (weight × sub-score).
- ARV discount +15.0/15.0
- Cash flow +14.9/30.0
- DSCR +4.5/10.0
- Livability +4.0/5.0
- 1% rule +3.4/10.0
- Schools +3.0/10.0
- Rent growth +2.5/5.0
- Condition / age +2.5/5.0
- Appreciation +0.0/10.0
$245,000
🖨 Deal sheet 📄 Offer letter ✓ Due diligence
Listing remarks
INVESTOR OPPORTUNITY This 3 bed / 1 bath home on a spacious 1 acre Durham lot next to pond is priced ~$130k below area comparable properties, making it an excellent candidate for your next project. Ideal for a fix and flip, buy and hold rental, or an owner-occupant looking to build equity, this property offers strong upside with the right vision. The home needs TLC and cosmetic updates including paint, roof, and general improvements. Features include a generous living room with a wood-burning fireplace and large farmhouse style kitchen. The huge corner lot provides room to add value or expand. With the right updates, this property could truly shine and deliver strong returns.
Key facts
- Expansive lot
- Spacious durham lot
- Back deck
Tags
Property features AI
Finance
- Other: Approximately 1.0 acre lot; Zoned RD; Living area about 1,500
- HOA & community: No homeowners association
Exterior
- Utilities: Private well water; Septic tank
- Home design: Site-built single-story home; One level
- Construction: Vinyl siding; Block foundation; Aluminum and asphalt roof
- Exterior features: Fire pit; Publicly maintained road access
Interior
- Bedrooms: 3 bedrooms (all on the main level)
- Flooring: Carpet; Hardwood
- Bathrooms: 1 full bathroom
- Heating & cooling: Electric heating; Central air conditioning
- Interior features: Carpet flooring; Hardwood flooring
Neighborhood map
What this means for you Summary
Snapshot
- This is a 3-bed/1.0-bath single-family listed at $245k.
Deal economics
- At list price, monthly cash flow is $71 ($847/yr) — positive.
- The deal already cash-flows at list — no discount required.
- To meet the 1% rule (rent ≥ 1% of price), the offer needs to be $205k (16.3% below list).
- Recommended offer: $205k (16.3% below list) — sets the bar for 1% rule.
- Cap rate 6.6% vs local median 3.0% in Durham — top-decile yield for the area; either an underpriced asset or a hidden risk that comps aren't pricing in. Stress-test before assuming the spread holds.
Location & tenants
- Location reads 81/100 on livability (#15 in NC, #1,411 nationally) — a professional / high-income tenant draw. Strengths: amenities A+, commute A+, housing A+; Watch: crime F.
- Durham Public Schools (urban): math 29% / reading 39% proficiency, ranked #132 of 178 in NC (top 74%) — families likely to look elsewhere, expect single-tenant / working-renter base with shorter leases.
- Zoned schools: Northern High (math 30% / reading 35%, grade F, #441 of 535 statewide, top 83%, 1,308 students, 64% FRL).
- Market conditions: 182 active listings in the ZIP; 1 comparable units currently listed for rent nearby; 2,905 units permitted in Durham County in 2024 (955 in 5+ unit buildings).
Forward outlook
- Local home prices are declining (-3.0%/yr); year-one equity from $2k of loan paydown is wiped out by about $7k of value loss. Plan a longer hold.
- Durham County population projected at +44% by 2050 — long-run rental-demand tailwind backs the buy-and-hold thesis.
Negotiation context
- It's been on market 62 days — a 6% lower offer ($230k) is reasonable based on typical stale-listing flexibility.
- Current owner paid $185k; 32% above their basis — modest negotiation headroom, anchor on the comps not their cost.
Risks & watch-outs
- Watch-outs: built in 1900 — expect roof / HVAC / electrical / plumbing capex.
- Climate carrying-cost: major wind risk, 27% chance of damaging wind over 30y; extreme-heat days projected 7→17/yr by 2055 (HVAC capex compounding) — expect insurance premiums to compound above CPI over the hold.
Questions for the listing agent
- It's been on market 62 days. Have you received any prior offers? Is the seller open to a 16% concession, seller financing, or rate buy-down credit?
- Built in 1900 — when were the roof, HVAC, electrical panel, plumbing, and water heater last replaced?
- Why hasn't it sold? Are there any deal-killer items the seller is aware of (foundation, flood, title, zoning, code violations)?
- Is there a deadline driving the sale (1031 exchange, divorce, estate, relocation)? That informs how much negotiation room exists.
- Schools are D-rated, which usually means shorter tenancies and higher turnover. Who's the typical renter profile here, and what's been the actual vacancy rate?
- Crime grade is F in this area — have there been break-ins, vandalism, or insurance claims at this property in the last 3 years? What carrier currently insures it and at what premium?
- The area grade is low — what's the realistic commute time and amenity access for the typical tenant pool here? Any planned neighborhood developments (good or bad) we should know about?
- What's the average days-on-market for RENTAL listings here right now (not sales)? A rising rental-DOM trend means longer vacancies and softer asking-rent achievability than the comps imply.
- What's the recent tenant-quality profile in this submarket — average credit score on applications, eviction rate, late-payment / NSF rate, and stable-employment percentage? A property-management company in the area should have these aggregated.
- How much new for-sale + rental construction is in the pipeline within 1–3 miles? Heavy new supply typically softens prices + rents 12–24 months out; constrained supply supports both.
Investment metrics
- 1% rule
- 0.84% ✗
- Cap rate
- 6.64%
- Cash-on-cash
- 1.24%
- DSCR
- 1.05
- GRM
- 10.0
CMA / ARV
- ARV (on-the-fly)
- $329,120
- Comps found
- 12
Show comp detail 12 sales within ~0.75 mi
| Address | Dist | Beds/Ba | Sqft | Sold | Price | $/sf | Match |
|---|---|---|---|---|---|---|---|
| 145 Barclay Rd | 0.13mi | 3/2.0 | 1,456 (-3%) | 4mo | $370,000 | $254 | 82 |
| 310 Mickey Cir | 0.31mi | 3/1.5 | 1,376 (-8%) | 1mo | $300,000 | $218 | 69 |
| 5617 Laurel Crest Dr | 0.35mi | 3/1.5 | 1,440 (-4%) | 8mo | $299,000 | $208 | 68 |
| 128 Barclay Rd | 0.25mi | 3/2.0 | 1,432 (-4%) | 12mo | $405,000 | $283 | 68 |
| 219 Barclay Rd | 0.05mi | 3/2.0 | 1,697 (+13%) | 10mo | $360,000 | $212 | 63 |
| 155 Smith Dr | 0.17mi | 3/2.0 | 1,299 (-13%) | 4mo | $270,000 | $208 | 63 |
| 328 Smith Dr | 0.20mi | 3/2.0 | 1,682 (+12%) | 4mo | $364,900 | $217 | 63 |
| 5900 Wilma St | 0.31mi | 4/3.0 (+1) | 1,525 (+2%) | 17mo | $336,200 | $220 | 55 |
| 5817 Tomahawk Trl | 0.24mi | 3/2.0 | 1,674 (+12%) | 17mo | $332,000 | $198 | 50 |
| 404 Goodwin Rd | 0.52mi | 3/2.0 | 1,300 (-13%) | 6mo | $352,500 | $271 | 44 |
| 6 Blake Ct | 0.71mi | 3/2.0 | 1,356 (-9%) | 4mo | $350,000 | $258 | 44 |
| 316 Deerfield Ave | 0.72mi | 3/2.0 | 1,618 (+8%) | 15mo | $399,000 | $247 | 36 |
Match score weights: distance 35% · size 25% · config 20% · recency 20%. Top-matched comps best support the ARV.
Projected returns pro-forma
-3.0% appreciation · 3.0% rent growth · sell at horizon
- IRR
- -14.4%
- Equity multiple
- 0.49×
- Total profit
- $-35,261
- Equity at exit
- $36,530
- IRR
- -5.7%
- Equity multiple
- 0.63×
- Total profit
- $-25,147
- Equity at exit
- $21,183
Cash invested: $68,600 (down + closing). Projections, not guarantees.
Landlord ↔ Tenant lean methodology
- Overall (STATE)
- 85 Strongly Landlord-Friendly
- State North Carolina
- 85 Strongly Landlord-Friendly · R+3
- County
- — inherits STATE
- City
- — inherits STATE
ZIP-level market 27712
- Active inventory
- 182
- Price-to-rent
- 10.0×
Monthly cashflow live
- Estimated rent
- $2,050 medium interval (Pro) →
- Mortgage (P&I)
- −$1,285
- Tax from tax record
- −$162 /mo · $1,944/yr
- Insurance
- −$102
- HOA
- −$0
- Vacancy / Maint / Mgmt
- −$430
- Net cashflow
- $71
Break-even live
UW: 25.0% down · 7.5% · 30yr · 1.5% tax · 5.0% vac · 8.0% maint · 8.0% mgmt
Financing live
Cash to close
- Down payment
- $61,250
- Closing costs
- $7,350
- Reserves months
- —
- Total cash needed
- —
Loan-product check · same deal, 3 products live
Conventional
25% down · 7.5% · 30yr
- Down + closing
- —
- Monthly P&I
- —
- Monthly cashflow
- —
- DSCR
- —
- Eligible?
- —
Personal DTI + credit; lowest rate.
DSCR
20% down · 8.5% · 30yr
- Down + closing
- —
- Monthly P&I
- —
- Monthly cashflow
- —
- DSCR
- —
- Eligible?
- —
No personal income docs; deal must DSCR.
Hard money
10% down · 12.0% · 12mo
- Down + closing
- —
- Monthly P&I
- —
- Monthly cashflow
- —
- DSCR
- —
- Eligible?
- —
Short-term bridge; refi at stabilization.
Rent comps 1 comps
| Address | Beds | Baths | Sqft | Rent | $/sqft | DOM | Units | Dist |
|---|---|---|---|---|---|---|---|---|
| 24 Ballard Ct Durham, NC | 3.0 | 2.5 | 1820 | $2,050 | $1.13 | 23d | 1 | 1.37mi |
Listing history 17 events
-
2026-06-14statusdays on market $245,000 Pending 62 DOM
-
2026-06-10days on market $245,000 Active 60 DOM
-
2026-06-09days on market $245,000 Active 59 DOM
-
2026-06-08days on market $245,000 Active 58 DOM
-
2026-06-07days on market $245,000 Active 57 DOM
-
2026-06-05days on market $245,000 Active 54 DOM
-
2026-06-03days on market $245,000 Active 53 DOM
-
2026-06-02days on market $245,000 Active 52 DOM
-
2026-06-01days on market $245,000 Active 51 DOM
-
2026-05-31days on market $245,000 Active 50 DOM
-
2026-05-30days on market $245,000 Active 49 DOM
-
2026-05-05price $245,000
-
2026-04-24price $254,900
-
2026-04-11$269,900 Active
-
2026-04-02soldstatus $185,000
-
2007-10-05soldstatus $80,000
-
2006-10-17soldstatus $50,000
ⓘ Source: listings_history table (triggers on properties + properties_extension) + one-shot
backfill from property_details.listing_events for pre-trigger history.
Tax reassessment forecast NC · Resets to sale price
- Current annual tax
- $1,944 · $162/mo
- Projected year-2 tax
- $2,009 · $167/mo
- Expected delta
- +$65/yr (+$5/mo · 3.3%)
ⓘ Screening estimate from a state-policy table — verify with the county assessor before closing.
Climate risk First Street
- Flood 1/10 Low FEMA zone X (unshaded) · 0% chance over 30 yrs
- Wildfire 3/10 Moderate
- Heat 6/10 Major 7 d/yr ≥105°F today · 17 d/yr by 30 yrs out
- Wind 6/10 Major 27% chance of damaging wind over 30 yrs
- Air quality 2/10 Low 1 unhealthy d/yr today · 1 by 30 yrs out
Nearby sold comps map
Loading sold comps map…
Walkable amenities ~0.75 mi
Loading nearby amenities…
Taxation est. · year 1
- Rental income
- $24,600
- − Mortgage interest
- −$13,724
- − Property taxes
- −$1,944
- − Insurance
- −$1,225
- − Repairs & maintenance
- −$1,968
- − Management
- −$1,968
- − Depreciation
- −$7,127
- Taxable loss
- −$3,356
- Est. tax savings @ 24.0%
- +$805
- After-tax cash flow
- $1,653/yr
For passive investors: Depreciation is non-cash, so a rental often shows a tax loss while cash-flowing — sheltering income. Rental losses are passive: they offset passive income freely, and up to $25,000/yr can offset ordinary (W-2) income if you actively participate and your MAGI is under $100k (phasing out to $0 by $150k); unused losses carry forward. On sale, claimed depreciation is recaptured at up to 25%, and gains may owe capital-gains tax (a 1031 exchange can defer both). Figures are a year-1 estimate at your 24.0% rate — not tax advice; consult a CPA.
Schools (NCES district)
- District
- Durham Public Schools
- NCES district ID
- 3701260
- Math proficiency
- 29% ▼ -3.00%
- Reading proficiency
- 39% ▲ 2.00%
- Median HH income
- $52,143
- Composite
- 29.69/100
- National rank
- #6457
- State rank
- #132 of 178 in NC
Livability — Durham
- Score
- 81/100
- State rank
- #15
- US rank
- #1411
Category grades
Schools grade is shown separately in the Schools card above.
Census & demographics
- City population
- 288,747
- Population (ZIP)
- 23,541
Population outlook (Durham County) Hauer SSP2
- Today (2025)
- 368,962 people
- By 2030
- 402,686 · +9.1%
- By 2040
- 468,677 · +27.0%
- By 2050
- 531,727 · +44.1%
- By 2075
- 660,446 · +79.0%
- By 2100
- 739,971 · +100.6%
Race, ethnicity, and origin ACS 2023
- Neighborhood character
- Diverse neighborhood (Simpson 0.55)
- Race & ethnicity
- White 63% Black 20% Hispanic / Latino 9% Two or more races 7% Asian 3%
- Hispanic origin (detail)
- Mexican 5%
- Common ancestry
- Lithuanian 2% Slovak 2% Italian 1%
- Foreign-born
- 9% · Canada, South Korea, Jamaica
- Languages at home
- 87% English-only · Spanish 8% Vietnamese 1% French/Haitian/Cajun 1%
Political lean MEDSL · Durham
- 2024 margin
- Solid D (+61.9) · D 80.2% · R 18.2% · Other 1.6%
- 2008→2024 swing
- +10.0pp toward D · 2008: 51.9pp · 2024: 61.9pp
- All cycles
- 2024: D+61.9 2020: D+62.4 2016: D+60.4 2012: D+52.7 2008: D+51.9
Not yet ingested
- Civics
- —
Market trends
- HPI YoY
- ▼ -330.00%
- Current HPI
- 235.8036
- Rent YoY
- —
- Metro
- —
- State GDP YoY
- ▲ 3.28%
- F500 in state
- 26
Industry mix (Fortune 500 HQ in NC)
| Industry | F500 HQs | Revenue |
|---|---|---|
| Financial Services | 2 | $213B |
|
||
| Retail | 2 | $95B |
|
||
| Industrial Conglomerate | 1 | $38B |
|
||
| Metals / Steel | 1 | $35B |
|
||
| Utilities | 1 | $30B |
|
||
| Industrial Machinery | 1 | $19B |
|
||
Price history
+390.0% since first listed6 events — show timeline
- 2026-05-05 Price Changed $245,000 TMLS
- 2026-04-24 Price Changed $254,900 TMLS
- 2026-04-11 Listed $269,900 TMLS
- 2026-04-02 Sold (Public Records) $185,000 Public Records
- 2007-10-05 Sold (Public Records) $80,000 Public Records
- 2006-10-17 Sold (Public Records) $50,000 Public Records
Property tax history
+7.2%/yrLatest (2025): $1,944 · +15.3% YoY. Source: county tax records.
Cash-flow waterfall
monthlySold comps — $/sqft
last 12 mo · ≤1 miLoading sold comps…