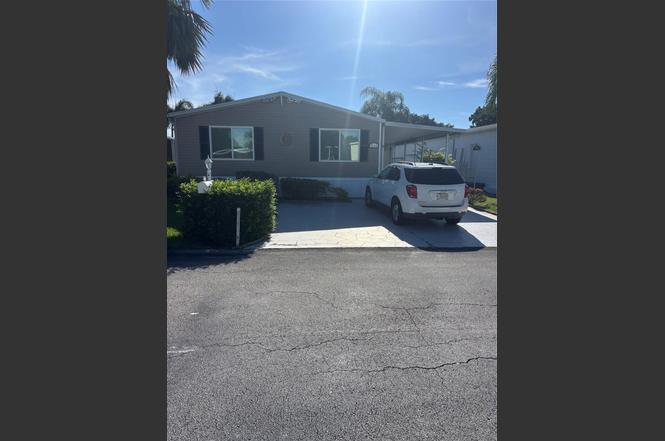
5116 NW 4th Ave · Deerfield Beach, FL
Flood risk 1/10 · Minimal
- FEMA flood zone
- X (shaded)
- Chance of flooding over 30 yrs
- 0.0%
- Est. flood insurance / yr
- $507 – $1,088
Fire risk 1/10 · Minimal
- Est. fire insurance / yr
- $947 – $1,759
Heat risk 9/10 · Severe
- Hot days now (above 107°F)
- 7 days/yr
- Hot days in 30 yrs
- 23 days/yr
Wind risk 10/10 · Severe
- Chance of severe wind over 30 yrs
- 99.0%
Air-quality risk 2/10 · Minimal
- Unhealthy air days now
- 1 days/yr
- Unhealthy air days in 30 yrs
- 3 days/yr
Risk factors via First Street. Map © Google.
Why this score? — see what drove the C- grade
The composite is a weighted blend of 9 inputs, each scored 0–100. Each bar is that input's sub-score; the figure is the points it added to the 100-point composite (weight × sub-score).
- Cash flow +18.2/30.0
- ARV discount +7.5/15.0
- 1% rule +6.1/10.0
- DSCR +5.7/10.0
- Schools +4.1/10.0
- Livability +3.8/5.0
- Rent growth +2.9/5.0
- Condition / age +2.5/5.0
- Appreciation +0.0/10.0
$239,500
🖨 Deal sheet 📄 Offer letter ✓ Due diligence
Listing remarks MLS
55+ GATED COMM, BEAUTIFULLY DECORATED DOUBLE WIDE MANUFACTURED HM, 3RD BEDRM CONV TO DEN, LAMINATE WOOD FLRS, ROMAN TUB IN MAST BTH, SKYLIGHT & ISLAND IN KITCH, WHIRPOOL APP, MOVE IN CONDITION, MEASUREMNTS APPROX. CALL LISTING AGENT FOR SHOWING INSTRUCTIONS- ARIANA (561) 574-8182
Key facts
- Private lot
- Clubhouse
- Tennis courts
Tags
Property features AI
Finance
- HOA & community: Has association with clubhouse and pool; HOA fee $385 (paid quarterly); Association fee includes trash; Senior community; Pets allowed (size limits apply)
Exterior
- Parking: Carport (3 spaces); 3 covered parking spaces; Guest parking; Golf cart parking
- Utilities: Public water; Public sewer; Cable available
- Home design: Mobile home; One story; First floor entry
- Construction: Resale condition
- Exterior features: Shed(s); First-floor entry; Not waterfront; Faces west
Interior
- Kitchen: Electric range; Refrigerator
- Bedrooms: 2 bedrooms (both on the main level)
- Flooring: Marble
- Bathrooms: 2 full bathrooms
- Heating & cooling: Central heating; Central air conditioning
- Interior features: Partially furnished; Disposal
- Laundry & utility: Electric water heater
Neighborhood map
What this means for you Summary
Snapshot
- This is a 2-bed/2.0-bath manufactured listed at $240k.
Deal economics
- At list price, monthly cash flow is $213 ($3k/yr) — positive.
- The deal already cash-flows at list — no discount required.
- Meets the 1% rule at list price ($3k rent vs $240k).
- Recommended offer: $218k (9.0% below list) — sets the bar for market timing.
- Cap rate 7.4% vs local median 4.2% in Deerfield Beach — top-decile yield for the area; either an underpriced asset or a hidden risk that comps aren't pricing in. Stress-test before assuming the spread holds.
Location & tenants
- Location reads 75/100 on livability (#250 in FL, #3,970 nationally) — a middle-class / working-renter tenant base. Strengths: housing A+, health & safety A+, cost of living A; Watch: schools D-, amenities D-, employment D-.
- Broward (suburban): math 42% / reading 53% proficiency, ranked #46 of 73 in FL (top 63%) — families likely to look elsewhere, expect single-tenant / working-renter base with shorter leases.
- Market conditions: Rents rising (+1.8%/yr); 591 active listings in the ZIP; 40 comparable units currently listed for rent nearby; rentals at typical pace (median 24d on market — plan ~3-4 weeks tenant-placement turnaround); 2,111 units permitted in Broward County in 2024 (1,265 in 5+ unit buildings).
- This rent runs 45% of the median local income ($71k/yr) — at the standard rent-burdened threshold; future hikes will face affordability resistance.
Forward outlook
- Local home prices are declining (-3.0%/yr); year-one equity from $2k of loan paydown is wiped out by about $7k of value loss. Plan a longer hold.
- Broward County population projected at +34% by 2050 — long-run rental-demand tailwind backs the buy-and-hold thesis.
Negotiation context
- It's been on market 99 days — a 9% lower offer ($218k) is reasonable based on typical stale-listing flexibility.
- 2 sale attempts since 21y ago with the ask held roughly flat each time — persistent listings suggest the price (not the market) is what's stuck; bring a comps-based counter.
- Current owner paid $158k; list at $240k implies a 52% gain — meaningful room to come down on a strong offer.
Risks & watch-outs
- Climate carrying-cost: severe wind risk, 99% chance of damaging wind over 30y; extreme-heat days projected 7→23/yr by 2055 (HVAC capex compounding) — expect insurance premiums to compound above CPI over the hold.
Questions for the listing agent
- It's been on market 99 days. Have you received any prior offers? Is the seller open to a 9% concession, seller financing, or rate buy-down credit?
- What does the HOA fee cover, when was the last increase, and are there any pending special assessments or reserve-fund shortfalls?
- Why hasn't it sold? Are there any deal-killer items the seller is aware of (foundation, flood, title, zoning, code violations)?
- Is there a deadline driving the sale (1031 exchange, divorce, estate, relocation)? That informs how much negotiation room exists.
- Schools are D-rated, which usually means shorter tenancies and higher turnover. Who's the typical renter profile here, and what's been the actual vacancy rate?
- What's the average days-on-market for RENTAL listings here right now (not sales)? A rising rental-DOM trend means longer vacancies and softer asking-rent achievability than the comps imply.
- What's the recent tenant-quality profile in this submarket — average credit score on applications, eviction rate, late-payment / NSF rate, and stable-employment percentage? A property-management company in the area should have these aggregated.
- How much new for-sale + rental construction is in the pipeline within 1–3 miles? Heavy new supply typically softens prices + rents 12–24 months out; constrained supply supports both.
Investment metrics
- 1% rule
- 1.11% ✓
- Cap rate
- 7.36%
- Cash-on-cash
- 3.81%
- DSCR
- 1.17
- GRM
- 7.5
CMA / ARV
No comps found within radius.
Projected returns pro-forma
-3.0% appreciation · 1.75% rent growth · sell at horizon
- IRR
- -11.8%
- Equity multiple
- 0.58×
- Total profit
- $-28,367
- Equity at exit
- $35,710
- IRR
- -4.8%
- Equity multiple
- 0.71×
- Total profit
- $-19,722
- Equity at exit
- $20,708
Cash invested: $67,060 (down + closing). Projections, not guarantees.
Landlord ↔ Tenant lean methodology
- Overall (STATE)
- 87 Strongly Landlord-Friendly
- State Florida
- 87 Strongly Landlord-Friendly · R+3
- County
- — inherits STATE
- City
- — inherits STATE
ZIP-level market 33064
- Home prices YoY
- -18.7%
- Rents YoY
- 1.8%
- Active inventory
- 591
- Price-to-rent
- 7.5×
Monthly cashflow live
- Estimated rent
- $2,665 high interval (Pro) →
- Mortgage (P&I)
- −$1,256
- Tax from tax record
- −$408 /mo · $4,898/yr
- Insurance
- −$100
- HOA
- −$128
- Vacancy / Maint / Mgmt
- −$560
- Net cashflow
- $213
Break-even live
UW: 25.0% down · 7.5% · 30yr · 1.5% tax · 5.0% vac · 8.0% maint · 8.0% mgmt
Financing live
Cash to close
- Down payment
- $59,875
- Closing costs
- $7,185
- Reserves months
- —
- Total cash needed
- —
Loan-product check · same deal, 3 products live
Conventional
25% down · 7.5% · 30yr
- Down + closing
- —
- Monthly P&I
- —
- Monthly cashflow
- —
- DSCR
- —
- Eligible?
- —
Personal DTI + credit; lowest rate.
DSCR
20% down · 8.5% · 30yr
- Down + closing
- —
- Monthly P&I
- —
- Monthly cashflow
- —
- DSCR
- —
- Eligible?
- —
No personal income docs; deal must DSCR.
Hard money
10% down · 12.0% · 12mo
- Down + closing
- —
- Monthly P&I
- —
- Monthly cashflow
- —
- DSCR
- —
- Eligible?
- —
Short-term bridge; refi at stabilization.
Rent comps 40 comps
| Address | Beds | Baths | Sqft | Rent | $/sqft | DOM | Units | Dist |
|---|---|---|---|---|---|---|---|---|
| 1947 Discovery Cir E Deerfield Beach, FL | 2.0 | 2.0 | 1126 | $2,450 | $2.18 | 24d | 1 | 0.28mi |
| 1929 SW 15th St #41 Deerfield Beach, FL | 2.0 | 2.0 | 1150 | $2,400 | $2.09 | 24d | 1 | 0.30mi |
| 2067 SW 15th St Deerfield Beach, FL | 2.0 | 2.0 | 1150 | $2,300 | $2.00 | 20d | 2 | 0.36mi |
| 2246 Discovery Cir W Deerfield Beach, FL | 2.0 | 2.5 | 1300 | $2,650 | $2.04 | 24d | 1 | 0.40mi |
| 2149 Discovery Cir W Unit 1 Deerfield Beach, FL | 2.0 | 2.5 | 1300 | $2,850 | $2.19 | 22d | 1 | 0.44mi |
| 2217 Discovery Cir W Deerfield Beach, FL | 2.0 | 2.5 | 1429 | $2,400 | $1.68 | 15d | 1 | 0.45mi |
| 2297 SW 15th St #122 Deerfield Beach, FL | 2.0 | 2.0 | 1200 | $2,200 | $1.83 | 12d | 1 | 0.47mi |
| 2173 Discovery Cir W Deerfield Beach, FL | 2.0 | 2.0 | 1126 | $2,950 | $2.62 | 3d | 1 | 0.49mi |
| 2265 SW 15th St #165 Deerfield Beach, FL | 3.0 | 2.0 | 1350 | $2,400 | $1.78 | 24d | 1 | 0.49mi |
| 1234 S Military Trl #1811 Deerfield Beach, FL | 2.0 | 2.0 | 1099 | $2,500 | $2.27 | 24d | 1 | 0.49mi |
| 4503 NW 6th Ave Deerfield Beach, FL | 3.0 | 2.0 | 1148 | $2,850 | $2.48 | 24d | 1 | 0.51mi |
| 1266 S Military Trl Deerfield Beach, FL | 1.0–2.0 | 1.0–2.0 | 1050 | $2,550 | $2.43 | 22d | 2 | 0.51mi |
| 4905 NE 2nd Way Pompano Beach, FL | 2.0 | 1.0 | 1100 | $2,150 | $1.95 | 24d | 1 | 0.52mi |
| 2355 SW 15th St Deerfield Beach, FL | 2.0 | 2.0 | 1100 | $2,098 | $1.91 | 24d | 2 | 0.55mi |
| 265 NE 46th St Deerfield Beach, FL | 2.0 | 1.0 | 1335 | $2,250 | $1.69 | 17d | 1 | 0.61mi |
| 1100 S Military Trl Deerfield Beach, FL | 2.0–3.0 | 1.0–2.0 | 1119 | $2,250 | $2.01 | 24d | 2 | 0.62mi |
| 1398 SW 24th Ter Deerfield Beach, FL | 3.0 | 2.0 | 1865 | $5,000 | $2.68 | 24d | 1 | 0.62mi |
| 220 NW 43rd Ct Deerfield Beach, FL | 3.0 | 2.0 | 1458 | $2,700 | $1.85 | 15d | 1 | 0.65mi |
| 5161 NW 11th Ln Deerfield Beach, FL | 3.0 | 2.0 | 1486 | $2,925 | $1.97 | 24d | 1 | 0.69mi |
| 4313 NW 6th Ave Deerfield Beach, FL | 3.0 | 2.0 | 1348 | $2,850 | $2.11 | 22d | 1 | 0.69mi |
| 220 NW 43rd St Deerfield Beach, FL | 3.0 | 2.0 | 1458 | $2,800 | $1.92 | 24d | 1 | 0.70mi |
| 378 NE 47th Pl #378 Pompano Beach, FL | 3.0 | 2.5 | 1457 | $3,000 | $2.06 | 24d | 1 | 0.71mi |
| 5140 NW 11th Dr Deerfield Beach, FL | 3.0 | 2.0 | 1324 | $3,000 | $2.27 | 14d | 1 | 0.71mi |
| 4332 NW 1st Ter Deerfield Beach, FL | 3.0 | 2.0 | 1095 | $3,000 | $2.74 | 5d | 1 | 0.72mi |
| 4332 NW 1st Ter Deerfield Beach, FL | 3.0 | 2.0 | 1095 | $3,000 | $2.74 | 24d | 1 | 0.72mi |
| 540 NW 43rd St Deerfield Beach, FL | 2.0 | 2.0 | 1150 | $2,500 | $2.17 | 18d | 1 | 0.73mi |
| 4344 NW 9th Ave Unit 10-2B Pompano Beach, FL | 2.0 | 2.0 | 1290 | $1,730 | $1.34 | 24d | 1 | 0.80mi |
| 4314 NW 9th Ave Deerfield Beach, FL | 1.0–2.0 | 1.5–2.0 | 992 | $1,940 | $1.95 | 15d | 2 | 0.80mi |
| 2776 SW 15th St Deerfield Beach, FL | 2.0 | 2.5 | 1236 | $2,900 | $2.35 | 24d | 1 | 0.81mi |
| 831 SW 14th Ct Deerfield Beach, FL | 3.0 | 2.0 | 1056 | $2,850 | $2.70 | 24d | 1 | 0.85mi |
| 4321 NW 9th Ave #204 Deerfield Beach, FL | 2.0 | 2.0 | 1360 | $2,350 | $1.73 | 7d | 1 | 0.86mi |
| 4362 Veleiros Ave Pompano Beach, FL | 3.0 | 2.5 | 1628 | $3,700 | $2.27 | 24d | 1 | 0.88mi |
| 1361 SW 26th Ave Deerfield Beach, FL | 3.0 | 2.0 | 1932 | $3,850 | $1.99 | 16d | 1 | 0.88mi |
| 1280 NW 49th St Deerfield Beach, FL | 3.0 | 2.0 | 1575 | $2,700 | $1.71 | 24d | 1 | 0.90mi |
| 4329 Veleiros Ave Pompano Beach, FL | 3.0 | 2.5 | 1479 | $3,499 | $2.37 | 24d | 1 | 0.96mi |
| 2826 SW 12th St Deerfield Beach, FL | 2.0 | 2.5 | 1236 | $2,600 | $2.10 | 4d | 1 | 0.97mi |
| 1221 NW 44th St Deerfield Beach, FL | 3.0 | 2.0 | 1624 | $3,100 | $1.91 | 7d | 1 | 0.98mi |
| 4030 NE 2nd Ter Deerfield Beach, FL | 3.0 | 2.0 | 1740 | $3,650 | $2.10 | 15d | 1 | 0.99mi |
| 4030 NE 2nd Ter Deerfield Beach, FL | 3.0 | 2.0 | 1740 | $3,650 | $2.10 | 12d | 1 | 0.99mi |
| 4317 Lago Dr Unit 4317 Lighthouse Point, FL | 3.0 | 2.5 | 1830 | $3,750 | $2.05 | 24d | 1 | 1.00mi |
HOA detail
- Monthly dues
- $128 · $1,536/yr
- Likely covers
- poolsecurity
Listing history 18 events
-
2026-06-18days on market $239,500 Active 99 DOM
-
2026-06-17days on market $239,500 Active 98 DOM
-
2026-06-16days on market $239,500 Active 97 DOM
-
2026-06-15days on market $239,500 Active 96 DOM
-
2026-06-13days on market $239,500 Active 94 DOM
-
2026-06-09days on market $239,500 Active 90 DOM
-
2026-06-08days on market $239,500 Active 89 DOM
-
2026-06-07days on market $239,500 Active 88 DOM
-
2026-06-04days on market $239,500 Active 85 DOM
-
2026-06-03days on market $239,500 Active 84 DOM
-
2026-06-02days on market $239,500 Active 83 DOM
-
2026-06-01days on market $239,500 Active 82 DOM
-
2026-05-31days on market $239,500 Active 81 DOM
-
2025-09-09$239,500 Active
-
2021-05-05soldstatus $158,000
-
2013-09-22historical 285-char remark
Show marketing remark (285 chars)
55+ GATED COMM, BEAUTIFULLY DECORATED DOUBLE WIDE MANUFACTURED HM, 3RD BEDRM CONV TO DEN, LAMINATE WOOD FLRS, ROMAN TUB IN MAST BTH, SKYLIGHT & ISLAND IN KITCH, WHIRPOOL APP, MOVE IN CONDITION, MEASUREMNTS APPROX. CALL LISTING AGENT FOR SHOWING INSTRUCTIONS- ARIANA (561) 574-8182
-
2006-07-21soldstatus $155,000
-
2005-11-28$174,900 285-char remark
Show marketing remark (285 chars)
55+ GATED COMM, BEAUTIFULLY DECORATED DOUBLE WIDE MANUFACTURED HM, 3RD BEDRM CONV TO DEN, LAMINATE WOOD FLRS, ROMAN TUB IN MAST BTH, SKYLIGHT & ISLAND IN KITCH, WHIRPOOL APP, MOVE IN CONDITION, MEASUREMNTS APPROX. CALL LISTING AGENT FOR SHOWING INSTRUCTIONS- ARIANA (561) 574-8182
ⓘ Source: listings_history table (triggers on properties + properties_extension) + one-shot
backfill from property_details.listing_events for pre-trigger history.
Tax reassessment forecast FL · Resets to sale price
- Current annual tax
- $4,898 · $408/mo
- Projected year-2 tax
- $4,898 · $408/mo
- Expected delta
- $0/yr ($0/mo · 0.0%)
ⓘ Screening estimate from a state-policy table — verify with the county assessor before closing.
Climate risk First Street
- Flood 1/10 Low FEMA zone X (shaded) · 0% chance over 30 yrs
- Wildfire 1/10 Low
- Heat 9/10 Extreme 7 d/yr ≥107°F today · 23 d/yr by 30 yrs out
- Wind 10/10 Extreme 99% chance of damaging wind over 30 yrs
- Air quality 2/10 Low 1 unhealthy d/yr today · 3 by 30 yrs out
Nearby sold comps map
Loading sold comps map…
Walkable amenities ~0.75 mi
Loading nearby amenities…
Taxation est. · year 1
- Rental income
- $31,974
- − Mortgage interest
- −$13,416
- − Property taxes
- −$4,898
- − Insurance
- −$1,198
- − Repairs & maintenance
- −$2,558
- − Management
- −$2,558
- − HOA
- −$1,536
- − Depreciation
- −$6,967
- Taxable loss
- −$1,157
- Est. tax savings @ 24.0%
- +$278
- After-tax cash flow
- $2,834/yr
For passive investors: Depreciation is non-cash, so a rental often shows a tax loss while cash-flowing — sheltering income. Rental losses are passive: they offset passive income freely, and up to $25,000/yr can offset ordinary (W-2) income if you actively participate and your MAGI is under $100k (phasing out to $0 by $150k); unused losses carry forward. On sale, claimed depreciation is recaptured at up to 25%, and gains may owe capital-gains tax (a 1031 exchange can defer both). Figures are a year-1 estimate at your 24.0% rate — not tax advice; consult a CPA.
Schools (NCES district)
- District
- Broward
- NCES district ID
- 1200180
- Math proficiency
- 42% ▼ -18.00%
- Reading proficiency
- 53% ▼ -5.00%
- Median HH income
- $52,139
- Composite
- 40.88/100
- National rank
- #3621
- State rank
- #46 of 73 in FL
Livability — Deerfield Beach
- Score
- 75/100
- State rank
- #250
- US rank
- #3970
Category grades
Schools grade is shown separately in the Schools card above.
Census & demographics
- Census place
- Deerfield Beach, FL
- County
- Broward County · 1,963,430 people
- City population
- 61,449
- Metro
- Miami-Fort Lauderdale-Pompano Beach, FL
- Population (ZIP)
- 64,563
- Household income
- $71,301
- Rent vs Own
- Severe rent burden
- 2907.0
Population outlook (Broward County) Hauer SSP2
- Today (2025)
- 2,207,033 people
- By 2030
- 2,360,704 · +7.0%
- By 2040
- 2,661,208 · +20.6%
- By 2050
- 2,946,698 · +33.5%
- By 2075
- 3,602,273 · +63.2%
- By 2100
- 3,970,984 · +79.9%
Race, ethnicity, and origin ACS 2023
- Neighborhood character
- Highly diverse neighborhood (Simpson 0.75)
- Race & ethnicity
- White 34% Hispanic / Latino 27% Black 25% Two or more races 24% Asian 2%
- Hispanic origin (detail)
- Mexican 4% Puerto Rican 4% Cuban 4% Dominican 2%
- Common ancestry
- Hispanic 13% Estonian 10% Romanian 1%
- Foreign-born
- 43% · Canada, Jamaica, Dominican Republic
- Languages at home
- 45% English-only · Spanish 23% French/Haitian/Cajun 16% Other Indo-European 13%
Political lean MEDSL · Broward
- 2024 margin
- D (+17.0) · D 58.0% · R 41.0%
- 2008→2024 swing
- -17.8pp toward R · 2008: 34.7pp · 2024: 17.0pp
- All cycles
- 2024: D+17.0 2020: D+29.8 2016: D+35.0 2012: D+34.9 2008: D+34.7
Not yet ingested
- Civics
- —
Market trends
- HPI YoY
- ▼ -109.09%
- Current HPI
- 474.7007
- Rent YoY
- ▲ 1.75%
- Metro
- Miami-Fort Lauderdale-Pompano Beach, FL
- State GDP YoY
- ▲ 3.28%
- F500 in state
- 36
Industry mix (Fortune 500 HQ in FL)
| Industry | F500 HQs | Revenue |
|---|---|---|
| Industrial Technology | 2 | $29B |
|
||
| Insurance | 2 | $17B |
|
||
| Retail | 1 | $60B |
|
||
| Technology Distribution | 1 | $58B |
|
||
| Homebuilding | 1 | $35B |
|
||
| Technology Manufacturing | 1 | $35B |
|
||
Price history
+36.9% since first listed5 events — show timeline
- 2025-09-09 Listed $239,500 Beaches MLS
- 2021-05-05 Sold (Public Records) $158,000 Public Records
- 2013-09-22 Listing Removed — Beaches MLS
- 2006-07-21 Sold (Public Records) $155,000 Public Records
- 2005-11-28 Listed $174,900 Beaches MLS
Property tax history
+7.1%/yrLatest (2025): $4,898 · +11.9% YoY. Source: county tax records.
Cash-flow waterfall
monthlySold comps — $/sqft
last 12 mo · ≤1 miLoading sold comps…