 Multi-family
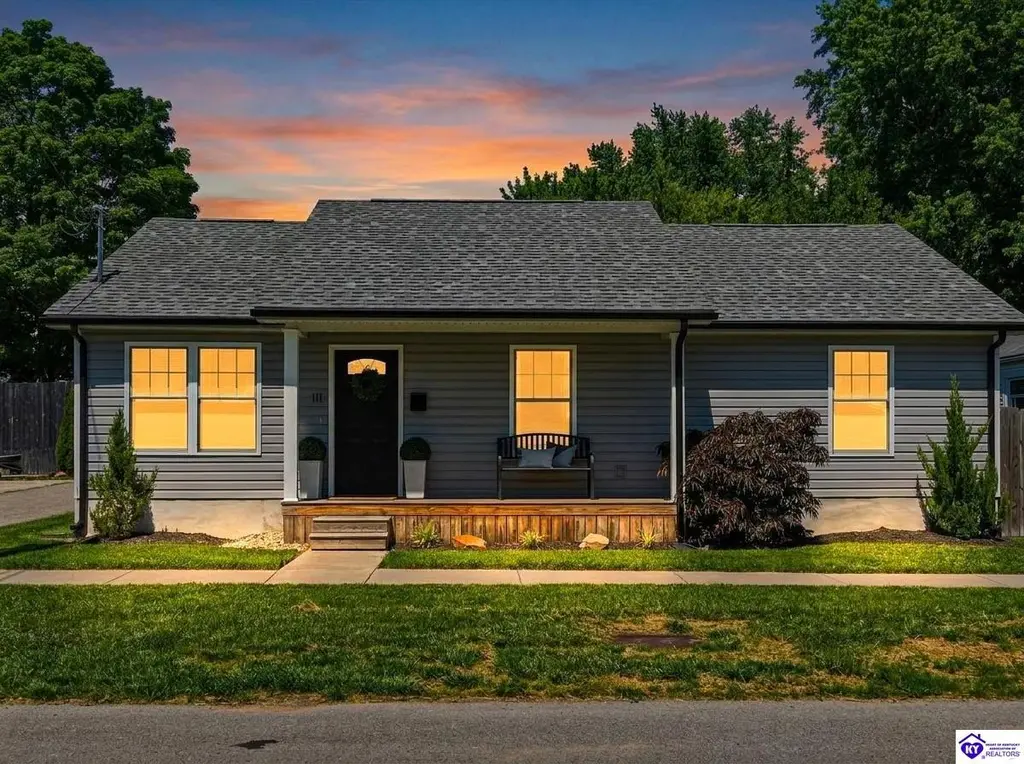
111 E Brown St · Elizabethtown, KY
Flood risk 1/10 · Minimal
- FEMA flood zone
- X (unshaded)
- Chance of flooding over 30 yrs
- 0.0%
- Est. flood insurance / yr
- $507 – $1,088
Fire risk 3/10 · Minor
- Est. fire insurance / yr
- $839 – $1,559
Heat risk 5/10 · Moderate
- Hot days now (above 104°F)
- 7 days/yr
- Hot days in 30 yrs
- 20 days/yr
Wind risk 2/10 · Minimal
- Chance of severe wind over 30 yrs
- 2.0%
Air-quality risk 1/10 · Minimal
- Unhealthy air days now
- 0 days/yr
- Unhealthy air days in 30 yrs
- 0 days/yr
Risk factors via First Street. Map © Google.
Why this score? — see what drove the D+ grade
The composite is a weighted blend of 9 inputs, each scored 0–100. Each bar is that input's sub-score; the figure is the points it added to the 100-point composite (weight × sub-score).
- Cash flow +19.2/30.0
- ARV discount +7.5/15.0
- DSCR +6.0/10.0
- 1% rule +4.8/10.0
- Livability +3.6/5.0
- Rent growth +3.3/5.0
- Schools +2.9/10.0
- Condition / age +2.5/5.0
- Appreciation +0.0/10.0
$264,000
🖨 Deal sheet (PDF) 📄 Offer letter ✓ Due diligence
Multi-family units
County records classify this as Multi-Family (2-4 Unit). Listing-text estimate: 1 unit. estimate disagrees with records
Listing remarks MLS
Old duplex that was on the lot was torn down to build new house in its place. New house is Industrial Chic with stained concrete floors. Open floor plan with walk in pantry. Good sized bedrooms. Granite counters throughout. Cabinets haves of close doors and drawers. Tile back splashes. On demand hot water with whole house 2 stage water filtration. High efficiency HVAC. Brand new higher end stainless steel appliances. Some of the 100 year old bricks on the property were used by the back door for a small stoop. Most of the homes in the street were renovated or new construction. House across the street is still in process of renovation. With downtown renovation this is a very desirable location. Can walk to downtown shops, restaurants and bars.
Key facts
- Covered back patio
- 3,485 sq ft lot
- Built 2022
Tags
Property features AI
Exterior
- Parking: Concrete parking
- Security: Smoke detector(s)
- Utilities: Public water; Public sewer
- Home design: Residential single-family home
- Construction: Vinyl siding; Shingle roof; Slab foundation; Built as single family residence
- Exterior features: Covered porch/patio; Corner lot
Interior
- Kitchen: Dishwasher; Microwave; Range; Oven; Refrigerator
- Flooring: Concrete flooring
- Bathrooms: 2 full bathrooms; 2 bathrooms on the main level
- Heating & cooling: Central heating (electric); Central air conditioning; Ceiling fan(s)
- Interior features: Walk-in closet(s); Eat-in kitchen; Cathedral ceiling(s); Pantry
- Laundry & utility: Electric water heater
Neighborhood map
What this means for you Summary
Snapshot
- This is a 2-bed/2.0-bath multifamily listed at $264k.
Deal economics
- At list price, monthly cash flow is $284 ($3k/yr) — positive.
- The deal already cash-flows at list — no discount required.
- To meet the 1% rule (rent ≥ 1% of price), the offer needs to be $257k (2.5% below list).
- Recommended offer: $256k (3.0% below list) — sets the bar for market timing.
- Cap rate 7.6% vs local median 3.5% in Elizabethtown — top-decile yield for the area; either an underpriced asset or a hidden risk that comps aren't pricing in. Stress-test before assuming the spread holds.
Location & tenants
- Location reads 72/100 on livability (#131 in KY) — a middle-class / working-renter tenant base. Strengths: crime A+, cost of living A+, housing A; Watch: employment D, amenities F, commute F.
- Elizabethtown Independent (urban): math 26% / reading 45% proficiency, ranked #66 of 165 in KY (top 40%) — families likely to look elsewhere, expect single-tenant / working-renter base with shorter leases.
- Zoned schools: Morningside Elementary School (math 21% / reading 38%, grade F, #393 of 676 statewide, top 63%, 452 students, 50% FRL); Talton K Stone Middle School (math 26% / reading 51%, grade F, #68 of 217 statewide, top 32%, 545 students, 42% FRL); Elizabethtown High School (math 35% / reading 45%, grade F, #39 of 254 statewide, top 15%, 824 students, 36% FRL) — zoned schools at 43% FRL track the district average.
- Market conditions: Rents rising (+3.3%/yr); 542 active listings in the ZIP; 2 comparable units currently listed for rent nearby; 946 units permitted in Hardin County in 2024 (464 in 5+ unit buildings).
- This rent runs 44% of the median local income ($70k/yr) — at the standard rent-burdened threshold; future hikes will face affordability resistance.
Forward outlook
- Local home prices are declining (-3.0%/yr); year-one equity from $2k of loan paydown is wiped out by about $8k of value loss. Plan a longer hold.
- Hardin County population projected at -16% by 2050 — secular population decline; favor cash flow + early exit over multi-decade hold.
Negotiation context
- It's been on market 37 days — a 3% lower offer ($256k) is reasonable based on typical stale-listing flexibility.
- 2 sale attempts since 3y ago with the ask held roughly flat each time — persistent listings suggest the price (not the market) is what's stuck; bring a comps-based counter.
Risks & watch-outs
- Climate carrying-cost: extreme-heat days projected 7→20/yr by 2055 (HVAC capex compounding) — expect insurance premiums to compound above CPI over the hold.
Questions for the listing agent
- It's been on market 37 days. Have you received any prior offers? Is the seller open to a 3% concession, seller financing, or rate buy-down credit?
- Is there a deadline driving the sale (1031 exchange, divorce, estate, relocation)? That informs how much negotiation room exists.
- The area grade is low — what's the realistic commute time and amenity access for the typical tenant pool here? Any planned neighborhood developments (good or bad) we should know about?
- What's the average days-on-market for RENTAL listings here right now (not sales)? A rising rental-DOM trend means longer vacancies and softer asking-rent achievability than the comps imply.
- What's the recent tenant-quality profile in this submarket — average credit score on applications, eviction rate, late-payment / NSF rate, and stable-employment percentage? A property-management company in the area should have these aggregated.
- How much new apartment / multifamily construction is in the pipeline within 1–3 miles? Heavy new supply (>2% of stock underway) typically softens rents 12–24 months out; light construction supports rent growth.
Investment metrics
- 1% rule
- 0.97% ✗
- Cap rate
- 7.58%
- Cash-on-cash
- 4.60%
- DSCR
- 1.20
- GRM
- 8.5
CMA / ARV
No comps found within radius.
Projected returns pro-forma
-3.0% appreciation · 3.32% rent growth · sell at horizon
- IRR
- -8.8%
- Equity multiple
- 0.68×
- Total profit
- $-23,895
- Equity at exit
- $39,363
- IRR
- 1.1%
- Equity multiple
- 1.08×
- Total profit
- $5,853
- Equity at exit
- $22,826
Cash invested: $73,920 (down + closing). Projections, not guarantees.
Landlord ↔ Tenant lean methodology
- Overall (STATE)
- 83 Strongly Landlord-Friendly
- State Kentucky
- 83 Strongly Landlord-Friendly · R+16
- County
- — inherits STATE
- City
- — inherits STATE
ZIP-level market 42701
- Home prices YoY
- -29.8%
- Rents YoY
- 3.3%
- Active inventory
- 542
- Price-to-rent
- 17.1×
Monthly cashflow live
- Estimated rent
- $2,574 medium interval (Pro) →
- Mortgage (P&I)
- −$1,384
- Tax from tax record
- −$255 /mo · $3,066/yr
- Insurance
- −$110
- HOA
- −$0
- Vacancy / Maint / Mgmt
- −$541
- Net cashflow
- $284
Break-even live
Sensitivity live
| Price | -10% $433 | -5% $358 | +0% $284 | +5% $209 | +10% $134 |
|---|---|---|---|---|---|
| Rent | -10% $80 | -5% $182 | +0% $284 | +5% $385 | +10% $487 |
| Rate | -1.0pp $417 | -0.5pp $351 | base $284 | +0.5pp $215 | +1.0pp $146 |
2-unit breakdown (identical units grouped — click to expand)
| Units | Beds | Baths | Est. rent |
|---|---|---|---|
| 2× units | 3 | 2 | $2,574 |
| #1 | 3 | 2 | $1,287 |
| #2 | 3 | 2 | $1,287 |
| Total (2 units) | $2,574 | ||
UW: 25.0% down · 7.5% · 30yr · 1.5% tax · 5.0% vac · 8.0% maint · 8.0% mgmt
Financing live
Cash to close
- Down payment
- $66,000
- Closing costs
- $7,920
- Reserves months
- —
- Total cash needed
- —
Loan-product check · same deal, 3 products live
Conventional
25% down · 7.5% · 30yr
- Down + closing
- —
- Monthly P&I
- —
- Monthly cashflow
- —
- DSCR
- —
- Eligible?
- —
Personal DTI + credit; lowest rate.
DSCR
20% down · 8.5% · 30yr
- Down + closing
- —
- Monthly P&I
- —
- Monthly cashflow
- —
- DSCR
- —
- Eligible?
- —
No personal income docs; deal must DSCR.
Hard money
10% down · 12.0% · 12mo
- Down + closing
- —
- Monthly P&I
- —
- Monthly cashflow
- —
- DSCR
- —
- Eligible?
- —
Short-term bridge; refi at stabilization.
Rent comps 2 comps
| Address | Beds | Baths | Sqft | Rent | $/sqft | DOM | Units | Dist |
|---|---|---|---|---|---|---|---|---|
| 900 David Ct Elizabethtown, KY | 1.0–2.0 | 1.0–1.5 | 780 | $985 | $1.26 | 45d | 15 | 1.27mi |
| 206 Cole Gray Blvd Elizabethtown, KY | 2.0–3.0 | 1.5–2.5 | 1730 | $1,399 | $0.81 | 4d | 1 | 1.29mi |
Listing history 24 events
-
2026-06-21days on market $264,000 Active 37 DOM
-
2026-06-19days on market $264,000 Active 35 DOM
-
2026-06-18days on market $264,000 Active 34 DOM
-
2026-06-17days on market $264,000 Active 33 DOM
-
2026-06-16days on market $264,000 Active 32 DOM
-
2026-06-15days on market $264,000 Active 31 DOM
-
2026-06-14days on market $264,000 Active 29 DOM
-
2026-06-13days on market $264,000 Active 28 DOM
-
2026-06-10days on market $264,000 Active 26 DOM
-
2026-06-09days on market $264,000 Active 25 DOM
-
2026-06-08days on market $264,000 Active 24 DOM
-
2026-06-07days on market $264,000 Active 23 DOM
-
2026-06-05pricedays on market $264,000 Active 20 DOM
-
2026-06-02days on market $269,500 Active 18 DOM
-
2026-06-01days on market $269,500 Active 17 DOM
-
2026-05-31days on market $269,500 Active 16 DOM
-
2026-05-30days on market $269,500 Active 15 DOM
-
2026-05-15$269,500 Active
-
2023-05-30soldstatus $245,900 Closed 751-char remark
Show marketing remark (751 chars)
Old duplex that was on the lot was torn down to build new house in its place. New house is Industrial Chic with stained concrete floors. Open floor plan with walk in pantry. Good sized bedrooms. Granite counters throughout. Cabinets haves of close doors and drawers. Tile back splashes. On demand hot water with whole house 2 stage water filtration. High efficiency HVAC. Brand new higher end stainless steel appliances. Some of the 100 year old bricks on the property were used by the back door for a small stoop. Most of the homes in the street were renovated or new construction. House across the street is still in process of renovation. With downtown renovation this is a very desirable location. Can walk to downtown shops, restaurants and bars.
-
2023-05-19status Pending 751-char remark
Show marketing remark (751 chars)
Old duplex that was on the lot was torn down to build new house in its place. New house is Industrial Chic with stained concrete floors. Open floor plan with walk in pantry. Good sized bedrooms. Granite counters throughout. Cabinets haves of close doors and drawers. Tile back splashes. On demand hot water with whole house 2 stage water filtration. High efficiency HVAC. Brand new higher end stainless steel appliances. Some of the 100 year old bricks on the property were used by the back door for a small stoop. Most of the homes in the street were renovated or new construction. House across the street is still in process of renovation. With downtown renovation this is a very desirable location. Can walk to downtown shops, restaurants and bars.
-
2023-05-18$245,900 Active 751-char remark
Show marketing remark (751 chars)
Old duplex that was on the lot was torn down to build new house in its place. New house is Industrial Chic with stained concrete floors. Open floor plan with walk in pantry. Good sized bedrooms. Granite counters throughout. Cabinets haves of close doors and drawers. Tile back splashes. On demand hot water with whole house 2 stage water filtration. High efficiency HVAC. Brand new higher end stainless steel appliances. Some of the 100 year old bricks on the property were used by the back door for a small stoop. Most of the homes in the street were renovated or new construction. House across the street is still in process of renovation. With downtown renovation this is a very desirable location. Can walk to downtown shops, restaurants and bars.
-
2021-03-12soldstatus $75,000
-
2021-03-12soldstatus $70,000
-
2014-04-30soldstatus $70,000
ⓘ Source: listings_history table (triggers on properties + properties_extension) + one-shot
backfill from property_details.listing_events for pre-trigger history.
Tax reassessment forecast KY · Resets to sale price
- Current annual tax
- $3,066 · $255/mo
- Projected year-2 tax
- $3,066 · $255/mo
- Expected delta
- $0/yr ($0/mo · 0.0%)
ⓘ Screening estimate from a state-policy table — verify with the county assessor before closing.
Climate risk First Street
- Flood 1/10 Low FEMA zone X (unshaded) · 0% chance over 30 yrs
- Wildfire 3/10 Moderate
- Heat 5/10 Major 7 d/yr ≥104°F today · 20 d/yr by 30 yrs out
- Wind 2/10 Low 2% chance of damaging wind over 30 yrs
- Air quality 1/10 Low 0 unhealthy d/yr today · 0 by 30 yrs out
Nearby sold comps map
Loading sold comps map…
Walkable amenities ~0.75 mi
Loading nearby amenities…
Taxation est. · year 1
- Rental income
- $30,888
- − Mortgage interest
- −$14,788
- − Property taxes
- −$3,066
- − Insurance
- −$1,320
- − Repairs & maintenance
- −$2,471
- − Management
- −$2,471
- − Depreciation
- −$7,680
- Taxable loss
- −$908
- Est. tax savings @ 24.0%
- +$218
- After-tax cash flow
- $3,620/yr
For passive investors: Depreciation is non-cash, so a rental often shows a tax loss while cash-flowing — sheltering income. Rental losses are passive: they offset passive income freely, and up to $25,000/yr can offset ordinary (W-2) income if you actively participate and your MAGI is under $100k (phasing out to $0 by $150k); unused losses carry forward. On sale, claimed depreciation is recaptured at up to 25%, and gains may owe capital-gains tax (a 1031 exchange can defer both). Figures are a year-1 estimate at your 24.0% rate — not tax advice; consult a CPA.
Schools (NCES district)
- District
- Elizabethtown Independent
- NCES district ID
- 2101650
- Math proficiency
- 26% ▼ -25.00%
- Reading proficiency
- 45% ▼ -17.00%
- Median HH income
- $36,400
- Composite
- 29.39/100
- National rank
- #6526
- State rank
- #66 of 165 in KY
Livability — Elizabethtown
- Score
- 72/100
- State rank
- #131
- US rank
- #6198
Category grades
Schools grade is shown separately in the Schools card above.
Census & demographics
- Census place
- Elizabethtown, KY
- County
- Hardin County · 77,611 people
- City population
- 53,987
- Metro
- Elizabethtown-Fort Knox, KY
- Population (ZIP)
- 53,987
- Household income
- $69,619
- Rent vs Own
- Severe rent burden
- 1663.0
Population outlook (Hardin County) Hauer SSP2
- Today (2025)
- 105,573 people
- By 2030
- 103,563 · -1.9%
- By 2040
- 97,077 · -8.0%
- By 2050
- 88,367 · -16.3%
- By 2075
- 65,405 · -38.0%
- By 2100
- 42,245 · -60.0%
Race, ethnicity, and origin ACS 2023
- Neighborhood character
- Predominantly White (79%)
- Race & ethnicity
- White 79% Black 9% Two or more races 6% Hispanic / Latino 5% Asian 2%
- Hispanic origin (detail)
- Mexican 3% Puerto Rican 1%
- Common ancestry
- Italian 3% Slovak 2% Romanian 2%
- Foreign-born
- 4% · Canada, South Korea
- Languages at home
- 94% English-only · Spanish 3% German/W. Germanic 1% Other Indo-European 1%
Political lean MEDSL · Hardin
- 2024 margin
- Strong R (+29.3) · D 34.5% · R 63.8% · Other 1.7%
- 2008→2024 swing
- -8.7pp toward R · 2008: -20.6pp · 2024: -29.3pp
- All cycles
- 2024: R+29.3 2020: R+24.0 2016: R+30.2 2012: R+20.8 2008: R+20.6
Not yet ingested
- Civics
- —
Market trends
- HPI YoY
- ▼ -96.94%
- Current HPI
- 228.7091
- Rent YoY
- ▲ 3.32%
- Metro
- Elizabethtown-Fort Knox, KY
- State GDP YoY
- ▲ 1.81%
- F500 in state
- 4
Industry mix (Fortune 500 HQ in KY)
| Industry | F500 HQs | Revenue |
|---|---|---|
| Healthcare | 1 | $118B |
|
||
| Food / Beverage | 1 | $7B |
|
||
Price history
+285.0% since first listed7 events — show timeline
- 2026-05-15 Listed $269,500 HKARMLS
- 2023-05-30 Sold (MLS) $245,900 HKARMLS
- 2023-05-19 Pending — HKARMLS
- 2023-05-18 Listed $245,900 HKARMLS
- 2021-03-12 Sold (Public Records) $70,000 Public Records
- 2021-03-12 Sold (Public Records) $75,000 Public Records
- 2014-04-30 Sold (Public Records) $70,000 Public Records
Property tax history
+18.7%/yrLatest (2025): $3,066 · +0.8% YoY. Source: county tax records.
Cash-flow waterfall
monthlySold comps — $/sqft
last 12 mo · ≤1 miLoading sold comps…