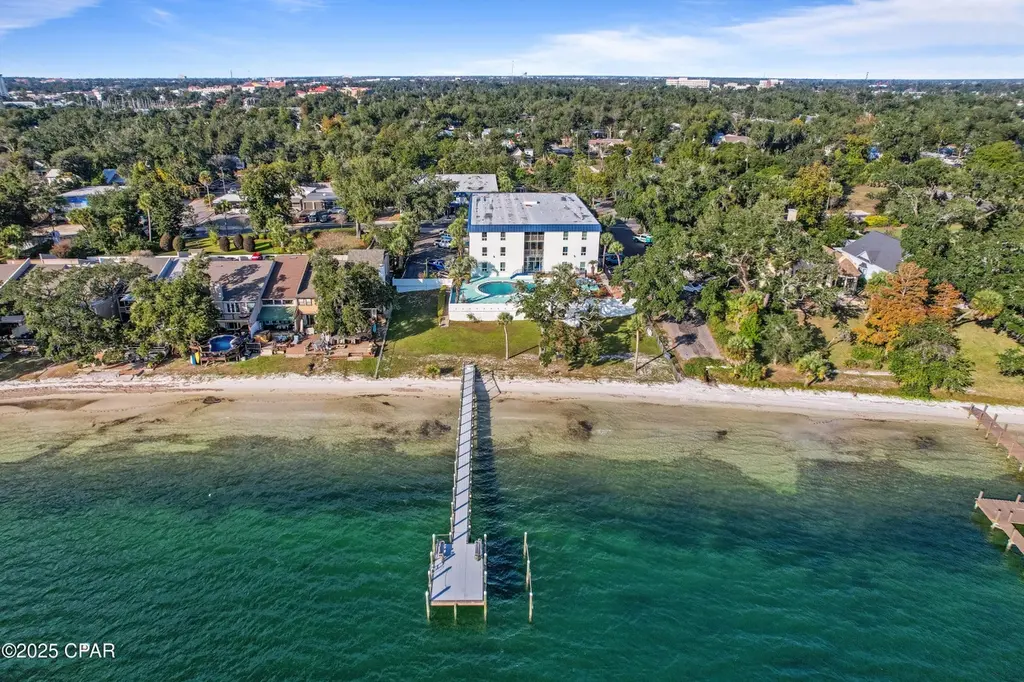
105 Allen Ave #61 · Panama City, FL
Flood risk 1/10 · Minimal
- FEMA flood zone
- X (unshaded)
- Chance of flooding over 30 yrs
- 0.0%
- Est. flood insurance / yr
- $507 – $1,088
Fire risk 3/10 · Minor
- Est. fire insurance / yr
- $947 – $1,759
Heat risk 10/10 · Severe
- Hot days now (above 105°F)
- 6 days/yr
- Hot days in 30 yrs
- 17 days/yr
Wind risk 10/10 · Severe
- Chance of severe wind over 30 yrs
- 99.0%
Air-quality risk 2/10 · Minimal
- Unhealthy air days now
- 0 days/yr
- Unhealthy air days in 30 yrs
- 1 days/yr
Risk factors via First Street. Map © Google.
Why this score? — see what drove the B- grade
The composite is a weighted blend of 9 inputs, each scored 0–100. Each bar is that input's sub-score; the figure is the points it added to the 100-point composite (weight × sub-score).
- Cash flow +24.8/30.0
- ARV discount +15.0/15.0
- DSCR +8.0/10.0
- 1% rule +6.4/10.0
- Schools +4.3/10.0
- Livability +3.6/5.0
- Rent growth +2.6/5.0
- Condition / age +2.5/5.0
- Appreciation +0.0/10.0
$150,000
🖨 Deal sheet (PDF) 📄 Offer letter ✓ Due diligence
Listing remarks MLS
A beautiful 2 bedroom & 2 bathroom condo at the perfect location in the highly sought after Cove Neighborhood. This unit is on the second floor which is also the top floor, meaning you don't need to worry about loud neighbors above you. Stairs only, no elevator. The living room is large with a spacious balcony. The master bedroom has an ensuite bathroom as well as the stackable laundry. The second bedroom is also well sized right next to the guest bathroom. Enjoy the private pool overlooking the bay, the beach for relaxing bay breeze sunsets or fishing on the Bay. All of this and you're a short walk from Downtown Panama City where there are restaurants, events, and farmers market. HOA fees cover all utilities except power and also includes insurance on the building and exterior repairs.
Key facts
- Second floor
- Overlooking the bay
- Private pool
Tags
Neighborhood map
What this means for you Summary
Snapshot
- This is a 2-bed/2.0-bath condo listed at $150k.
Deal economics
- At list price, monthly cash flow is $316 ($4k/yr) — positive.
- The deal already cash-flows at list — no discount required.
- Meets the 1% rule at list price ($2k rent vs $150k).
- Recommended offer: $132k (12.0% below list) — sets the bar for market timing.
- Cap rate 8.8% vs local median 4.7% in Panama City — top-decile yield for the area; either an underpriced asset or a hidden risk that comps aren't pricing in. Stress-test before assuming the spread holds.
Location & tenants
- Location reads 72/100 on livability (#350 in FL) — a middle-class / working-renter tenant base. Strengths: cost of living A+, housing A+, health & safety A+; Watch: crime F, amenities F, commute F.
- Bay (suburban): math 51% / reading 51% proficiency, ranked #29 of 73 in FL (top 40%) — acceptable for families but not a draw, mixed tenant base, ~2y average lease.
- Zoned schools: Merriam Cherry Street Elementary (math 22% / reading 37%, grade F, #1,896 of 2,144 statewide, top 90%, 362 students, 72% FRL); Jinks Middle School (math 41% / reading 42%, grade F, #348 of 571 statewide, top 62%, 570 students, 70% FRL); Bay High School (math 37% / reading 34%, grade F, #367 of 667 statewide, top 57%, 1,255 students, 53% FRL) — zoned schools average 65% FRL vs 48% district-wide (17 pts higher); higher-poverty schools than district average — tighter screening recommended.
- Zoned-school proficiency averages 36% at this address vs 51% district-wide (-16 pts) — the specific schools serving this property underperform the Bay average; the district grade overstates school quality for this exact location.
- Market conditions: Rents flat; 262 active listings in the ZIP; 8 comparable units currently listed for rent nearby; rentals at typical pace (median 23d on market — plan ~3-4 weeks tenant-placement turnaround); 2,473 units permitted in Bay County in 2024 (559 in 5+ unit buildings).
- This rent runs 39% of the median local income ($53k/yr) — at the standard rent-burdened threshold; future hikes will face affordability resistance.
Forward outlook
- Local home prices are declining (-3.0%/yr); year-one equity from $1k of loan paydown is wiped out by about $4k of value loss. Plan a longer hold.
- Bay County population projected at +24% by 2050 — long-run rental-demand tailwind backs the buy-and-hold thesis.
Negotiation context
- It's been on market 202 days — a 12% lower offer ($132k) is reasonable based on typical stale-listing flexibility.
- 3 sale attempts since 2y ago; this cycle's ask has dropped $20k (12%) from the opening price — seller is motivated, your offer sets the floor, not the list.
Risks & watch-outs
- Climate carrying-cost: severe wind risk, 99% chance of damaging wind over 30y; extreme-heat days projected 6→17/yr by 2055 (HVAC capex compounding) — expect insurance premiums to compound above CPI over the hold.
Questions for the listing agent
- It's been on market 202 days. Have you received any prior offers? Is the seller open to a 12% concession, seller financing, or rate buy-down credit?
- Any open or pending special assessments — roof, HVAC, plumbing, elevator, façade? What's the per-unit balance and payoff schedule, and is the seller paying it off at close or rolling it to the buyer?
- Why hasn't it sold? Are there any deal-killer items the seller is aware of (foundation, flood, title, zoning, code violations)?
- Is there a deadline driving the sale (1031 exchange, divorce, estate, relocation)? That informs how much negotiation room exists.
- Schools are B-rated — typically a magnet for longer-tenancy family renters. What's the average tenant stay here, and is there a school-zone premium baked into asking?
- Crime grade is F in this area — have there been break-ins, vandalism, or insurance claims at this property in the last 3 years? What carrier currently insures it and at what premium?
- What's the average days-on-market for RENTAL listings here right now (not sales)? A rising rental-DOM trend means longer vacancies and softer asking-rent achievability than the comps imply.
- What's the recent tenant-quality profile in this submarket — average credit score on applications, eviction rate, late-payment / NSF rate, and stable-employment percentage? A property-management company in the area should have these aggregated.
- How much new apartment / multifamily construction is in the pipeline within 1–3 miles? Heavy new supply (>2% of stock underway) typically softens rents 12–24 months out; light construction supports rent growth.
Investment metrics
- 1% rule
- 1.14% ✓
- Cap rate
- 8.82%
- Cash-on-cash
- 9.02%
- DSCR
- 1.40
- GRM
- 7.3
CMA / ARV
- ARV (median comp)
- $220,562
- List price
- $150,000
- Delta
- -31.99%
- Verdict
- UNDERPRICED
- Comps
- 20 within 1.0 mi
Projected returns pro-forma
-3.0% appreciation · 0.45% rent growth · sell at horizon
- IRR
- -5.5%
- Equity multiple
- 0.80×
- Total profit
- $-8,441
- Equity at exit
- $22,365
- IRR
- 0.8%
- Equity multiple
- 1.05×
- Total profit
- $2,004
- Equity at exit
- $12,969
Cash invested: $42,000 (down + closing). Projections, not guarantees.
Landlord ↔ Tenant lean methodology
- Overall (STATE)
- 87 Strongly Landlord-Friendly
- State Florida
- 87 Strongly Landlord-Friendly · R+3
- County
- — inherits STATE
- City
- — inherits STATE
ZIP-level market 32401
- Home prices YoY
- -32.9%
- Rents YoY
- 0.5%
- Active inventory
- 262
- Price-to-rent
- 7.3×
Monthly cashflow live
- Estimated rent
- $1,704 high interval (Pro) →
- Mortgage (P&I)
- −$787
- Tax from tax record
- −$181 /mo · $2,177/yr
- Insurance
- −$62
- HOA
- −$0
- Vacancy / Maint / Mgmt
- −$358
- Net cashflow
- $316
Break-even live
Sensitivity live
| Price | -10% $401 | -5% $358 | +0% $316 | +5% $273 | +10% $231 |
|---|---|---|---|---|---|
| Rent | -10% $181 | -5% $248 | +0% $316 | +5% $383 | +10% $450 |
| Rate | -1.0pp $391 | -0.5pp $354 | base $316 | +0.5pp $277 | +1.0pp $237 |
UW: 25.0% down · 7.5% · 30yr · 1.5% tax · 5.0% vac · 8.0% maint · 8.0% mgmt
Financing live
Cash to close
- Down payment
- $37,500
- Closing costs
- $4,500
- Reserves months
- —
- Total cash needed
- —
Loan-product check · same deal, 3 products live
Conventional
25% down · 7.5% · 30yr
- Down + closing
- —
- Monthly P&I
- —
- Monthly cashflow
- —
- DSCR
- —
- Eligible?
- —
Personal DTI + credit; lowest rate.
DSCR
20% down · 8.5% · 30yr
- Down + closing
- —
- Monthly P&I
- —
- Monthly cashflow
- —
- DSCR
- —
- Eligible?
- —
No personal income docs; deal must DSCR.
Hard money
10% down · 12.0% · 12mo
- Down + closing
- —
- Monthly P&I
- —
- Monthly cashflow
- —
- DSCR
- —
- Eligible?
- —
Short-term bridge; refi at stabilization.
Rent comps 8 comps
| Address | Beds | Baths | Sqft | Rent | $/sqft | DOM | Units | Dist |
|---|---|---|---|---|---|---|---|---|
| 316 Cherry St #24 Panama City, FL | 2.0 | 2.0 | 860 | $1,800 | $2.09 | 15d | 1 | 0.03mi |
| 603 E 2nd St Panama City, FL | 2.0 | 1.0 | 900 | $1,300 | $1.44 | 22d | 1 | 0.22mi |
| 335 Massalina Dr Panama City, FL | 1.0 | 1.0 | 742 | $1,200 | $1.62 | 15d | 1 | 0.49mi |
| 388 Massalina Dr Panama City, FL | 2.0 | 2.0 | 800 | $1,800 | $2.25 | 15d | 1 | 0.62mi |
| 329 N Palo Alto Ave Panama City, FL | 3.0 | 2.0 | 1300 | $1,950 | $1.50 | 15d | 1 | 0.63mi |
| 329 N Palo Alto Ave Unit B Panama City, FL | 1.0 | 1.0 | 800 | $750 | $0.94 | 22d | 1 | 0.63mi |
| 300 Mercedes Ave Unit 1523335P Panama City, FL | 3.0 | 2.0 | 1194 | $3,807 | $3.19 | 22d | 1 | 0.66mi |
| 540 E 4th Ct Panama City, FL | 2.0 | 2.0 | 1196 | $1,800 | $1.51 | 22d | 1 | 0.69mi |
HOA detail condo
- Monthly dues
- $0 · $0/yr
- Likely covers
- exterior maint.pool
- Assessments
- None detected in remarks — confirm with the listing agent.
Listing history 25 events
-
2026-06-21days on market $150,000 Active 202 DOM
-
2026-06-19days on market $150,000 Active 200 DOM
-
2026-06-18days on market $150,000 Active 199 DOM
-
2026-06-17days on market $150,000 Active 198 DOM
-
2026-06-16pricedays on market $150,000 Active 197 DOM
-
2026-06-15days on market $160,000 Active 196 DOM
-
2026-06-14days on market $160,000 Active 194 DOM
-
2026-06-13days on market $160,000 Active 193 DOM
-
2026-06-10days on market $160,000 Active 191 DOM
-
2026-06-09days on market $160,000 Active 190 DOM
-
2026-06-08days on market $160,000 Active 189 DOM
-
2026-06-07days on market $160,000 Active 188 DOM
-
2026-06-05days on market $160,000 Active 185 DOM
-
2026-06-03days on market $160,000 Active 184 DOM
-
2026-06-02days on market $160,000 Active 183 DOM
-
2026-06-01days on market $160,000 Active 182 DOM
-
2026-05-31days on market $160,000 Active 181 DOM
-
2026-05-30days on market $160,000 Active 180 DOM
-
2026-01-13price $160,000 803-char remark
Show marketing remark (803 chars)
A beautiful 2 bedroom & 2 bathroom condo at the perfect location in the highly sought after Cove Neighborhood. This unit is on the second floor which is also the top floor, meaning you don't need to worry about loud neighbors above you. Stairs only, no elevator. The living room is large with a spacious balcony. The master bedroom has an ensuite bathroom as well as the stackable laundry. The second bedroom is also well sized right next to the guest bathroom. Enjoy the private pool overlooking the bay, the beach for relaxing bay breeze sunsets or fishing on the Bay. All of this and you're a short walk from Downtown Panama City where there are restaurants, events, and farmers market. HOA fees cover all utilities except power and also includes insurance on the building and exterior repairs.
-
2025-12-04historical $1,400
-
2025-11-26$170,000 Active 803-char remark
Show marketing remark (803 chars)
A beautiful 2 bedroom & 2 bathroom condo at the perfect location in the highly sought after Cove Neighborhood. This unit is on the second floor which is also the top floor, meaning you don't need to worry about loud neighbors above you. Stairs only, no elevator. The living room is large with a spacious balcony. The master bedroom has an ensuite bathroom as well as the stackable laundry. The second bedroom is also well sized right next to the guest bathroom. Enjoy the private pool overlooking the bay, the beach for relaxing bay breeze sunsets or fishing on the Bay. All of this and you're a short walk from Downtown Panama City where there are restaurants, events, and farmers market. HOA fees cover all utilities except power and also includes insurance on the building and exterior repairs.
-
2025-08-02$1,400
-
2024-03-20historical $1,250
-
2024-03-13$1,250
-
2022-05-20price $1,250
ⓘ Source: listings_history table (triggers on properties + properties_extension) + one-shot
backfill from property_details.listing_events for pre-trigger history.
Tax reassessment forecast FL · Resets to sale price
- Current annual tax
- $2,177 · $181/mo
- Projected year-2 tax
- $2,177 · $181/mo
- Expected delta
- $0/yr ($0/mo · 0.0%)
ⓘ Screening estimate from a state-policy table — verify with the county assessor before closing.
Climate risk First Street
- Flood 1/10 Low FEMA zone X (unshaded) · 0% chance over 30 yrs
- Wildfire 3/10 Moderate
- Heat 10/10 Extreme 6 d/yr ≥105°F today · 17 d/yr by 30 yrs out
- Wind 10/10 Extreme 99% chance of damaging wind over 30 yrs
- Air quality 2/10 Low 0 unhealthy d/yr today · 1 by 30 yrs out
Nearby sold comps map
Loading sold comps map…
Walkable amenities ~0.75 mi
Loading nearby amenities…
Taxation est. · year 1
- Rental income
- $20,449
- − Mortgage interest
- −$8,402
- − Property taxes
- −$2,177
- − Insurance
- −$750
- − Repairs & maintenance
- −$1,636
- − Management
- −$1,636
- − Depreciation
- −$4,364
- Taxable income
- $1,484
- Est. tax owed @ 24.0%
- −$356
- After-tax cash flow
- $3,432/yr
For passive investors: Depreciation is non-cash, so a rental often shows a tax loss while cash-flowing — sheltering income. Rental losses are passive: they offset passive income freely, and up to $25,000/yr can offset ordinary (W-2) income if you actively participate and your MAGI is under $100k (phasing out to $0 by $150k); unused losses carry forward. On sale, claimed depreciation is recaptured at up to 25%, and gains may owe capital-gains tax (a 1031 exchange can defer both). Figures are a year-1 estimate at your 24.0% rate — not tax advice; consult a CPA.
Schools (NCES district)
- District
- Bay
- NCES district ID
- 1200090
- Math proficiency
- 51% ▼ -8.00%
- Reading proficiency
- 51% ▼ -7.00%
- Median HH income
- $47,740
- Composite
- 43.41/100
- National rank
- #3014
- State rank
- #29 of 73 in FL
Livability — Panama City
- Score
- 72/100
- State rank
- #350
- US rank
- #5823
Category grades
Schools grade is shown separately in the Schools card above.
Census & demographics
- Census place
- Panama City, FL
- County
- Bay County · 163,593 people
- City population
- 91,445
- Metro
- Panama City, FL
- Population (ZIP)
- 18,947
- Household income
- $52,523
- Rent vs Own
- Severe rent burden
- 935.0
Population outlook (Bay County) Hauer SSP2
- Today (2025)
- 206,264 people
- By 2030
- 217,740 · +5.6%
- By 2040
- 238,738 · +15.7%
- By 2050
- 255,545 · +23.9%
- By 2075
- 288,295 · +39.8%
- By 2100
- 288,638 · +39.9%
Race, ethnicity, and origin ACS 2023
- Neighborhood character
- Diverse neighborhood (Simpson 0.57)
- Race & ethnicity
- White 60% Black 23% Hispanic / Latino 11% Two or more races 8% Asian 2%
- Hispanic origin (detail)
- Mexican 5% Puerto Rican 2%
- Common ancestry
- Italian 2% Lithuanian 2% Slovak 2%
- Foreign-born
- 9% · Canada, Vietnam
- Languages at home
- 89% English-only · Spanish 8% Other Indo-European 1% German/W. Germanic 1%
Political lean MEDSL · Bay
- 2024 margin
- Solid R (+47.4) · D 25.8% · R 73.1% · Other 1.1%
- 2008→2024 swing
- -6.6pp toward R · 2008: -40.7pp · 2024: -47.4pp
- All cycles
- 2024: R+47.4 2020: R+43.5 2016: R+46.3 2012: R+43.6 2008: R+40.7
Not yet ingested
- Civics
- —
Market trends
- HPI YoY
- ▼ -142.12%
- Current HPI
- 290.3312
- Rent YoY
- ▲ 0.45%
- Metro
- Panama City, FL
- State GDP YoY
- ▲ 3.28%
- F500 in state
- 36
Industry mix (Fortune 500 HQ in FL)
| Industry | F500 HQs | Revenue |
|---|---|---|
| Industrial Technology | 2 | $29B |
|
||
| Insurance | 2 | $17B |
|
||
| Retail | 1 | $60B |
|
||
| Technology Distribution | 1 | $58B |
|
||
| Homebuilding | 1 | $35B |
|
||
| Technology Manufacturing | 1 | $35B |
|
||
Price history
+12700.0% since first listed7 events — show timeline
- 2026-01-13 Price Changed $160,000 CPARMLS
- 2025-12-04 Rental Removed $1,400 APPFOLIO
- 2025-11-26 Listed $170,000 CPARMLS
- 2025-08-02 Listed for Rent $1,400 APPFOLIO
- 2024-03-20 Rental Removed $1,250 APPFOLIO
- 2024-03-13 Listed for Rent $1,250 APPFOLIO
- 2022-05-20 Price Changed $1,250 APPFOLIO
Property tax history
+5.1%/yrLatest (2025): $2,177 · -0.7% YoY. Source: county tax records.
Cash-flow waterfall
monthlySold comps — $/sqft
last 12 mo · ≤1 miLoading sold comps…