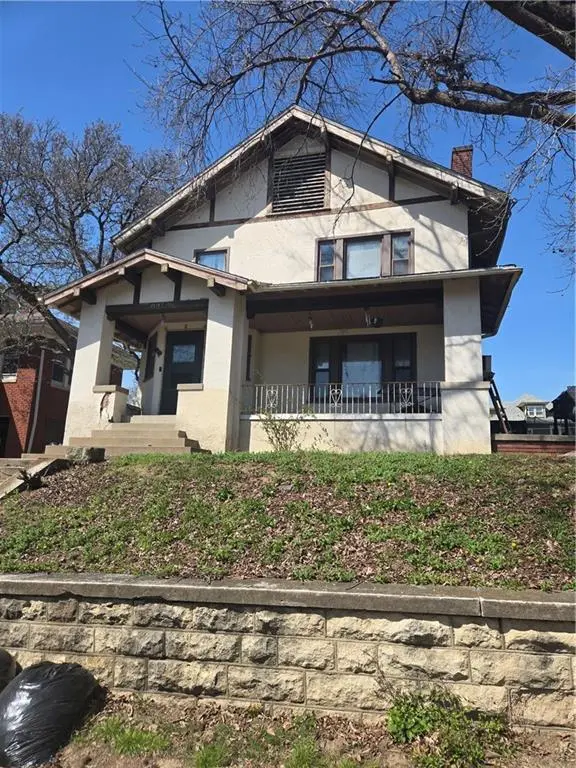
2515 Francis St · St. Joseph, MO
Flood risk 1/10 · Minimal
- FEMA flood zone
- X
- Chance of flooding over 30 yrs
- 0.0%
- Est. flood insurance / yr
- $473 – $860
Fire risk 1/10 · Minimal
- Est. fire insurance / yr
- $1,054 – $1,958
Heat risk 4/10 · Minor
- Hot days now (above 106°F)
- 7 days/yr
- Hot days in 30 yrs
- 16 days/yr
Wind risk 2/10 · Minimal
- Chance of severe wind over 30 yrs
- —
Air-quality risk 2/10 · Minimal
- Unhealthy air days now
- 1 days/yr
- Unhealthy air days in 30 yrs
- 1 days/yr
Risk factors via First Street. Map © Google.
Why this score? — see what drove the B- grade
The composite is a weighted blend of 9 inputs, each scored 0–100. Each bar is that input's sub-score; the figure is the points it added to the 100-point composite (weight × sub-score).
- Cash flow +30.0/30.0
- 1% rule +10.0/10.0
- DSCR +10.0/10.0
- ARV discount +7.5/15.0
- Schools +2.8/10.0
- Rent growth +2.5/5.0
- Livability +2.5/5.0
- Condition / age +2.5/5.0
- Appreciation +0.0/10.0
$69,000
🖨 Deal sheet (PDF) 📄 Offer letter ✓ Due diligence
Listing remarks MLS
Investor special in the heart of Saint Joseph! This property at 2515 Francis St is a true fixer-upper with tons of potential for the right buyer. Whether you’re looking to renovate and flip or add to your rental portfolio, this home offers a great opportunity to build equity. Featuring a solid structure and a spacious lot, it’s ready for your vision and updates. Conveniently located near local amenities, this is your chance to turn a diamond in the rough into something special.
Key facts
- 7,840 sq ft lot
- Built 1932
- Listed 52 days
Neighborhood map
What this means for you Summary
Snapshot
- This is a 4-bed/2.0-bath single-family listed at $69k.
Deal economics
- At list price, monthly cash flow is $415 ($5k/yr) — positive.
- The deal already cash-flows at list — no discount required.
- Meets the 1% rule at list price ($1k rent vs $69k).
- Recommended offer: $67k (3.0% below list) — sets the bar for market timing.
- Cap rate 13.5% vs local median 4.7% in St. Joseph — top-decile yield for the area; either an underpriced asset or a hidden risk that comps aren't pricing in. Stress-test before assuming the spread holds.
Location & tenants
- Location reads: area grade B — affects rentability + tenant quality, not the cash-flow math above.
- St. Joseph (urban): math 28% / reading 38% proficiency, ranked #241 of 324 in MO (top 74%) — families likely to look elsewhere, expect single-tenant / working-renter base with shorter leases.
- Zoned schools: Edison Elem. (math 17% / reading 27%, grade F, #910 of 1,115 statewide, top 83%, 288 students, 99% FRL); Bode Middle (math 29% / reading 44%, grade F, #231 of 391 statewide, top 60%, 486 students, 45% FRL); Central High (math 28% / reading 50%, grade F, #287 of 521 statewide, top 55%, 1,728 students, 40% FRL).
- Market conditions: 97 active listings in the ZIP; 3 comparable units currently listed for rent nearby; rentals lingering (median 45d on market — plan ~5-8 weeks vacancy on turnover, expect pricing pressure); 100% of comp listings sitting > 30 days — soft ceiling on asking rent; 70 units permitted in Buchanan County in 2024 (0 in 5+ unit buildings).
Forward outlook
- Local home prices are declining (-3.0%/yr); year-one equity from $477 of loan paydown is wiped out by about $2k of value loss. Plan a longer hold.
- Buchanan County population projected to shrink 6% by 2050 — rents likely to lag national; underwrite the cash flow, not the appreciation.
- At projected returns (-3.0% appreciation + 3.0% rent growth), your $19k cash investment doubles in ~5 years — after that, you're playing with house money.
Negotiation context
- It's been on market 52 days — a 3% lower offer ($67k) is reasonable based on typical stale-listing flexibility.
Risks & watch-outs
- Watch-outs: built in 1932 — expect roof / HVAC / electrical / plumbing capex.
Questions for the listing agent
- It's been on market 52 days. Have you received any prior offers? Is the seller open to a 3% concession, seller financing, or rate buy-down credit?
- Built in 1932 — when were the roof, HVAC, electrical panel, plumbing, and water heater last replaced?
- Is there a deadline driving the sale (1031 exchange, divorce, estate, relocation)? That informs how much negotiation room exists.
- What's the average days-on-market for RENTAL listings here right now (not sales)? A rising rental-DOM trend means longer vacancies and softer asking-rent achievability than the comps imply.
- What's the recent tenant-quality profile in this submarket — average credit score on applications, eviction rate, late-payment / NSF rate, and stable-employment percentage? A property-management company in the area should have these aggregated.
- How much new for-sale + rental construction is in the pipeline within 1–3 miles? Heavy new supply typically softens prices + rents 12–24 months out; constrained supply supports both.
Investment metrics
- 1% rule
- 1.66% ✓
- Cap rate
- 13.51%
- Cash-on-cash
- 25.78%
- DSCR
- 2.15
- GRM
- 5.0
CMA / ARV
- ARV (median comp)
- $175,369
- List price
- $69,000
- Delta
- -60.65%
- Verdict
- UNDERPRICED
- Comps
- 20 within 1.0 mi
Show comp detail 12 sales within ~0.75 mi
| Address | Dist | Beds/Ba | Sqft | Sold | Price | $/sf | Match |
|---|---|---|---|---|---|---|---|
| 2807 Faraon St | 0.31mi | 4/2.0 | 1,504 (+1%) | 1mo | $184,500 | $123 | 83 |
| 2406 Edmond St | 0.17mi | 3/1.0 (-1) | 1,496 (+0%) | 4mo | $169,000 | $113 | 79 |
| 510 N 26th St | 0.21mi | 3/2.0 (-1) | 1,556 (+4%) | 2mo | $185,000 | $119 | 77 |
| 414 Birch St | 0.45mi | 3/2.0 (-1) | 1,430 (-4%) | 4mo | $279,900 | $196 | 64 |
| 2310 Faraon St | 0.17mi | 3/2.5 (-1) | 1,664 (+12%) | 2mo | $175,000 | $105 | 64 |
| 2517 Faraon St | 0.12mi | 3/1.0 (-1) | 1,286 (-14%) | 6mo | $85,000 | $66 | 57 |
| 724 S 21st St | 0.57mi | 4/2.0 | 1,292 (-13%) | 2mo | $164,000 | $127 | 50 |
| 3001 Felix St S | 0.51mi | 3/2.0 (-1) | 1,680 (+13%) | 3mo | $149,900 | $89 | 47 |
| 2015 Barkley Ln | 0.75mi | 4/1.0 | 1,394 (-6%) | 6mo | $149,900 | $108 | 46 |
| 1620 Buchanan Ave | 0.63mi | 5/2.0 (+1) | 1,320 (-12%) | 6mo | $202,500 | $153 | 41 |
| 412 S 31st St | 0.66mi | 3/1.0 (-1) | 1,369 (-8%) | 6mo | $164,900 | $120 | 41 |
| 3019 Edmond St | 0.59mi | 3/1.0 (-1) | 1,300 (-13%) | 5mo | $155,000 | $119 | 38 |
Match score weights: distance 35% · size 25% · config 20% · recency 20%. Top-matched comps best support the ARV.
Projected returns pro-forma
-3.0% appreciation · 3.0% rent growth · sell at horizon
- IRR
- 19.5%
- Equity multiple
- 1.79×
- Total profit
- $15,284
- Equity at exit
- $10,288
- IRR
- 27.8%
- Equity multiple
- 3.46×
- Total profit
- $47,461
- Equity at exit
- $5,966
Cash invested: $19,320 (down + closing). Projections, not guarantees.
Landlord ↔ Tenant lean methodology
- Overall (STATE)
- 81 Strongly Landlord-Friendly
- State Missouri
- 81 Strongly Landlord-Friendly · R+10
- County
- — inherits STATE
- City
- — inherits STATE
ZIP-level market 64501
- Active inventory
- 97
- Price-to-rent
- 5.0×
Monthly cashflow live
- Estimated rent
- $1,148 medium interval (Pro) →
- Mortgage (P&I)
- −$362
- Tax from tax record
- −$101 /mo · $1,215/yr
- Insurance
- −$29
- HOA
- −$0
- Vacancy / Maint / Mgmt
- −$241
- Net cashflow
- $415
Break-even live
Sensitivity live
| Price | -10% $454 | -5% $435 | +0% $415 | +5% $396 | +10% $376 |
|---|---|---|---|---|---|
| Rent | -10% $324 | -5% $370 | +0% $415 | +5% $460 | +10% $506 |
| Rate | -1.0pp $450 | -0.5pp $433 | base $415 | +0.5pp $397 | +1.0pp $379 |
UW: 25.0% down · 7.5% · 30yr · 1.5% tax · 5.0% vac · 8.0% maint · 8.0% mgmt
Financing live
Cash to close
- Down payment
- $17,250
- Closing costs
- $2,070
- Reserves months
- —
- Total cash needed
- —
Loan-product check · same deal, 3 products live
Conventional
25% down · 7.5% · 30yr
- Down + closing
- —
- Monthly P&I
- —
- Monthly cashflow
- —
- DSCR
- —
- Eligible?
- —
Personal DTI + credit; lowest rate.
DSCR
20% down · 8.5% · 30yr
- Down + closing
- —
- Monthly P&I
- —
- Monthly cashflow
- —
- DSCR
- —
- Eligible?
- —
No personal income docs; deal must DSCR.
Hard money
10% down · 12.0% · 12mo
- Down + closing
- —
- Monthly P&I
- —
- Monthly cashflow
- —
- DSCR
- —
- Eligible?
- —
Short-term bridge; refi at stabilization.
Rent comps 3 comps
| Address | Beds | Baths | Sqft | Rent | $/sqft | DOM | Units | Dist |
|---|---|---|---|---|---|---|---|---|
| 2901 Frederick Ave Saint Joseph, MO | 2.0–3.0 | 1.0 | 900 | $1,000 | $1.11 | 45d | 1 | 0.80mi |
| 303 S 13th St St Joseph, MO | 3.0 | 1.5 | 1000 | $950 | $0.95 | 45d | 1 | 0.82mi |
| 1616 S 25th St Saint Joseph, MO | 3.0 | 1.0 | 1500 | $1,300 | $0.87 | 45d | 1 | 1.12mi |
Listing history 12 events
-
2026-06-07statusdays on market $69,000 Pending 52 DOM
-
2026-06-03pricedays on market $69,000 Active 50 DOM
-
2026-06-02days on market $79,000 Active 49 DOM
-
2026-06-01days on market $79,000 Active 48 DOM
-
2026-05-31days on market $79,000 Active 47 DOM
-
2026-05-30days on market $79,000 Active 46 DOM
-
2026-05-19price $89,000 494-char remark
Show marketing remark (494 chars)
Investor special in the heart of Saint Joseph! This property at 2515 Francis St is a true fixer-upper with tons of potential for the right buyer. Whether you’re looking to renovate and flip or add to your rental portfolio, this home offers a great opportunity to build equity. Featuring a solid structure and a spacious lot, it’s ready for your vision and updates. Conveniently located near local amenities, this is your chance to turn a diamond in the rough into something special.
-
2026-05-12price $94,000 494-char remark
Show marketing remark (494 chars)
Investor special in the heart of Saint Joseph! This property at 2515 Francis St is a true fixer-upper with tons of potential for the right buyer. Whether you’re looking to renovate and flip or add to your rental portfolio, this home offers a great opportunity to build equity. Featuring a solid structure and a spacious lot, it’s ready for your vision and updates. Conveniently located near local amenities, this is your chance to turn a diamond in the rough into something special.
-
2026-05-07price $99,000 494-char remark
Show marketing remark (494 chars)
Investor special in the heart of Saint Joseph! This property at 2515 Francis St is a true fixer-upper with tons of potential for the right buyer. Whether you’re looking to renovate and flip or add to your rental portfolio, this home offers a great opportunity to build equity. Featuring a solid structure and a spacious lot, it’s ready for your vision and updates. Conveniently located near local amenities, this is your chance to turn a diamond in the rough into something special.
-
2026-04-30price $109,000 494-char remark
Show marketing remark (494 chars)
Investor special in the heart of Saint Joseph! This property at 2515 Francis St is a true fixer-upper with tons of potential for the right buyer. Whether you’re looking to renovate and flip or add to your rental portfolio, this home offers a great opportunity to build equity. Featuring a solid structure and a spacious lot, it’s ready for your vision and updates. Conveniently located near local amenities, this is your chance to turn a diamond in the rough into something special.
-
2026-04-22price $114,000 494-char remark
Show marketing remark (494 chars)
Investor special in the heart of Saint Joseph! This property at 2515 Francis St is a true fixer-upper with tons of potential for the right buyer. Whether you’re looking to renovate and flip or add to your rental portfolio, this home offers a great opportunity to build equity. Featuring a solid structure and a spacious lot, it’s ready for your vision and updates. Conveniently located near local amenities, this is your chance to turn a diamond in the rough into something special.
-
2026-04-14$119,000 Active 494-char remark
Show marketing remark (494 chars)
Investor special in the heart of Saint Joseph! This property at 2515 Francis St is a true fixer-upper with tons of potential for the right buyer. Whether you’re looking to renovate and flip or add to your rental portfolio, this home offers a great opportunity to build equity. Featuring a solid structure and a spacious lot, it’s ready for your vision and updates. Conveniently located near local amenities, this is your chance to turn a diamond in the rough into something special.
ⓘ Source: listings_history table (triggers on properties + properties_extension) + one-shot
backfill from property_details.listing_events for pre-trigger history.
Tax reassessment forecast MO · Resets to sale price
- Current annual tax
- $1,215 · $101/mo
- Projected year-2 tax
- $1,215 · $101/mo
- Expected delta
- $0/yr ($0/mo · 0.0%)
ⓘ Screening estimate from a state-policy table — verify with the county assessor before closing.
Climate risk First Street
- Flood 1/10 Low FEMA zone X · 0% chance over 30 yrs
- Wildfire 1/10 Low
- Heat 4/10 Moderate 7 d/yr ≥106°F today · 16 d/yr by 30 yrs out
- Wind 2/10 Low
- Air quality 2/10 Low 1 unhealthy d/yr today · 1 by 30 yrs out
Nearby sold comps map
Loading sold comps map…
Walkable amenities ~0.75 mi
Loading nearby amenities…
Taxation est. · year 1
- Rental income
- $13,777
- − Mortgage interest
- −$3,865
- − Property taxes
- −$1,215
- − Insurance
- −$345
- − Repairs & maintenance
- −$1,102
- − Management
- −$1,102
- − Depreciation
- −$2,007
- Taxable income
- $4,140
- Est. tax owed @ 24.0%
- −$994
- After-tax cash flow
- $3,988/yr
For passive investors: Depreciation is non-cash, so a rental often shows a tax loss while cash-flowing — sheltering income. Rental losses are passive: they offset passive income freely, and up to $25,000/yr can offset ordinary (W-2) income if you actively participate and your MAGI is under $100k (phasing out to $0 by $150k); unused losses carry forward. On sale, claimed depreciation is recaptured at up to 25%, and gains may owe capital-gains tax (a 1031 exchange can defer both). Figures are a year-1 estimate at your 24.0% rate — not tax advice; consult a CPA.
Schools (NCES district)
- District
- St. Joseph
- NCES district ID
- 2927060
- Math proficiency
- 28% ▼ -6.00%
- Reading proficiency
- 38% ▼ -1.00%
- Median HH income
- $43,007
- Composite
- 27.99/100
- National rank
- #6853
- State rank
- #241 of 324 in MO
Livability — St. Joseph
No livability data for this city. (Only ~50 U.S. cities are tracked.)
Census & demographics
- Census place
- St. Joseph, MO
- County
- Buchanan County · 32,150 people
- City population
- 44,382
- Metro
- St. Joseph, MO-KS
- Population (ZIP)
- 10,689
- Household income
- $46,731
- Rent vs Own
- Severe rent burden
- 721.0
Population outlook (Buchanan County) Hauer SSP2
- Today (2025)
- 89,041 people
- By 2030
- 88,401 · -0.7%
- By 2040
- 86,220 · -3.2%
- By 2050
- 83,603 · -6.1%
- By 2075
- 76,750 · -13.8%
- By 2100
- 67,623 · -24.1%
Race, ethnicity, and origin ACS 2023
- Neighborhood character
- Predominantly White (69%)
- Race & ethnicity
- White 69% Black 12% Hispanic / Latino 11% Two or more races 9%
- Hispanic origin (detail)
- Mexican 6% Puerto Rican 1%
- Common ancestry
- Italian 3% Romanian 1% Slovak 1%
- Foreign-born
- 7% · Canada, China
- Languages at home
- 89% English-only · Spanish 7% Arabic 1%
Political lean MEDSL · Buchanan
- 2024 margin
- Strong R (+28.0) · D 35.2% · R 63.3% · Other 1.5%
- 2008→2024 swing
- -28.2pp toward R · 2008: 0.1pp · 2024: -28.0pp
- All cycles
- 2024: R+28.0 2020: R+24.6 2016: R+26.2 2012: R+8.7 2008: D+0.1
Not yet ingested
- Civics
- —
Market trends
- HPI YoY
- ▼ -150.20%
- Current HPI
- 157.8706
- Rent YoY
- —
- Metro
- St. Joseph, MO-KS
- State GDP YoY
- ▲ 1.84%
- F500 in state
- 20
Industry mix (Fortune 500 HQ in MO)
| Industry | F500 HQs | Revenue |
|---|---|---|
| Healthcare | 1 | $163B |
|
||
| Insurance | 1 | $21B |
|
||
| Industrial Technology | 1 | $17B |
|
||
| Retail | 1 | $16B |
|
||
| Industrial Distribution | 1 | $10B |
|
||
| Utilities | 1 | $9B |
|
||
Price history
-25.2% since first listed6 events — show timeline
- 2026-05-19 Price Changed $89,000 Heartland MLS as Distributed by MLS Grid
- 2026-05-12 Price Changed $94,000 Heartland MLS as Distributed by MLS Grid
- 2026-05-07 Price Changed $99,000 Heartland MLS as Distributed by MLS Grid
- 2026-04-30 Price Changed $109,000 Heartland MLS as Distributed by MLS Grid
- 2026-04-22 Price Changed $114,000 Heartland MLS as Distributed by MLS Grid
- 2026-04-14 Listed $119,000 Heartland MLS as Distributed by MLS Grid
Property tax history
+1.5%/yrLatest (2025): $1,215 · +6.7% YoY. Source: county tax records.
Cash-flow waterfall
monthlySold comps — $/sqft
last 12 mo · ≤1 miLoading sold comps…