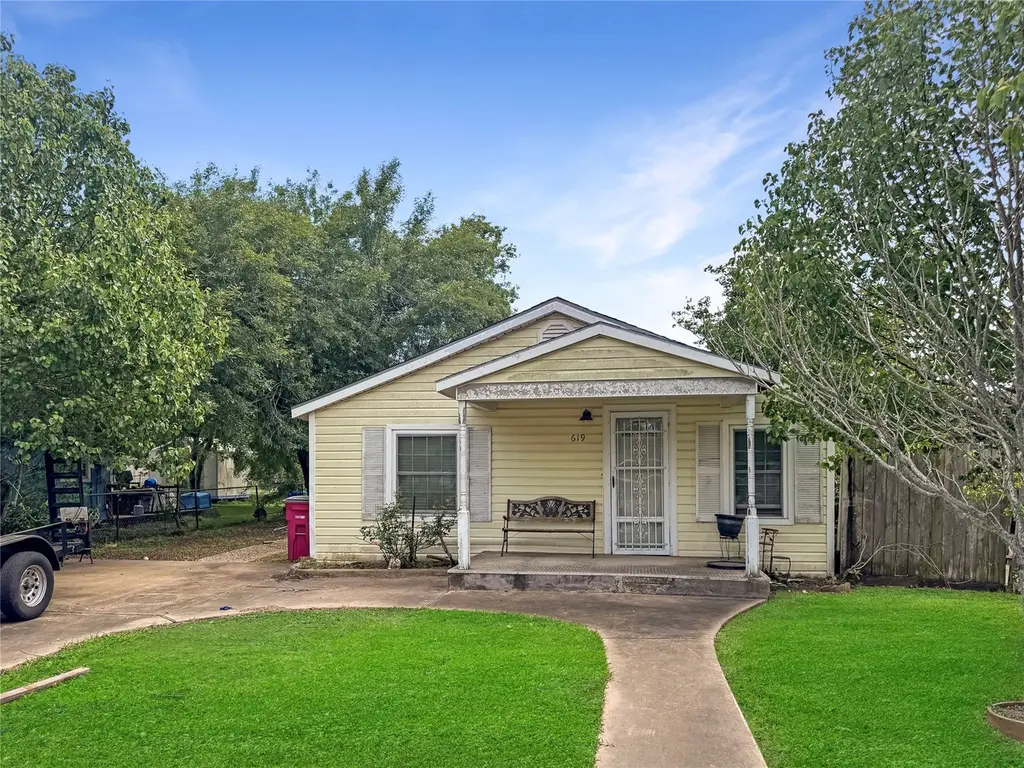
619 N Avenue C · Freeport, TX
Flood risk 8/10 · Major
- FEMA flood zone
- X (unshaded)
- Chance of flooding over 30 yrs
- 0.76%
- Est. flood insurance / yr
- $507 – $1,088
Fire risk 4/10 · Minor
- Est. fire insurance / yr
- $1,222 – $2,270
Heat risk 10/10 · Severe
- Hot days now (above 113°F)
- 7 days/yr
- Hot days in 30 yrs
- 26 days/yr
Wind risk 9/10 · Severe
- Chance of severe wind over 30 yrs
- 99.0%
Air-quality risk 2/10 · Minimal
- Unhealthy air days now
- 1 days/yr
- Unhealthy air days in 30 yrs
- 1 days/yr
Risk factors via First Street. Map © Google.
Why this score? — see what drove the B- grade
The composite is a weighted blend of 9 inputs, each scored 0–100. Each bar is that input's sub-score; the figure is the points it added to the 100-point composite (weight × sub-score).
- Cash flow +24.4/30.0
- ARV discount +15.0/15.0
- DSCR +7.9/10.0
- 1% rule +7.1/10.0
- Schools +3.7/10.0
- Livability +2.9/5.0
- Rent growth +2.5/5.0
- Condition / age +2.5/5.0
- Appreciation +0.0/10.0
$119,900
🖨 Deal sheet 📄 Offer letter ✓ Due diligence
Listing remarks MLS
INVESTOR SPECIAL!! Step into a great opportunity to own. This home is located in a great location, conveniently close to the school, levy and shopping. Turn it into your forever home or a great rental opportunity. Need room to work outside this outdoor area and garage space is amazing!! Make it yours today
Key facts
- Great location
- Outdoor area
- Garage space
Tags
Neighborhood map
What this means for you Summary
Snapshot
- This is a 3-bed/1.0-bath single-family listed at $120k.
Deal economics
- At list price, monthly cash flow is $178 ($2k/yr) — positive.
- The deal already cash-flows at list — no discount required.
- Meets the 1% rule at list price ($1k rent vs $120k).
- Recommended offer: $106k (12.0% below list) — sets the bar for market timing.
- Cap rate 8.7% vs local median 3.8% in Freeport — top-decile yield for the area; either an underpriced asset or a hidden risk that comps aren't pricing in. Stress-test before assuming the spread holds.
Location & tenants
- Location reads 58/100 on livability (#1,205 in TX) — a working-class tenant base; expect higher turnover. Strengths: cost of living A+, housing A+; Watch: crime D, schools F, amenities F.
- Brazosport ISD (suburban): math 43% / reading 41% proficiency, ranked #305 of 826 in TX (top 37%) — families likely to look elsewhere, expect single-tenant / working-renter base with shorter leases.
- Market conditions: 590 active listings in the ZIP; 5 comparable units currently listed for rent nearby; rentals lingering (median 44d on market — plan ~5-8 weeks vacancy on turnover, expect pricing pressure); 100% of comp listings sitting > 30 days — soft ceiling on asking rent; 3,960 units permitted in Brazoria County in 2024 (593 in 5+ unit buildings).
Forward outlook
- Local home prices are declining (-3.0%/yr); year-one equity from $829 of loan paydown is wiped out by about $4k of value loss. Plan a longer hold.
- Brazoria County population projected at +44% by 2050 — long-run rental-demand tailwind backs the buy-and-hold thesis.
Negotiation context
- It's been on market 428 days — a 12% lower offer ($106k) is reasonable based on typical stale-listing flexibility.
Risks & watch-outs
- Watch-outs: flood insurance adds $66/mo; built in 1943 — expect roof / HVAC / electrical / plumbing capex.
- Climate carrying-cost: severe flood risk; severe wind risk, 99% chance of damaging wind over 30y; extreme-heat days projected 7→26/yr by 2055 (HVAC capex compounding) — expect insurance premiums to compound above CPI over the hold.
Questions for the listing agent
- It's been on market 428 days. Have you received any prior offers? Is the seller open to a 12% concession, seller financing, or rate buy-down credit?
- Built in 1943 — when were the roof, HVAC, electrical panel, plumbing, and water heater last replaced?
- What's the actual annual flood-insurance premium (NFIP or private), and is the property in a SFHA with mandatory coverage?
- Why hasn't it sold? Are there any deal-killer items the seller is aware of (foundation, flood, title, zoning, code violations)?
- Is there a deadline driving the sale (1031 exchange, divorce, estate, relocation)? That informs how much negotiation room exists.
- Schools are F-rated, which usually means shorter tenancies and higher turnover. Who's the typical renter profile here, and what's been the actual vacancy rate?
- Crime grade is D in this area — have there been break-ins, vandalism, or insurance claims at this property in the last 3 years? What carrier currently insures it and at what premium?
- What's the average days-on-market for RENTAL listings here right now (not sales)? A rising rental-DOM trend means longer vacancies and softer asking-rent achievability than the comps imply.
- What's the recent tenant-quality profile in this submarket — average credit score on applications, eviction rate, late-payment / NSF rate, and stable-employment percentage? A property-management company in the area should have these aggregated.
- How much new for-sale + rental construction is in the pipeline within 1–3 miles? Heavy new supply typically softens prices + rents 12–24 months out; constrained supply supports both.
Investment metrics
- 1% rule
- 1.21% ✓
- Cap rate
- 8.74%
- Cash-on-cash
- 8.73%
- DSCR
- 1.39
- GRM
- 6.9
CMA / ARV
- ARV (median comp)
- $173,312
- List price
- $119,900
- Delta
- -30.82%
- Verdict
- UNDERPRICED
- Comps
- 20 within 1.0 mi
Show comp detail 7 sales within ~0.75 mi
| Address | Dist | Beds/Ba | Sqft | Sold | Price | $/sf | Match |
|---|---|---|---|---|---|---|---|
| 724 N Avenue F | 0.25mi | 4/2.0 (+1) | 1,556 (-6%) | 1mo | $172,900 | $111 | 68 |
| 202 N Avenue D | 0.34mi | 3/2.0 | 1,511 (-9%) | 15mo | $97,800 | $65 | 54 |
| 618 N Avenue A | 0.10mi | 2/3.0 (-1) | 1,528 (-8%) | 23mo | $180,000 | $118 | 51 |
| 605 N Avenue G | 0.27mi | 4/2.0 (+1) | 1,500 (-9%) | 21mo | $195,000 | $130 | 45 |
| 1206 N Avenue L | 0.74mi | 3/2.0 | 1,878 (+13%) | 1mo | $230,000 | $122 | 38 |
| 1607 W Broad St | 0.69mi | 3/2.0 | 1,756 (+6%) | 21mo | $150,000 | $85 | 36 |
| 1422 W Broad St | 0.71mi | 3/1.0 | 1,419 (-14%) | 23mo | $110,000 | $78 | 24 |
Match score weights: distance 35% · size 25% · config 20% · recency 20%. Top-matched comps best support the ARV.
Projected returns pro-forma
-3.0% appreciation · 3.0% rent growth · sell at horizon
- IRR
- -6.4%
- Equity multiple
- 0.76×
- Total profit
- $-7,998
- Equity at exit
- $17,877
- IRR
- 3.3%
- Equity multiple
- 1.24×
- Total profit
- $8,054
- Equity at exit
- $10,367
Cash invested: $33,572 (down + closing). Projections, not guarantees.
Landlord ↔ Tenant lean methodology
- Overall (STATE)
- 87 Strongly Landlord-Friendly
- State Texas
- 87 Strongly Landlord-Friendly · R+5
- County
- — inherits STATE
- City
- — inherits STATE
ZIP-level market 77541
- Home prices YoY
- -29.3%
- Active inventory
- 590
- Price-to-rent
- 6.9×
Monthly cashflow live
- Estimated rent
- $1,451 high interval (Pro) →
- Mortgage (P&I)
- −$629
- Tax from tax record
- −$223 /mo · $2,677/yr
- Insurance
- −$50
- Flood insurance flood zone
- −$66 /mo · $798/yr
- HOA
- −$0
- Vacancy / Maint / Mgmt
- −$305
- Net cashflow
- $178
Break-even live
UW: 25.0% down · 7.5% · 30yr · 1.5% tax · 5.0% vac · 8.0% maint · 8.0% mgmt
Financing live
Cash to close
- Down payment
- $29,975
- Closing costs
- $3,597
- Reserves months
- —
- Total cash needed
- —
Loan-product check · same deal, 3 products live
Conventional
25% down · 7.5% · 30yr
- Down + closing
- —
- Monthly P&I
- —
- Monthly cashflow
- —
- DSCR
- —
- Eligible?
- —
Personal DTI + credit; lowest rate.
DSCR
20% down · 8.5% · 30yr
- Down + closing
- —
- Monthly P&I
- —
- Monthly cashflow
- —
- DSCR
- —
- Eligible?
- —
No personal income docs; deal must DSCR.
Hard money
10% down · 12.0% · 12mo
- Down + closing
- —
- Monthly P&I
- —
- Monthly cashflow
- —
- DSCR
- —
- Eligible?
- —
Short-term bridge; refi at stabilization.
Rent comps 5 comps
| Address | Beds | Baths | Sqft | Rent | $/sqft | DOM | Units | Dist |
|---|---|---|---|---|---|---|---|---|
| 102 North Avenue C Unit C Freeport, TX | 4.0 | 2.0 | 1500 | $1,550 | $1.03 | 43d | 1 | 0.43mi |
| 905 N Avenue J Freeport, TX | 3.0 | 2.0 | 1161 | $871 | $0.75 | 43d | 1 | 0.48mi |
| 310 Yaupon St Unit ST402 Freeport, TX | 3.0 | 1.0 | 1050 | $1,150 | $1.10 | 43d | 1 | 0.70mi |
| 1410 North Avenue R Unit R Freeport, TX | 3.0 | 2.0 | 1395 | $1,277 | $0.92 | 43d | 1 | 1.14mi |
| 1708 North Avenue R Unit R Freeport, TX | 3.0 | 2.0 | 1300 | $1,225 | $0.94 | 43d | 1 | 1.25mi |
Listing history 15 events
-
2026-06-18days on market $119,900 Active 428 DOM
-
2026-06-17days on market $119,900 Active 427 DOM
-
2026-06-16days on market $119,900 Active 426 DOM
-
2026-06-15days on market $119,900 Active 425 DOM
-
2026-06-13days on market $119,900 Active 423 DOM
-
2026-06-09days on market $119,900 Active 419 DOM
-
2026-06-08days on market $119,900 Active 418 DOM
-
2026-06-07days on market $119,900 Active 417 DOM
-
2026-06-04days on market $119,900 Active 414 DOM
-
2026-06-03days on market $119,900 Active 413 DOM
-
2026-06-02days on market $119,900 Active 412 DOM
-
2026-06-01days on market $119,900 Active 411 DOM
-
2026-05-31days on market $119,900 Active 410 DOM
-
2025-04-16$119,900 Active 307-char remark
Show marketing remark (307 chars)
INVESTOR SPECIAL!! Step into a great opportunity to own. This home is located in a great location, conveniently close to the school, levy and shopping. Turn it into your forever home or a great rental opportunity. Need room to work outside this outdoor area and garage space is amazing!! Make it yours today
-
1995-12-18soldstatus
ⓘ Source: listings_history table (triggers on properties + properties_extension) + one-shot
backfill from property_details.listing_events for pre-trigger history.
Tax reassessment forecast TX · Resets to sale price
- Current annual tax
- $2,677 · $223/mo
- Projected year-2 tax
- $2,677 · $223/mo
- Expected delta
- $0/yr ($0/mo · 0.0%)
ⓘ Screening estimate from a state-policy table — verify with the county assessor before closing.
Climate risk First Street
- Flood 8/10 Severe FEMA zone X (unshaded) · 76% chance over 30 yrs
- Wildfire 4/10 Moderate
- Heat 10/10 Extreme 7 d/yr ≥113°F today · 26 d/yr by 30 yrs out
- Wind 9/10 Extreme 99% chance of damaging wind over 30 yrs
- Air quality 2/10 Low 1 unhealthy d/yr today · 1 by 30 yrs out
Nearby sold comps map
Loading sold comps map…
Walkable amenities ~0.75 mi
Loading nearby amenities…
Taxation est. · year 1
- Rental income
- $17,408
- − Mortgage interest
- −$6,716
- − Property taxes
- −$2,677
- − Insurance
- −$1,397
- − Repairs & maintenance
- −$1,393
- − Management
- −$1,393
- − Depreciation
- −$3,488
- Taxable income
- $345
- Est. tax owed @ 24.0%
- −$83
- After-tax cash flow
- $2,051/yr
For passive investors: Depreciation is non-cash, so a rental often shows a tax loss while cash-flowing — sheltering income. Rental losses are passive: they offset passive income freely, and up to $25,000/yr can offset ordinary (W-2) income if you actively participate and your MAGI is under $100k (phasing out to $0 by $150k); unused losses carry forward. On sale, claimed depreciation is recaptured at up to 25%, and gains may owe capital-gains tax (a 1031 exchange can defer both). Figures are a year-1 estimate at your 24.0% rate — not tax advice; consult a CPA.
Schools (NCES district)
- District
- Brazosport ISD
- NCES district ID
- 4811190
- Math proficiency
- 43% ▼ -6.00%
- Reading proficiency
- 41% ▼ -2.00%
- Median HH income
- $57,024
- Composite
- 36.84/100
- National rank
- #4557
- State rank
- #305 of 826 in TX
Livability — Freeport
- Score
- 58/100
- State rank
- #1205
- US rank
- #21044
Category grades
Schools grade is shown separately in the Schools card above.
Census & demographics
- Census place
- Freeport, TX
- County
- Brazoria County · 374,982 people
- City population
- 16,996
- Metro
- Houston-The Woodlands-Sugar Land, TX
- Population (ZIP)
- 16,996
- Household income
- $66,507
- Rent vs Own
- Severe rent burden
- 354.0
Population outlook (Brazoria County) Hauer SSP2
- Today (2025)
- 420,414 people
- By 2030
- 457,585 · +8.8%
- By 2040
- 532,232 · +26.6%
- By 2050
- 605,399 · +44.0%
- By 2075
- 779,358 · +85.4%
- By 2100
- 883,759 · +110.2%
Race, ethnicity, and origin ACS 2023
- Neighborhood character
- Diverse neighborhood (Simpson 0.62)
- Race & ethnicity
- Hispanic / Latino 47% White 38% Two or more races 23% Black 12%
- Hispanic origin (detail)
- Mexican 42%
- Common ancestry
- Romanian 1% Italian 1% Lithuanian 1%
- Foreign-born
- 12% · Canada
- Languages at home
- 71% English-only · Spanish 29%
Political lean MEDSL · Brazoria
- 2024 margin
- R (+19.7) · D 39.5% · R 59.2% · Other 1.3%
- 2008→2024 swing
- +9.9pp toward D · 2008: -29.6pp · 2024: -19.7pp
- All cycles
- 2024: R+19.7 2020: R+18.2 2016: R+24.6 2012: R+34.2 2008: R+29.6
Not yet ingested
- Civics
- —
Market trends
- HPI YoY
- ▼ -110.12%
- Current HPI
- 265.9301
- Rent YoY
- —
- Metro
- Houston-The Woodlands-Sugar Land, TX
- State GDP YoY
- ▲ 3.95%
- F500 in state
- 110
Industry mix (Fortune 500 HQ in TX)
| Industry | F500 HQs | Revenue |
|---|---|---|
| Energy | 16 | $1,198B |
|
||
| Technology | 5 | $198B |
|
||
| Engineering / Construction | 4 | $72B |
|
||
| Energy Services | 3 | $60B |
|
||
| Utilities | 3 | $41B |
|
||
| Healthcare | 2 | $330B |
|
||
Price history
2 events — show timeline
- 2025-04-16 Listed $119,900 HARMLS
- 1995-12-18 Sold (Public Records) — Public Records
Property tax history
+5.1%/yrLatest (2025): $2,677 · +2.1% YoY. Source: county tax records.
Cash-flow waterfall
monthlySold comps — $/sqft
last 12 mo · ≤1 miLoading sold comps…