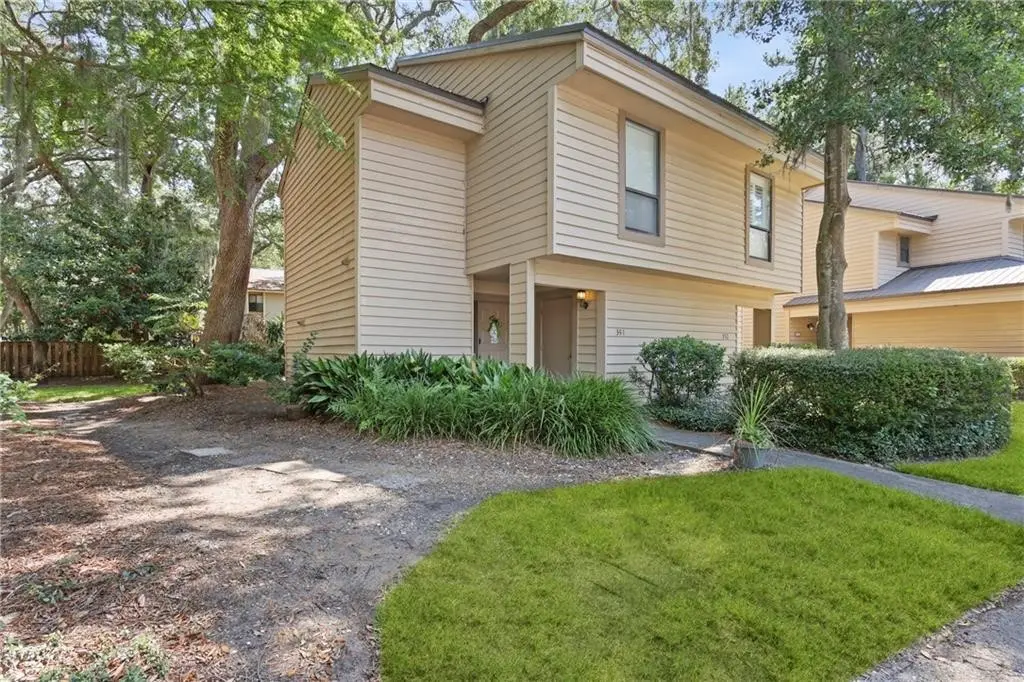
351 Brockinton Marsh · St. Simons, GA
Flood risk 10/10 · Severe
- FEMA flood zone
- AE
- Chance of flooding over 30 yrs
- 0.99%
- Est. flood insurance / yr
- $1,737 – $8,500
Fire risk 5/10 · Moderate
- Est. fire insurance / yr
- $963 – $1,789
Heat risk 10/10 · Severe
- Hot days now (above 105°F)
- 7 days/yr
- Hot days in 30 yrs
- 20 days/yr
Wind risk 9/10 · Severe
- Chance of severe wind over 30 yrs
- 99.0%
Air-quality risk 4/10 · Minor
- Unhealthy air days now
- 6 days/yr
- Unhealthy air days in 30 yrs
- 6 days/yr
Risk factors via First Street. Map © Google.
Why this score? — see what drove the D grade
The composite is a weighted blend of 9 inputs, each scored 0–100. Each bar is that input's sub-score; the figure is the points it added to the 100-point composite (weight × sub-score).
- Cash flow +14.1/30.0
- ARV discount +7.5/15.0
- 1% rule +5.1/10.0
- DSCR +4.3/10.0
- Schools +3.4/10.0
- Rent growth +3.1/5.0
- Livability +2.5/5.0
- Condition / age +2.5/5.0
- Appreciation +0.0/10.0
$339,000
🖨 Deal sheet (PDF) 📄 Offer letter ✓ Due diligence
Listing remarks MLS
Stylish and thoughtfully updated, this townhouse offers a perfect mix of coastal living and quality upgrades, ideal as a beachside retreat or full-time home. The main level features beautiful hardwood floors, while upstairs you’ll find newly installed LVP flooring. The kitchen has been upgraded with quartz countertops, modern cabinetry, a brand-new dishwasher, and updated lighting throughout. The primary bedroom includes vaulted ceilings and a skylight that fills the room with natural light. In the living room, a cozy fireplace creates a welcoming focal point, and sliding glass doors lead out to a private patio, perfect for relaxing or entertaining guests. There are two separate storage areas, one at the front entrance and another off the patio—great for keeping bikes, beach gear, or anything else tucked away but easily accessible. With its blend of coastal charm and stylish updates, this home is truly move-in ready. No rental or pet restrictions.
Key facts
- Quartz countertops
- Modern cabinetry
- Lvp flooring
Tags
Neighborhood map
What this means for you Summary
Snapshot
- This is a 2-bed/2.0-bath condo listed at $339k.
Deal economics
- At list price, monthly cash flow is $-379 ($-5k/yr) — negative.
- The deal already cash-flows at list — no discount required.
- Meets the 1% rule at list price ($3k rent vs $339k).
- Recommended offer: $319k (6.0% below list) — sets the bar for market timing.
- Cap rate 6.5% vs local median 1.7% in St. Simons — top-decile yield for the area; either an underpriced asset or a hidden risk that comps aren't pricing in. Stress-test before assuming the spread holds.
Location & tenants
- Location reads: area grade D — affects rentability + tenant quality, not the cash-flow math above.
- Glynn County (other): math 37% / reading 42% proficiency, ranked #47 of 174 in GA (top 27%) — families likely to look elsewhere, expect single-tenant / working-renter base with shorter leases.
- Zoned schools: Oglethorpe Point Elementary School (math 73% / reading 70%, grade A-, #47 of 1,228 statewide, top 4%, 553 students, 23% FRL); Glynn Middle (math 42% / reading 58%, grade C, #68 of 470 statewide, top 15%, 815 students, 51% FRL); Glynn Academy (math 45% / reading 42%, grade F, #50 of 424 statewide, top 12%, 1,823 students, 41% FRL) — zoned schools average 38% FRL vs 55% district-wide (17 pts lower); this property's tenant base skews higher-income than the district average.
- Zoned-school proficiency averages 55% at this address vs 40% district-wide (+16 pts) — the actual schools serving this property are materially stronger than the Glynn County average implies; a family-tenant draw the district grade alone would hide.
- Market conditions: Rents rising (+2.3%/yr); 579 active listings in the ZIP; 2 comparable units currently listed for rent nearby; solid renter incomes; 734 units permitted in Glynn County in 2024 (136 in 5+ unit buildings).
- This rent runs 38% of the median local income ($109k/yr) — at the standard rent-burdened threshold; future hikes will face affordability resistance.
Forward outlook
- Local home prices are declining (-3.0%/yr); year-one equity from $2k of loan paydown is wiped out by about $10k of value loss. Plan a longer hold.
- Glynn County population projected at +13% by 2050 — modest demand growth; plan on rents tracking national, not racing it.
Negotiation context
- It's been on market 77 days — a 6% lower offer ($319k) is reasonable based on typical stale-listing flexibility.
- 4 sale attempts since 17y ago with the ask held roughly flat each time — persistent listings suggest the price (not the market) is what's stuck; bring a comps-based counter.
Risks & watch-outs
- Watch-outs: flood insurance adds $427/mo.
- Climate carrying-cost: in FEMA flood zone AE (mandatory federal flood insurance); severe wind risk, 99% chance of damaging wind over 30y; moderate wildfire risk; extreme-heat days projected 7→20/yr by 2055 (HVAC capex compounding) — expect insurance premiums to compound above CPI over the hold.
Questions for the listing agent
- What do current leases actually rent for vs. the listed asking? Can we see a recent rent roll and the last 12 months of T-12 income?
- It's been on market 77 days. Have you received any prior offers? Is the seller open to a 6% concession, seller financing, or rate buy-down credit?
- What's the actual annual flood-insurance premium (NFIP or private), and is the property in a SFHA with mandatory coverage?
- What does the HOA fee cover, when was the last increase, and are there any pending special assessments or reserve-fund shortfalls?
- Any open or pending special assessments — roof, HVAC, plumbing, elevator, façade? What's the per-unit balance and payoff schedule, and is the seller paying it off at close or rolling it to the buyer?
- Why hasn't it sold? Are there any deal-killer items the seller is aware of (foundation, flood, title, zoning, code violations)?
- Is there a deadline driving the sale (1031 exchange, divorce, estate, relocation)? That informs how much negotiation room exists.
- The area grade is low — what's the realistic commute time and amenity access for the typical tenant pool here? Any planned neighborhood developments (good or bad) we should know about?
- What's the average days-on-market for RENTAL listings here right now (not sales)? A rising rental-DOM trend means longer vacancies and softer asking-rent achievability than the comps imply.
- What's the recent tenant-quality profile in this submarket — average credit score on applications, eviction rate, late-payment / NSF rate, and stable-employment percentage? A property-management company in the area should have these aggregated.
- How much new apartment / multifamily construction is in the pipeline within 1–3 miles? Heavy new supply (>2% of stock underway) typically softens rents 12–24 months out; light construction supports rent growth.
Investment metrics
- 1% rule
- 1.01% ✓
- Cap rate
- 6.46%
- Cash-on-cash
- 0.61%
- DSCR
- 1.03
- GRM
- 8.3
CMA / ARV
No comps found within radius.
Projected returns pro-forma
-3.0% appreciation · 2.26% rent growth · sell at horizon
- IRR
- -25.3%
- Equity multiple
- 0.15×
- Total profit
- $-81,067
- Equity at exit
- $50,546
- IRR
- -24.2%
- Equity multiple
- -0.16×
- Total profit
- $-109,800
- Equity at exit
- $29,311
Cash invested: $94,920 (down + closing). Projections, not guarantees.
Landlord ↔ Tenant lean methodology
- Overall (STATE)
- 90 Strongly Landlord-Friendly
- State Georgia
- 90 Strongly Landlord-Friendly · R+3
- County
- — inherits STATE
- City
- — inherits STATE
ZIP-level market 31522
- Rents YoY
- 2.3%
- Active inventory
- 579
- Price-to-rent
- 8.3×
Monthly cashflow live
- Estimated rent
- $3,409 medium interval (Pro) →
- Mortgage (P&I)
- −$1,778
- Tax from tax record
- −$251 /mo · $3,014/yr
- Insurance
- −$141
- Flood insurance flood zone
- −$427 /mo · $5,118/yr
- HOA est. from 2 same-building comps
- −$475
- Lot rent
- −$0
- Vacancy / Maint / Mgmt
- −$716
- Net cashflow
- $-379
Break-even live
Sensitivity live
| Price | -10% $-187 | -5% $-283 | +0% $-379 | +5% $-475 | +10% $-571 |
|---|---|---|---|---|---|
| Rent | -10% $-648 | -5% $-513 | +0% $-379 | +5% $-244 | +10% $-109 |
| Rate | -1.0pp $-208 | -0.5pp $-292 | base $-379 | +0.5pp $-466 | +1.0pp $-556 |
UW: 25.0% down · 7.5% · 30yr · 1.5% tax · 5.0% vac · 8.0% maint · 8.0% mgmt
Financing live
Cash to close
- Down payment
- $84,750
- Closing costs
- $10,170
- Reserves months
- —
- Total cash needed
- —
Loan-product check · same deal, 3 products live
Conventional
25% down · 7.5% · 30yr
- Down + closing
- —
- Monthly P&I
- —
- Monthly cashflow
- —
- DSCR
- —
- Eligible?
- —
Personal DTI + credit; lowest rate.
DSCR
20% down · 8.5% · 30yr
- Down + closing
- —
- Monthly P&I
- —
- Monthly cashflow
- —
- DSCR
- —
- Eligible?
- —
No personal income docs; deal must DSCR.
Hard money
10% down · 12.0% · 12mo
- Down + closing
- —
- Monthly P&I
- —
- Monthly cashflow
- —
- DSCR
- —
- Eligible?
- —
Short-term bridge; refi at stabilization.
Rent comps 2 comps
| Address | Beds | Baths | Sqft | Rent | $/sqft | DOM | Units | Dist |
|---|---|---|---|---|---|---|---|---|
| 122 Shady Brook Cir #100 Saint Simons Island, GA | 3.0 | 2.0 | 1500 | $4,950 | $3.30 | 46d | 1 | 0.09mi |
| 1704 Frederica Rd #426 Saint Simons Island, GA | 2.0 | 2.0 | 1150 | $2,150 | $1.87 | 46d | 1 | 0.49mi |
HOA detail condo
- Monthly dues
- $0 · $0/yr
- Assessments
- None detected in remarks — confirm with the listing agent.
Listing history 19 events
-
2026-06-03days on market $339,000 Active 77 DOM
-
2026-06-02days on market $339,000 Active 76 DOM
-
2026-06-01days on market $339,000 Active 75 DOM
-
2026-05-31days on market $339,000 Active 74 DOM
-
2026-05-30days on market $339,000 Active 73 DOM
-
2026-03-18$339,000 Active 973-char remark
Show marketing remark (973 chars)
Stylish and thoughtfully updated, this townhouse offers a perfect mix of coastal living and quality upgrades, ideal as a beachside retreat or full-time home. The main level features beautiful hardwood floors, while upstairs you’ll find newly installed LVP flooring. The kitchen has been upgraded with quartz countertops, modern cabinetry, a brand-new dishwasher, and updated lighting throughout. The primary bedroom includes vaulted ceilings and a skylight that fills the room with natural light. In the living room, a cozy fireplace creates a welcoming focal point, and sliding glass doors lead out to a private patio, perfect for relaxing or entertaining guests. There are two separate storage areas, one at the front entrance and another off the patio—great for keeping bikes, beach gear, or anything else tucked away but easily accessible. With its blend of coastal charm and stylish updates, this home is truly move-in ready. No rental or pet restrictions.
-
2025-09-18price $355,000
-
2025-07-31price $365,000
-
2023-08-16soldstatus $315,000
-
2023-08-15soldstatus $315,000 Closed
-
2023-07-29status Pending
-
2023-07-19status Active
-
2023-07-12historical Active Under Contract
-
2023-06-24price $330,000
-
2023-05-15price $340,000
-
2023-02-27$365,000 Active
-
2013-09-24soldstatus $137,000
-
2009-10-22historical
-
2009-01-30$225,000
ⓘ Source: listings_history table (triggers on properties + properties_extension) + one-shot
backfill from property_details.listing_events for pre-trigger history.
Tax reassessment forecast GA · Resets to sale price
- Current annual tax
- $3,014 · $251/mo
- Projected year-2 tax
- $3,119 · $260/mo
- Expected delta
- +$105/yr (+$9/mo · 3.5%)
ⓘ Screening estimate from a state-policy table — verify with the county assessor before closing.
Climate risk First Street
- Flood 10/10 Extreme FEMA zone AE · 99% chance over 30 yrs
- Wildfire 5/10 Major
- Heat 10/10 Extreme 7 d/yr ≥105°F today · 20 d/yr by 30 yrs out
- Wind 9/10 Extreme 99% chance of damaging wind over 30 yrs
- Air quality 4/10 Moderate 6 unhealthy d/yr today · 6 by 30 yrs out
Nearby sold comps map
Loading sold comps map…
Walkable amenities ~0.75 mi
Loading nearby amenities…
Taxation est. · year 1
- Rental income
- $40,908
- − Mortgage interest
- −$18,989
- − Property taxes
- −$3,014
- − Insurance
- −$6,814
- − Repairs & maintenance
- −$3,273
- − Management
- −$3,273
- − HOA
- −$5,700
- − Depreciation
- −$9,862
- Taxable loss
- −$10,016
- Est. tax savings @ 24.0%
- +$2,404
- After-tax cash flow
- $-2,140/yr
For passive investors: Depreciation is non-cash, so a rental often shows a tax loss while cash-flowing — sheltering income. Rental losses are passive: they offset passive income freely, and up to $25,000/yr can offset ordinary (W-2) income if you actively participate and your MAGI is under $100k (phasing out to $0 by $150k); unused losses carry forward. On sale, claimed depreciation is recaptured at up to 25%, and gains may owe capital-gains tax (a 1031 exchange can defer both). Figures are a year-1 estimate at your 24.0% rate — not tax advice; consult a CPA.
Schools (NCES district)
- District
- Glynn County
- NCES district ID
- 1302400
- Math proficiency
- 37% ▼ -9.00%
- Reading proficiency
- 42% ▼ -7.00%
- Median HH income
- $47,554
- Composite
- 33.83/100
- National rank
- #5359
- State rank
- #47 of 174 in GA
Livability — St. Simons
No livability data for this city. (Only ~50 U.S. cities are tracked.)
Census & demographics
- Census place
- St. Simons, GA
- County
- Glynn County · 69,019 people
- Metro
- Brunswick, GA
- Population (ZIP)
- 17,780
- Household income
- $108,632
- Rent vs Own
- Severe rent burden
- 339.0
Population outlook (Glynn County) Hauer SSP2
- Today (2025)
- 91,404 people
- By 2030
- 94,806 · +3.7%
- By 2040
- 100,060 · +9.5%
- By 2050
- 103,258 · +13.0%
- By 2075
- 107,970 · +18.1%
- By 2100
- 103,363 · +13.1%
Race, ethnicity, and origin ACS 2023
- Neighborhood character
- Predominantly White (92%)
- Race & ethnicity
- White 92% Two or more races 3% Hispanic / Latino 3% Black 2%
- Common ancestry
- Slovak 5% Italian 3% Romanian 3%
- Foreign-born
- 4% · Canada
- Languages at home
- 96% English-only · Spanish 2% French/Haitian/Cajun 1%
Political lean MEDSL · Glynn
- 2024 margin
- Strong R (+26.0) · D 36.8% · R 62.8%
- 2008→2024 swing
- -2.6pp toward R · 2008: -23.4pp · 2024: -26.0pp
- All cycles
- 2024: R+26.0 2020: R+23.2 2016: R+28.6 2012: R+27.0 2008: R+23.4
Not yet ingested
- Civics
- —
Market trends
- HPI YoY
- ▼ -564.58%
- Current HPI
- 191.6942
- Rent YoY
- ▲ 2.26%
- Metro
- Brunswick, GA
- State GDP YoY
- ▲ 2.66%
- F500 in state
- 28
Industry mix (Fortune 500 HQ in GA)
| Industry | F500 HQs | Revenue |
|---|---|---|
| Paper / Packaging | 2 | $29B |
|
||
| Retail | 1 | $160B |
|
||
| Transportation / Logistics | 1 | $91B |
|
||
| Airlines | 1 | $62B |
|
||
| Consumer Goods | 1 | $47B |
|
||
| Utilities | 1 | $25B |
|
||
Price history
+50.7% since first listed14 events — show timeline
- 2026-03-18 Listed $339,000 GIAR
- 2025-09-18 Price Changed $355,000 GIAR
- 2025-07-31 Price Changed $365,000 GIAR
- 2023-08-16 Sold (Public Records) $315,000 Public Records
- 2023-08-15 Sold (MLS) $315,000 GIAR
- 2023-07-29 Pending — GIAR
- 2023-07-19 Relisted — GIAR
- 2023-07-12 Contingent — GIAR
- 2023-06-24 Price Changed $330,000 GIAR
- 2023-05-15 Price Changed $340,000 GIAR
- 2023-02-27 Listed $365,000 GIAR
- 2013-09-24 Sold (Public Records) $137,000 Public Records
- 2009-10-22 Listing Removed — GIAR
- 2009-01-30 Listed $225,000 GIAR
Property tax history
+8.3%/yrLatest (2025): $3,014 · +0.0% YoY. Source: county tax records.
Cash-flow waterfall
monthlySold comps — $/sqft
last 12 mo · ≤1 miLoading sold comps…