2098 60th Street Drive Dr · Vinton, IA
Flood risk 1/10 · Minimal
- FEMA flood zone
- X (unshaded)
- Chance of flooding over 30 yrs
- 0.0%
- Est. flood insurance / yr
- $473 – $860
Fire risk 1/10 · Minimal
- Est. fire insurance / yr
- $902 – $1,676
Heat risk 2/10 · Minimal
- Hot days now (above 103°F)
- 7 days/yr
- Hot days in 30 yrs
- 15 days/yr
Wind risk 2/10 · Minimal
- Chance of severe wind over 30 yrs
- —
Air-quality risk 2/10 · Minimal
- Unhealthy air days now
- 0 days/yr
- Unhealthy air days in 30 yrs
- 1 days/yr
Risk factors via First Street. Map © Google.
Why this score? — see what drove the D grade
The composite is a weighted blend of 9 inputs, each scored 0–100. Each bar is that input's sub-score; the figure is the points it added to the 100-point composite (weight × sub-score).
- Cash flow +13.9/30.0
- ARV discount +7.5/15.0
- Schools +6.6/10.0
- DSCR +4.2/10.0
- Livability +4.0/5.0
- 1% rule +3.9/10.0
- Rent growth +2.5/5.0
- Condition / age +1.0/5.0
- Appreciation +0.0/10.0
$119,000
🖨 Deal sheet 📄 Offer letter ✓ Due diligence
Listing remarks MLS
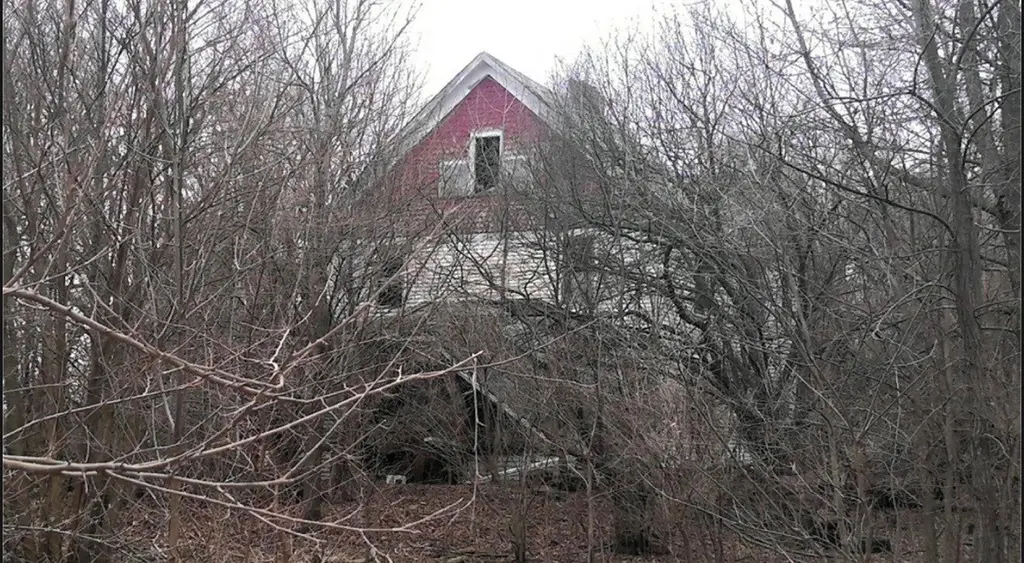
Great investment property! A secluded 5.24 acres with the possibility of building your dream home. When viewing property, please enter at your own risk and park on the road.
Key facts
- 5.24 acre lot
- Built 1900
- Listed 67 days
Neighborhood map
What this means for you Summary
Snapshot
- This is a 4-bed/1.5-bath single-family listed at $119k. Condition is rated poor.
Deal economics
- At list price, monthly cash flow is $14 ($164/yr) — positive.
- The deal already cash-flows at list — no discount required.
- To meet the 1% rule (rent ≥ 1% of price), the offer needs to be $106k (11.1% below list).
- Recommended offer: $106k (11.1% below list) — sets the bar for 1% rule.
- Cap rate 6.4% vs local median 1.9% in Vinton — top-decile yield for the area; either an underpriced asset or a hidden risk that comps aren't pricing in. Stress-test before assuming the spread holds.
Location & tenants
- Location reads 80/100 on livability (#88 in IA, #1,848 nationally) — a professional / high-income tenant draw. Strengths: schools A+, crime A+, cost of living A+; Watch: employment C-, amenities F, commute F.
- Vinton-Shellsburg Community School District (rural): math 79% / reading 77% proficiency, ranked #43 of 289 in IA (top 15%) — strong family-tenant draw, lease renewals of 3-5y typical.
- Market conditions: 61 active listings in the ZIP; 34 units permitted in Benton County in 2024 (0 in 5+ unit buildings).
Forward outlook
- Local home prices are declining (-3.0%/yr); year-one equity from $823 of loan paydown is wiped out by about $4k of value loss. Plan a longer hold.
- Benton County population projected at -13% by 2050 — secular population decline; favor cash flow + early exit over multi-decade hold.
Negotiation context
- It's been on market 68 days — a 6% lower offer ($112k) is reasonable based on typical stale-listing flexibility.
- 4 sale attempts with the ask held roughly flat each time — persistent listings suggest the price (not the market) is what's stuck; bring a comps-based counter.
Risks & watch-outs
- Watch-outs: built in 1900 — expect roof / HVAC / electrical / plumbing capex.
Questions for the listing agent
- It's been on market 68 days. Have you received any prior offers? Is the seller open to a 11% concession, seller financing, or rate buy-down credit?
- Have any recent inspections been done? Can we get a copy of the seller's disclosures and any deferred-maintenance estimates?
- Built in 1900 — when were the roof, HVAC, electrical panel, plumbing, and water heater last replaced?
- Why hasn't it sold? Are there any deal-killer items the seller is aware of (foundation, flood, title, zoning, code violations)?
- Is there a deadline driving the sale (1031 exchange, divorce, estate, relocation)? That informs how much negotiation room exists.
- Schools are A-rated — typically a magnet for longer-tenancy family renters. What's the average tenant stay here, and is there a school-zone premium baked into asking?
- The area grade is low — what's the realistic commute time and amenity access for the typical tenant pool here? Any planned neighborhood developments (good or bad) we should know about?
- What's the average days-on-market for RENTAL listings here right now (not sales)? A rising rental-DOM trend means longer vacancies and softer asking-rent achievability than the comps imply.
- What's the recent tenant-quality profile in this submarket — average credit score on applications, eviction rate, late-payment / NSF rate, and stable-employment percentage? A property-management company in the area should have these aggregated.
- How much new for-sale + rental construction is in the pipeline within 1–3 miles? Heavy new supply typically softens prices + rents 12–24 months out; constrained supply supports both.
Investment metrics
- 1% rule
- 0.89% ✗
- Cap rate
- 6.43%
- Cash-on-cash
- 0.49%
- DSCR
- 1.02
- GRM
- 9.4
CMA / ARV
- ARV (median comp)
- $605,000
- List price
- $119,000
- Delta
- -80.33%
- Verdict
- UNDERPRICED
- Comps
- 1 within 2.0 mi
Projected returns pro-forma
-3.0% appreciation · 3.0% rent growth · sell at horizon
- IRR
- -15.5%
- Equity multiple
- 0.45×
- Total profit
- $-18,396
- Equity at exit
- $17,743
- IRR
- -7.0%
- Equity multiple
- 0.55×
- Total profit
- $-14,832
- Equity at exit
- $10,289
Cash invested: $33,320 (down + closing). Projections, not guarantees.
Landlord ↔ Tenant lean methodology
- Overall (STATE)
- 83 Strongly Landlord-Friendly
- State Iowa
- 83 Strongly Landlord-Friendly · R+6
- County
- — inherits STATE
- City
- — inherits STATE
ZIP-level market 52349
- Home prices YoY
- -29.0%
- Active inventory
- 61
- Price-to-rent
- 9.4×
Monthly cashflow live
- Estimated rent
- $1,058 medium interval (Pro) →
- Mortgage (P&I)
- −$624
- Tax est. 1.5%
- −$149 /mo · $1,785/yr
- Insurance
- −$50
- HOA
- −$0
- Vacancy / Maint / Mgmt
- −$222
- Net cashflow
- $14
Break-even live
UW: 25.0% down · 7.5% · 30yr · 1.5% tax · 5.0% vac · 8.0% maint · 8.0% mgmt
Financing live
Cash to close
- Down payment
- $29,750
- Closing costs
- $3,570
- Reserves months
- —
- Total cash needed
- —
Loan-product check · same deal, 3 products live
Conventional
25% down · 7.5% · 30yr
- Down + closing
- —
- Monthly P&I
- —
- Monthly cashflow
- —
- DSCR
- —
- Eligible?
- —
Personal DTI + credit; lowest rate.
DSCR
20% down · 8.5% · 30yr
- Down + closing
- —
- Monthly P&I
- —
- Monthly cashflow
- —
- DSCR
- —
- Eligible?
- —
No personal income docs; deal must DSCR.
Hard money
10% down · 12.0% · 12mo
- Down + closing
- —
- Monthly P&I
- —
- Monthly cashflow
- —
- DSCR
- —
- Eligible?
- —
Short-term bridge; refi at stabilization.
Listing history 21 events
-
2026-06-18days on market $119,000 Active 68 DOM
-
2026-06-17days on market $119,000 Active 67 DOM
-
2026-06-16days on market $119,000 Active 66 DOM
-
2026-06-15days on market $119,000 Active 65 DOM
-
2026-06-13days on market $119,000 Active 63 DOM
-
2026-06-12days on market $119,000 Active 62 DOM
-
2026-06-09days on market $119,000 Active 59 DOM
-
2026-06-08days on market $119,000 Active 58 DOM
-
2026-06-07days on market $119,000 Active 57 DOM
-
2026-06-07days on market $119,000 Active 56 DOM
-
2026-06-04days on market $119,000 Active 53 DOM
-
2026-06-02days on market $119,000 Active 52 DOM
-
2026-06-01days on market $119,000 Active 51 DOM
-
2026-05-31days on market $119,000 Active 50 DOM
-
2026-05-31days on market $119,000 Active 49 DOM
-
2026-05-12status Active 173-char remark
Show marketing remark (173 chars)
Great investment property! A secluded 5.24 acres with the possibility of building your dream home. When viewing property, please enter at your own risk and park on the road.
-
2026-05-12status Active 173-char remark
Show marketing remark (173 chars)
Great investment property! A secluded 5.24 acres with the possibility of building your dream home. When viewing property, please enter at your own risk and park on the road.
-
2026-03-14status Pending 173-char remark
Show marketing remark (173 chars)
Great investment property! A secluded 5.24 acres with the possibility of building your dream home. When viewing property, please enter at your own risk and park on the road.
-
2026-03-14status Pending 173-char remark
Show marketing remark (173 chars)
Great investment property! A secluded 5.24 acres with the possibility of building your dream home. When viewing property, please enter at your own risk and park on the road.
-
2026-02-12$119,000 Active 173-char remark
Show marketing remark (173 chars)
Great investment property! A secluded 5.24 acres with the possibility of building your dream home. When viewing property, please enter at your own risk and park on the road.
-
2026-02-12$119,000 Active 173-char remark
Show marketing remark (173 chars)
Great investment property! A secluded 5.24 acres with the possibility of building your dream home. When viewing property, please enter at your own risk and park on the road.
ⓘ Source: listings_history table (triggers on properties + properties_extension) + one-shot
backfill from property_details.listing_events for pre-trigger history.
Climate risk First Street
- Flood 1/10 Low FEMA zone X (unshaded) · 0% chance over 30 yrs
- Wildfire 1/10 Low
- Heat 2/10 Low 7 d/yr ≥103°F today · 15 d/yr by 30 yrs out
- Wind 2/10 Low
- Air quality 2/10 Low 0 unhealthy d/yr today · 1 by 30 yrs out
Nearby sold comps map
Loading sold comps map…
Walkable amenities ~0.75 mi
Loading nearby amenities…
Taxation est. · year 1
- Rental income
- $12,700
- − Mortgage interest
- −$6,666
- − Property taxes
- −$1,785
- − Insurance
- −$595
- − Repairs & maintenance
- −$1,016
- − Management
- −$1,016
- − Depreciation
- −$3,462
- Taxable loss
- −$1,840
- Est. tax savings @ 24.0%
- +$442
- After-tax cash flow
- $606/yr
For passive investors: Depreciation is non-cash, so a rental often shows a tax loss while cash-flowing — sheltering income. Rental losses are passive: they offset passive income freely, and up to $25,000/yr can offset ordinary (W-2) income if you actively participate and your MAGI is under $100k (phasing out to $0 by $150k); unused losses carry forward. On sale, claimed depreciation is recaptured at up to 25%, and gains may owe capital-gains tax (a 1031 exchange can defer both). Figures are a year-1 estimate at your 24.0% rate — not tax advice; consult a CPA.
Condition & rehab AI · 3 photos
This property is in a state of abandonment and requires extensive repairs and maintenance to be considered habitable.
Repairs flagged
- Major roof — Structural damage or missing roof
- Major exterior siding — Overgrown vegetation and possible structural issues
- Major interior walls — No visible interior
- Major flooring — No visible interior
- Major HVAC/mechanicals — No visible interior
Value-add opportunities
- Both Clear overgrown vegetation and assess roof and exterior for structural integrity — Improves safety and curb appeal
- Both Inspect interior for structural damage and assess HVAC systems — Improves safety and functionality
- Both Repair or replace roof and siding — Improves safety and curb appeal
- Both Replace flooring and interior walls — Improves safety and functionality
- Both Install new HVAC system — Improves safety and functionality
Renovation cost estimate screening
| Repair item | Severity | Est. cost |
|---|---|---|
| roof · Structural damage or missing roof | Major | $15,000–50,000 |
| exterior siding · Overgrown vegetation and possible structural issues | Major | $15,000–50,000 |
| interior walls · No visible interior | Major | $15,000–50,000 |
| flooring · No visible interior | Major | $15,000–50,000 |
| HVAC/mechanicals · No visible interior | Major | $15,000–50,000 |
| Total estimated repair cost · 5 items | $75,000–250,000 |
Value-add ROI direction
- Both Clear overgrown vegetation and assess roof and exterior for structural integrity — Improves safety and curb appeal ↑
- Both Inspect interior for structural damage and assess HVAC systems — Improves safety and functionality ↑
- Both Repair or replace roof and siding — Improves safety and curb appeal ↑
- Both Replace flooring and interior walls — Improves safety and functionality ↑
- Both Install new HVAC system — Improves safety and functionality ↑
ⓘ Cost ranges are severity-bucket heuristics (US national rule-of-thumb). Get contractor quotes + a written scope before underwriting a rehab budget.
Schools (NCES district)
- District
- Vinton-Shellsburg Community School District
- NCES district ID
- 1929310
- Math proficiency
- 79% ▼ -6.00%
- Reading proficiency
- 77% ▼ -1.00%
- Median HH income
- $52,023
- Composite
- 66.21/100
- National rank
- #430
- State rank
- #43 of 289 in IA
Livability — Vinton
- Score
- 80/100
- State rank
- #88
- US rank
- #1848
Category grades
Schools grade is shown separately in the Schools card above.
Census & demographics
- Population (ZIP)
- 7,745
Population outlook (Benton County) Hauer SSP2
- Today (2025)
- 25,078 people
- By 2030
- 24,606 · -1.9%
- By 2040
- 23,425 · -6.6%
- By 2050
- 21,891 · -12.7%
- By 2075
- 19,482 · -22.3%
- By 2100
- 17,139 · -31.7%
Race, ethnicity, and origin ACS 2023
- Neighborhood character
- Predominantly White (94%)
- Race & ethnicity
- White 94% Two or more races 4% Hispanic / Latino 2%
- Common ancestry
- Portuguese 7% Italian 3% Iranian 3%
- Foreign-born
- 1% · Canada
- Languages at home
- 96% English-only · German/W. Germanic 2% Spanish 2%
Political lean MEDSL · Benton
- 2024 margin
- Solid R (+33.2) · D 32.8% · R 66.0% · Other 1.3%
- 2008→2024 swing
- -37.7pp toward R · 2008: 4.5pp · 2024: -33.2pp
- All cycles
- 2024: R+33.2 2020: R+27.5 2016: R+26.0 2012: R+0.6 2008: D+4.5
Not yet ingested
- Civics
- —
Market trends
- HPI YoY
- ▼ -80.56%
- Current HPI
- 197.3164
- Rent YoY
- —
- Metro
- —
- State GDP YoY
- ▲ 2.48%
- F500 in state
- 4
Industry mix (Fortune 500 HQ in IA)
| Industry | F500 HQs | Revenue |
|---|---|---|
| Financial Services | 1 | $16B |
|
||
| Retail / Convenience | 1 | $15B |
|
||
Price history
+0.0% since first listed6 events — show timeline
- 2026-05-12 Relisted — CRAAR, CDRMLS
- 2026-05-12 Relisted — NEIRBR as distributed by MLS GRID
- 2026-03-14 Pending — CRAAR, CDRMLS
- 2026-03-14 Pending — NEIRBR as distributed by MLS GRID
- 2026-02-12 Listed $119,000 NEIRBR as distributed by MLS GRID
- 2026-02-12 Listed $119,000 CRAAR, CDRMLS
Cash-flow waterfall
monthlySold comps — $/sqft
last 12 mo · ≤1 miLoading sold comps…