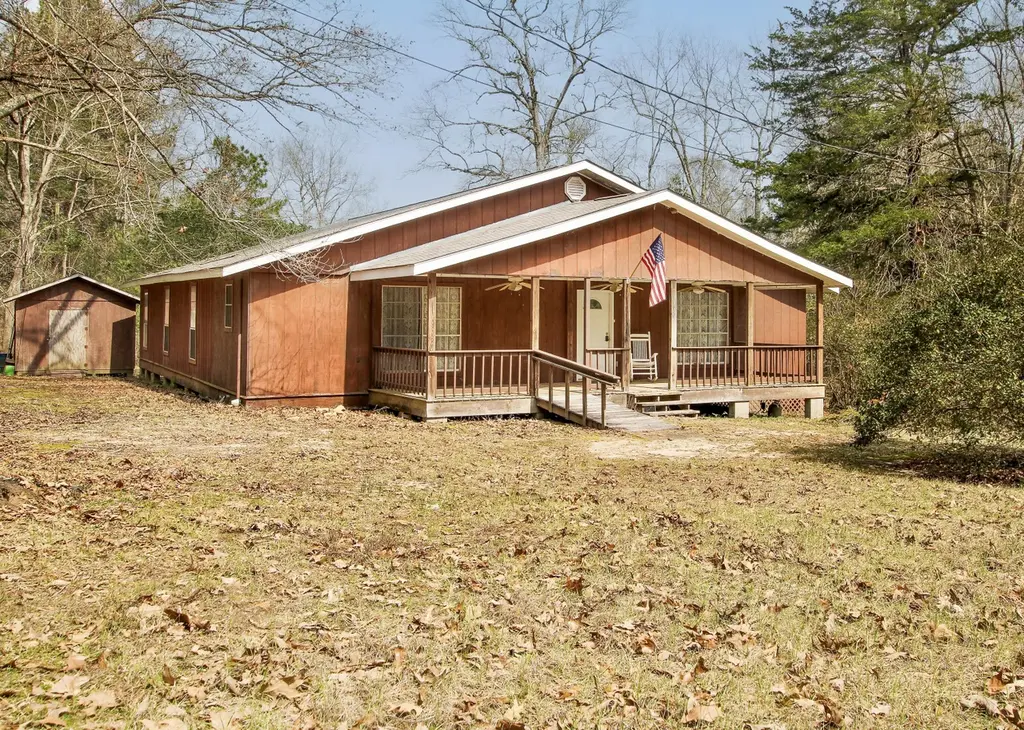
190 Roberts Acres Rd · Leesville, LA
Flood risk 1/10 · Minimal
- FEMA flood zone
- X (unshaded)
- Chance of flooding over 30 yrs
- 0.0%
- Est. flood insurance / yr
- $507 – $1,088
Fire risk 4/10 · Minor
- Est. fire insurance / yr
- $1,269 – $2,357
Heat risk 7/10 · Major
- Hot days now (above 110°F)
- 7 days/yr
- Hot days in 30 yrs
- 20 days/yr
Wind risk 8/10 · Major
- Chance of severe wind over 30 yrs
- 99.0%
Air-quality risk 1/10 · Minimal
- Unhealthy air days now
- 0 days/yr
- Unhealthy air days in 30 yrs
- 0 days/yr
Risk factors via First Street. Map © Google.
Why this score? — see what drove the D- grade
The composite is a weighted blend of 9 inputs, each scored 0–100. Each bar is that input's sub-score; the figure is the points it added to the 100-point composite (weight × sub-score).
- ARV discount +11.1/15.0
- Cash flow +8.9/30.0
- Rent growth +4.9/5.0
- Livability +3.7/5.0
- Schools +3.6/10.0
- 1% rule +2.7/10.0
- DSCR +2.5/10.0
- Condition / age +2.5/5.0
- Appreciation +0.0/10.0
$205,000
🖨 Deal sheet 📄 Offer letter ✓ Due diligence
Listing remarks MLS
Back on the market with a huge drop in price, this spacious home has much to offer including privacy as it's at the end of a dead end street with only two neighbors.
Key facts
- Privacy
- 3.18 acre lot
- Built 1955
Tags
Neighborhood map
What this means for you Summary
Snapshot
- This is a 3-bed/2.0-bath single-family listed at $205k.
Deal economics
- At list price, monthly cash flow is $-166 ($-2k/yr) — negative.
- To cash-flow at today's rent, offer at most $181k (11.7% below list).
- To meet the 1% rule (rent ≥ 1% of price), the offer needs to be $158k (22.8% below list).
- Recommended offer: $158k (22.8% below list) — sets the bar for 1% rule.
- Cap rate 5.3% vs local median 7.3% in Leesville — below-typical yield; the buyer is paying a premium for something (appreciation thesis, condition, location) that the cap rate doesn't capture.
Location & tenants
- Location reads 73/100 on livability (#30 in LA) — a middle-class / working-renter tenant base. Strengths: cost of living A+, health & safety A+, housing A; Watch: crime F, amenities F, commute F.
- Vernon Parish (rural): math 35% / reading 51% proficiency, ranked #18 of 98 in LA (top 18%) — families likely to look elsewhere, expect single-tenant / working-renter base with shorter leases.
- Market conditions: Rents rising fast (+9.6%/yr); 210 active listings in the ZIP; 1 comparable units currently listed for rent nearby; 26 units permitted in Vernon Parish in 2024 (0 in 5+ unit buildings).
- This rent runs 34% of the median local income ($56k/yr) — at the standard rent-burdened threshold; future hikes will face affordability resistance.
Forward outlook
- Local home prices are declining (-3.0%/yr); year-one equity from $1k of loan paydown is wiped out by about $6k of value loss. Plan a longer hold.
- Vernon County population projected at -25% by 2050 — secular population decline; favor cash flow + early exit over multi-decade hold.
Negotiation context
- It's been on market 163 days — a 12% lower offer ($180k) is reasonable based on typical stale-listing flexibility.
Risks & watch-outs
- Watch-outs: built in 1955 — expect roof / HVAC / electrical / plumbing capex.
- Climate carrying-cost: severe wind risk, 99% chance of damaging wind over 30y; extreme-heat days projected 7→20/yr by 2055 (HVAC capex compounding) — expect insurance premiums to compound above CPI over the hold.
Questions for the listing agent
- What do current leases actually rent for vs. the listed asking? Can we see a recent rent roll and the last 12 months of T-12 income?
- It's been on market 163 days. Have you received any prior offers? Is the seller open to a 23% concession, seller financing, or rate buy-down credit?
- Built in 1955 — when were the roof, HVAC, electrical panel, plumbing, and water heater last replaced?
- Why hasn't it sold? Are there any deal-killer items the seller is aware of (foundation, flood, title, zoning, code violations)?
- Is there a deadline driving the sale (1031 exchange, divorce, estate, relocation)? That informs how much negotiation room exists.
- Schools are B-rated — typically a magnet for longer-tenancy family renters. What's the average tenant stay here, and is there a school-zone premium baked into asking?
- Crime grade is F in this area — have there been break-ins, vandalism, or insurance claims at this property in the last 3 years? What carrier currently insures it and at what premium?
- The area grade is low — what's the realistic commute time and amenity access for the typical tenant pool here? Any planned neighborhood developments (good or bad) we should know about?
- What's the average days-on-market for RENTAL listings here right now (not sales)? A rising rental-DOM trend means longer vacancies and softer asking-rent achievability than the comps imply.
- What's the recent tenant-quality profile in this submarket — average credit score on applications, eviction rate, late-payment / NSF rate, and stable-employment percentage? A property-management company in the area should have these aggregated.
- How much new for-sale + rental construction is in the pipeline within 1–3 miles? Heavy new supply typically softens prices + rents 12–24 months out; constrained supply supports both.
Investment metrics
- 1% rule
- 0.77% ✗
- Cap rate
- 5.32%
- Cash-on-cash
- -3.48%
- DSCR
- 0.85
- GRM
- 10.8
CMA / ARV
- ARV (median comp)
- $223,041
- List price
- $205,000
- Delta
- -8.09%
- Verdict
- FAIR
- Comps
- 19 within 1.0 mi
Show comp detail 2 sales within ~0.75 mi
| Address | Dist | Beds/Ba | Sqft | Sold | Price | $/sf | Match |
|---|---|---|---|---|---|---|---|
| 216 Harper St | 0.48mi | 4/2.5 (+1) | 2,450 (-8%) | 6mo | $278,000 | $113 | 52 |
| 113 Jennifer Dr | 0.65mi | 4/3.0 (+1) | 2,511 (-6%) | 20mo | $249,500 | $99 | 35 |
Match score weights: distance 35% · size 25% · config 20% · recency 20%. Top-matched comps best support the ARV.
Projected returns pro-forma
-3.0% appreciation · 8.0% rent growth · sell at horizon
- IRR
- -16.7%
- Equity multiple
- 0.38×
- Total profit
- $-35,427
- Equity at exit
- $30,566
- IRR
- -1.3%
- Equity multiple
- 0.89×
- Total profit
- $-6,328
- Equity at exit
- $17,725
Cash invested: $57,400 (down + closing). Projections, not guarantees.
Landlord ↔ Tenant lean methodology
- Overall (STATE)
- 90 Strongly Landlord-Friendly
- State Louisiana
- 90 Strongly Landlord-Friendly · R+12
- County
- — inherits STATE
- City
- — inherits STATE
ZIP-level market 71446
- Home prices YoY
- -32.1%
- Rents YoY
- 9.6%
- Active inventory
- 210
- Price-to-rent
- 10.8×
Monthly cashflow live
- Estimated rent
- $1,583 medium interval (Pro) →
- Mortgage (P&I)
- −$1,075
- Tax est. 1.5%
- −$256 /mo · $3,075/yr
- Insurance
- −$85
- HOA
- −$0
- Vacancy / Maint / Mgmt
- −$332
- Net cashflow
- $-166
Break-even live
UW: 25.0% down · 7.5% · 30yr · 1.5% tax · 5.0% vac · 8.0% maint · 8.0% mgmt
Financing live
Cash to close
- Down payment
- $51,250
- Closing costs
- $6,150
- Reserves months
- —
- Total cash needed
- —
Loan-product check · same deal, 3 products live
Conventional
25% down · 7.5% · 30yr
- Down + closing
- —
- Monthly P&I
- —
- Monthly cashflow
- —
- DSCR
- —
- Eligible?
- —
Personal DTI + credit; lowest rate.
DSCR
20% down · 8.5% · 30yr
- Down + closing
- —
- Monthly P&I
- —
- Monthly cashflow
- —
- DSCR
- —
- Eligible?
- —
No personal income docs; deal must DSCR.
Hard money
10% down · 12.0% · 12mo
- Down + closing
- —
- Monthly P&I
- —
- Monthly cashflow
- —
- DSCR
- —
- Eligible?
- —
Short-term bridge; refi at stabilization.
Rent comps 1 comps
| Address | Beds | Baths | Sqft | Rent | $/sqft | DOM | Units | Dist |
|---|---|---|---|---|---|---|---|---|
| 1219 Port Arthur Ter Leesville, LA | 3.0 | 2.0 | 1800 | $1,400 | $0.78 | 44d | 1 | 1.29mi |
Listing history 21 events
-
2026-06-19days on market $205,000 Active 163 DOM
-
2026-06-18days on market $205,000 Active 162 DOM
-
2026-06-17days on market $205,000 Active 161 DOM
-
2026-06-16days on market $205,000 Active 160 DOM
-
2026-06-15days on market $205,000 Active 159 DOM
-
2026-06-14days on market $205,000 Active 157 DOM
-
2026-06-12days on market $205,000 Active 156 DOM
-
2026-06-09days on market $205,000 Active 153 DOM
-
2026-06-08days on market $205,000 Active 152 DOM
-
2026-06-07days on market $205,000 Active 151 DOM
-
2026-06-07days on market $205,000 Active 150 DOM
-
2026-06-04days on market $205,000 Active 147 DOM
-
2026-06-02days on market $205,000 Active 146 DOM
-
2026-06-01days on market $205,000 Active 145 DOM
-
2026-05-31days on market $205,000 Active 144 DOM
-
2026-05-31days on market $205,000 Active 143 DOM
-
2026-04-08price $205,000 165-char remark
Show marketing remark (165 chars)
Back on the market with a huge drop in price, this spacious home has much to offer including privacy as it's at the end of a dead end street with only two neighbors.
-
2026-03-04price $210,000 165-char remark
Show marketing remark (165 chars)
Back on the market with a huge drop in price, this spacious home has much to offer including privacy as it's at the end of a dead end street with only two neighbors.
-
2026-01-07$235,900 Active 165-char remark
Show marketing remark (165 chars)
Back on the market with a huge drop in price, this spacious home has much to offer including privacy as it's at the end of a dead end street with only two neighbors.
-
2025-07-29price $270,000
-
2025-05-01price $285,000
ⓘ Source: listings_history table (triggers on properties + properties_extension) + one-shot
backfill from property_details.listing_events for pre-trigger history.
Climate risk First Street
- Flood 1/10 Low FEMA zone X (unshaded) · 0% chance over 30 yrs
- Wildfire 4/10 Moderate
- Heat 7/10 Severe 7 d/yr ≥110°F today · 20 d/yr by 30 yrs out
- Wind 8/10 Severe 99% chance of damaging wind over 30 yrs
- Air quality 1/10 Low 0 unhealthy d/yr today · 0 by 30 yrs out
Nearby sold comps map
Loading sold comps map…
Walkable amenities ~0.75 mi
Loading nearby amenities…
Taxation est. · year 1
- Rental income
- $18,992
- − Mortgage interest
- −$11,483
- − Property taxes
- −$3,075
- − Insurance
- −$1,025
- − Repairs & maintenance
- −$1,519
- − Management
- −$1,519
- − Depreciation
- −$5,964
- Taxable loss
- −$5,593
- Est. tax savings @ 24.0%
- +$1,342
- After-tax cash flow
- $-654/yr
For passive investors: Depreciation is non-cash, so a rental often shows a tax loss while cash-flowing — sheltering income. Rental losses are passive: they offset passive income freely, and up to $25,000/yr can offset ordinary (W-2) income if you actively participate and your MAGI is under $100k (phasing out to $0 by $150k); unused losses carry forward. On sale, claimed depreciation is recaptured at up to 25%, and gains may owe capital-gains tax (a 1031 exchange can defer both). Figures are a year-1 estimate at your 24.0% rate — not tax advice; consult a CPA.
Schools (NCES district)
- District
- Vernon Parish
- NCES district ID
- 2201830
- Math proficiency
- 35% ▼ -42.00%
- Reading proficiency
- 51% ▼ -32.00%
- Median HH income
- $44,822
- Composite
- 36.42/100
- National rank
- #4674
- State rank
- #18 of 98 in LA
Livability — Leesville
- Score
- 73/100
- State rank
- #30
- US rank
- #5046
Category grades
Schools grade is shown separately in the Schools card above.
Census & demographics
- Census place
- Leesville, LA
- County
- Vernon Parish · 21,275 people
- City population
- 21,275
- Metro
- Fort Polk South, LA
- Population (ZIP)
- 21,275
- Household income
- $55,925
- Rent vs Own
- Severe rent burden
- 659.0
Population outlook (Vernon County) Hauer SSP2
- Today (2025)
- 45,401 people
- By 2030
- 43,015 · -5.3%
- By 2040
- 38,171 · -15.9%
- By 2050
- 34,087 · -24.9%
- By 2075
- 28,267 · -37.7%
- By 2100
- 25,486 · -43.9%
Race, ethnicity, and origin ACS 2023
- Neighborhood character
- Predominantly White (72%)
- Race & ethnicity
- White 72% Black 16% Hispanic / Latino 6% Two or more races 5% Asian 2% Native American 1%
- Hispanic origin (detail)
- Mexican 3% Puerto Rican 1%
- Common ancestry
- Lithuanian 3% Slovak 1% Romanian 1%
- Foreign-born
- 3% · Canada, South Korea, Vietnam
- Languages at home
- 94% English-only · Spanish 3% French/Haitian/Cajun 1%
Political lean MEDSL · Vernon
- 2024 margin
- Solid R (+67.9) · D 15.6% · R 83.4% · Other 1.0%
- 2008→2024 swing
- -14.5pp toward R · 2008: -53.4pp · 2024: -67.9pp
- All cycles
- 2024: R+67.9 2020: R+64.9 2016: R+65.0 2012: R+57.5 2008: R+53.4
Not yet ingested
- Civics
- —
Market trends
- HPI YoY
- ▼ -61.06%
- Current HPI
- 128.8849
- Rent YoY
- ▲ 9.60%
- Metro
- Fort Polk South, LA
- State GDP YoY
- ▲ 3.29%
- F500 in state
- 10
Industry mix (Fortune 500 HQ in LA)
| Industry | F500 HQs | Revenue |
|---|---|---|
| Telecommunications | 2 | $23B |
|
||
| Utilities | 1 | $12B |
|
||
| Wholesale / Distribution | 1 | $5B |
|
||
| Advertising | 1 | $2B |
|
||
Price history
-28.1% since first listed5 events — show timeline
- 2026-04-08 Price Changed $205,000 GFPAR
- 2026-03-04 Price Changed $210,000 GFPAR
- 2026-01-07 Listed $235,900 GFPAR
- 2025-07-29 Price Changed $270,000 GFPAR
- 2025-05-01 Price Changed $285,000 GFPAR
Cash-flow waterfall
monthlySold comps — $/sqft
last 12 mo · ≤1 miLoading sold comps…