4940 Cougar Ct S #104 · Pelican Marsh, FL
Flood risk 2/10 · Minimal
- FEMA flood zone
- X (unshaded)
- Chance of flooding over 30 yrs
- 0.03%
- Est. flood insurance / yr
- $507 – $1,088
Fire risk 1/10 · Minimal
- Est. fire insurance / yr
- $947 – $1,759
Heat risk 10/10 · Severe
- Hot days now (above 107°F)
- 7 days/yr
- Hot days in 30 yrs
- 30 days/yr
Wind risk 10/10 · Severe
- Chance of severe wind over 30 yrs
- 99.0%
Air-quality risk 2/10 · Minimal
- Unhealthy air days now
- 1 days/yr
- Unhealthy air days in 30 yrs
- 1 days/yr
Risk factors via First Street. Map © Google.
Why this score? — see what drove the D grade
The composite is a weighted blend of 9 inputs, each scored 0–100. Each bar is that input's sub-score; the figure is the points it added to the 100-point composite (weight × sub-score).
- Cash flow +9.8/30.0
- ARV discount +7.5/15.0
- Appreciation +5.1/10.0
- Schools +5.0/10.0
- 1% rule +3.5/10.0
- DSCR +2.8/10.0
- Rent growth +2.7/5.0
- Livability +2.5/5.0
- Condition / age +2.5/5.0
$369,000
🖨 Deal sheet (PDF) 📄 Offer letter ✓ Due diligence
Listing remarks MLS
C6900-Enjoy lake and preserve views from this peaceful, southern exposure, 2 Bedroom plus den 2 Bath and a garage. Expansive lake views and the privacy of a preserve add positive benefits of this unit. The Community pool and spa are conveniently located nearby. The quality cortex luxury vinyl floors are perfect for pets which can be allowed following approval. The master bathroom vanity offers two sinks, shower and the guest bath contain a shower and tub combo. The kitchen holds a pantry for extra storage with space for dining. There are very few units at this price point available in Naples, west of 75, at this size with your own private garage. Low condo fees which includes exterior insurance, landscape maintenance, irrigation, management, reserves, water, sewer and trash removal. This property is located across from Seed to Table locally sourced produce grocery store with a wine bar, and within a third of a mile of access to I-75. Other local points of interest include restaurants, car wash, Publix, banks, and only a short drive to entertainment and North Collier Regional Park, Veterans Park, Mercato & Naples’ beautiful white sand beaches at Delnor-Wiggins Pass State Park.
Key facts
- Southern exposure
- Lake views
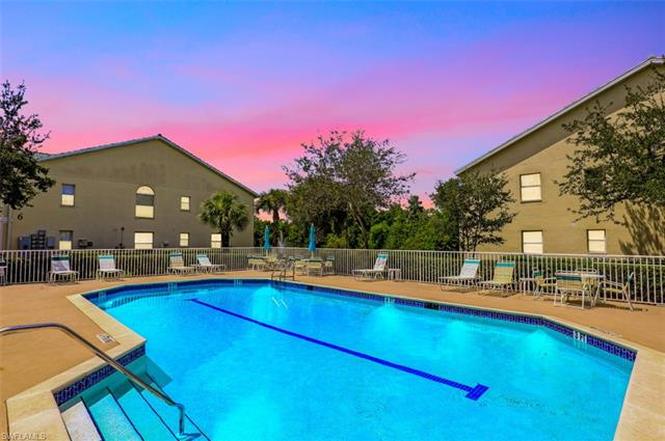
- Community pool
Tags
Property features AI
Finance
- Other: Part of a complex with 80 units and 10 units in the building; One unit per floor; building has 1 floor
- HOA & community: Mandatory HOA with professional management; Quarterly condo fee; Annual recurring fees total $4,800; One-time fees $150; HOA maintenance covers irrigation water, lawn and landscaping, exterior pest control, reserves, trash removal and water; Community amenities include pool, spa/hot tub, streetlights, and underground utilities; Non-gated community
Exterior
- Parking: 1 assigned parking space; Detached 1-car garage
- Utilities: Central water; Central sewer; Cable available
- Home design: Residential property in Bermuda Palms; Low-rise building (1–3 stories); Built in 2004; Rear exposure faces south
- Construction: Concrete block construction; Tile roof; Single hung and sliding windows
- Exterior features: Lakefront with water view and preserve view; Water display; Shutters; Stucco exterior
Interior
- Kitchen: Dishwasher; Disposal; Microwave; Range; Refrigerator/ice maker; Self-cleaning oven; Pantry
- Bedrooms: 2 bedrooms plus den; Master bedroom on ground level
- Flooring: Tile; Vinyl
- Bathrooms: 2 full bathrooms; Master bath with dual sinks and shower
- Heating & cooling: Central electric heat; Central electric cooling; Ceiling fans
- Interior features: Cable prewire; Smoke detectors; Walk-in closet; Window coverings; Pantry; Breakfast bar and eat-in kitchen; Den (study); Screened lanai/porch; Turnkey furnished; Split-bedroom floor plan
- Laundry & utility: Washer and dryer in residence; Auto garage door
Neighborhood map
What this means for you Summary
Snapshot
- This is a 2-bed/2.0-bath condo listed at $369k.
Deal economics
- At list price, monthly cash flow is $-237 ($-3k/yr) — negative.
- To cash-flow at today's rent, offer at most $327k (11.3% below list).
- To meet the 1% rule (rent ≥ 1% of price), the offer needs to be $315k (14.7% below list).
- Recommended offer: $315k (14.7% below list) — sets the bar for 1% rule.
Location & tenants
- Location reads: area grade D — affects rentability + tenant quality, not the cash-flow math above.
- Collier (suburban): math 60% / reading 56% proficiency, ranked #16 of 73 in FL (top 22%) — acceptable for families but not a draw, mixed tenant base, ~2y average lease.
- Zoned schools: Pelican Marsh Elementary School (math 87% / reading 83%, grade A+, #35 of 2,144 statewide, top 2%, 709 students, 29% FRL); North Naples Middle School (math 79% / reading 73%, grade A, #34 of 571 statewide, top 6%, 903 students, 25% FRL); Barron Collier High School (math 62% / reading 68%, grade B, #76 of 667 statewide, top 11%, 1,650 students, 26% FRL) — zoned schools average 27% FRL vs 55% district-wide (28 pts lower); this property's tenant base skews higher-income than the district average.
- Zoned-school proficiency averages 75% at this address vs 58% district-wide (+17 pts) — the actual schools serving this property are materially stronger than the Collier average implies; a family-tenant draw the district grade alone would hide.
- Market conditions: Rents flat; 424 active listings in the ZIP; 40 comparable units currently listed for rent nearby; rentals at typical pace (median 26d on market — plan ~3-4 weeks tenant-placement turnaround); solid renter incomes; 3,520 units permitted in Collier County in 2024 (959 in 5+ unit buildings).
- This rent runs 41% of the median local income ($92k/yr) — at the standard rent-burdened threshold; future hikes will face affordability resistance.
Forward outlook
- In year one you build about $4k of equity ($3k loan paydown + $1k appreciation (0.3% local appreciation)).
- Collier County population projected at +30% by 2050 — long-run rental-demand tailwind backs the buy-and-hold thesis.
- By year 8, paydown + projected appreciation supports a ~$34k cash-out refi (75% LTV) — recoverable capital for the next deal without selling this one.
Negotiation context
- It's been on market 183 days — a 12% lower offer ($325k) is reasonable based on typical stale-listing flexibility.
- 4 sale attempts since 9y ago with the ask held roughly flat each time — persistent listings suggest the price (not the market) is what's stuck; bring a comps-based counter.
Risks & watch-outs
- Climate carrying-cost: severe wind risk, 99% chance of damaging wind over 30y; extreme-heat days projected 7→30/yr by 2055 (HVAC capex compounding) — expect insurance premiums to compound above CPI over the hold.
Questions for the listing agent
- What do current leases actually rent for vs. the listed asking? Can we see a recent rent roll and the last 12 months of T-12 income?
- It's been on market 183 days. Have you received any prior offers? Is the seller open to a 15% concession, seller financing, or rate buy-down credit?
- What does the HOA fee cover, when was the last increase, and are there any pending special assessments or reserve-fund shortfalls?
- Any open or pending special assessments — roof, HVAC, plumbing, elevator, façade? What's the per-unit balance and payoff schedule, and is the seller paying it off at close or rolling it to the buyer?
- Why hasn't it sold? Are there any deal-killer items the seller is aware of (foundation, flood, title, zoning, code violations)?
- Is there a deadline driving the sale (1031 exchange, divorce, estate, relocation)? That informs how much negotiation room exists.
- The area grade is low — what's the realistic commute time and amenity access for the typical tenant pool here? Any planned neighborhood developments (good or bad) we should know about?
- What's the average days-on-market for RENTAL listings here right now (not sales)? A rising rental-DOM trend means longer vacancies and softer asking-rent achievability than the comps imply.
- What's the recent tenant-quality profile in this submarket — average credit score on applications, eviction rate, late-payment / NSF rate, and stable-employment percentage? A property-management company in the area should have these aggregated.
- How much new apartment / multifamily construction is in the pipeline within 1–3 miles? Heavy new supply (>2% of stock underway) typically softens rents 12–24 months out; light construction supports rent growth.
Investment metrics
- 1% rule
- 0.85% ✗
- Cap rate
- 5.52%
- Cash-on-cash
- -2.75%
- DSCR
- 0.88
- GRM
- 9.8
CMA / ARV
No comps found within radius.
Projected returns pro-forma
0.29% appreciation · 0.92% rent growth · sell at horizon
- IRR
- -5.5%
- Equity multiple
- 0.74×
- Total profit
- $-27,021
- Equity at exit
- $112,619
- IRR
- -1.2%
- Equity multiple
- 0.87×
- Total profit
- $-13,409
- Equity at exit
- $139,822
Cash invested: $103,320 (down + closing). Projections, not guarantees.
Landlord ↔ Tenant lean methodology
- Overall (STATE)
- 87 Strongly Landlord-Friendly
- State Florida
- 87 Strongly Landlord-Friendly · R+3
- County
- — inherits STATE
- City
- — inherits STATE
ZIP-level market 34109
- Home prices YoY
- 0.1%
- Rents YoY
- 0.9%
- Active inventory
- 424
- Price-to-rent
- 9.8×
Monthly cashflow live
- Estimated rent
- $3,146 high interval (Pro) →
- Mortgage (P&I)
- −$1,935
- Tax from tax record
- −$233 /mo · $2,800/yr
- Insurance
- −$154
- HOA
- −$400
- Vacancy / Maint / Mgmt
- −$661
- Net cashflow
- $-237
Break-even live
Sensitivity live
| Price | -10% $-28 | -5% $-132 | +0% $-237 | +5% $-341 | +10% $-446 |
|---|---|---|---|---|---|
| Rent | -10% $-485 | -5% $-361 | +0% $-237 | +5% $-112 | +10% $12 |
| Rate | -1.0pp $-51 | -0.5pp $-143 | base $-237 | +0.5pp $-332 | +1.0pp $-430 |
UW: 25.0% down · 7.5% · 30yr · 1.5% tax · 5.0% vac · 8.0% maint · 8.0% mgmt
Financing live
Cash to close
- Down payment
- $92,250
- Closing costs
- $11,070
- Reserves months
- —
- Total cash needed
- —
Loan-product check · same deal, 3 products live
Conventional
25% down · 7.5% · 30yr
- Down + closing
- —
- Monthly P&I
- —
- Monthly cashflow
- —
- DSCR
- —
- Eligible?
- —
Personal DTI + credit; lowest rate.
DSCR
20% down · 8.5% · 30yr
- Down + closing
- —
- Monthly P&I
- —
- Monthly cashflow
- —
- DSCR
- —
- Eligible?
- —
No personal income docs; deal must DSCR.
Hard money
10% down · 12.0% · 12mo
- Down + closing
- —
- Monthly P&I
- —
- Monthly cashflow
- —
- DSCR
- —
- Eligible?
- —
Short-term bridge; refi at stabilization.
Rent comps 40 comps
| Address | Beds | Baths | Sqft | Rent | $/sqft | DOM | Units | Dist |
|---|---|---|---|---|---|---|---|---|
| 4945 Cougar Ct S #105 Naples, FL | 2.0 | 2.0 | 1377 | $2,750 | $2.00 | 15d | 1 | 0.02mi |
| 4940 Cougar Ct S Unit 1545947P Naples, FL | 2.0 | 2.0 | 1367 | $2,185 | $1.60 | 15d | 1 | 0.02mi |
| 4965 Sandra Bay Dr #102 Naples, FL | 2.0 | 2.0 | 1377 | $2,200 | $1.60 | 15d | 1 | 0.04mi |
| 5000 Immokalee Rd Naples, FL | 1.0–3.0 | 1.0–2.0 | 1115 | $3,186 | $2.86 | 15d | 68 | 0.05mi |
| 4910 Cougar Ct N Unit 1-205 Naples, FL | 2.0 | 2.0 | 1377 | $2,050 | $1.49 | 15d | 1 | 0.09mi |
| 4950 Deerfield Way #202 Naples, FL | 2.0 | 2.0 | 1388 | $2,000 | $1.44 | 23d | 1 | 0.20mi |
| 4960 Deerfield Way Unit E102 Naples, FL | 2.0 | 2.0 | 1202 | $4,250 | $3.54 | 15d | 1 | 0.22mi |
| 4680 Saint Croix Ln Naples, FL | 1.0–3.0 | 1.0–2.0 | 931 | $2,000 | $2.15 | 15d | 2 | 0.22mi |
| 4680 Saint Croix Ln #512 Naples, FL | 3.0 | 2.0 | 1196 | $2,490 | $2.08 | 25d | 1 | 0.22mi |
| 4970 Deerfield Way Unit F-203 Naples, FL | 2.0 | 2.0 | 1388 | $1,990 | $1.43 | 15d | 1 | 0.23mi |
| 4710 Saint Croix Ln #217 Naples, FL | 2.0 | 2.0 | 1045 | $2,200 | $2.11 | 25d | 1 | 0.25mi |
| 5045 Cedar Springs Dr #203 Naples, FL | 2.0 | 2.0 | 1427 | $4,200 | $2.94 | 25d | 1 | 0.26mi |
| 5045 Cedar Springs Dr #103 Naples, FL | 2.0 | 2.0 | 1202 | $5,000 | $4.16 | 25d | 1 | 0.26mi |
| 4910 Deerfield Way #103 Naples, FL | 2.0 | 2.0 | 1200 | $4,800 | $4.00 | 23d | 1 | 0.27mi |
| 4910 Deerfield Way Unit A-203 Naples, FL | 2.0 | 2.0 | 1388 | $5,500 | $3.96 | 15d | 1 | 0.27mi |
| 4650 Saint Croix Ln #725 Naples, FL | 2.0 | 2.0 | 913 | $2,150 | $2.35 | 15d | 1 | 0.27mi |
| 5025 Cedar Springs Dr #102 Naples, FL | 2.0 | 2.0 | 1202 | $1,590 | $1.32 | 15d | 1 | 0.28mi |
| 5025 Cedar Springs Dr #102 Naples, FL | 2.0 | 2.5 | 1202 | $3,510 | $2.92 | 25d | 1 | 0.28mi |
| 4720 Saint Croix Ln #137 Naples, FL | 2.0 | 2.0 | 1200 | $2,200 | $1.83 | 25d | 1 | 0.30mi |
| 4620 Saint Croix Ln Naples, FL | 2.0 | 2.0 | 982 | $1,800 | $1.83 | 15d | 2 | 0.30mi |
| 15145 Palmer Lake Cir #103 Naples, FL | 3.0 | 2.0 | 1571 | $7,000 | $4.46 | 25d | 1 | 0.31mi |
| 4610 Saint Croix Ln #1027 Naples, FL | 3.0 | 2.0 | 1196 | $4,000 | $3.34 | 25d | 1 | 0.32mi |
| 4635 Saint Croix Ln #1214 Naples, FL | 2.0 | 2.0 | 913 | $1,900 | $2.08 | 15d | 1 | 0.34mi |
| 15144 Palmer Lake Cir #102 Naples, FL | 2.0 | 2.0 | 1375 | $6,500 | $4.73 | 25d | 1 | 0.34mi |
| 5105 Cedar Springs Dr #101 Naples, FL | 2.0 | 2.0 | 1650 | $7,000 | $4.24 | 25d | 1 | 0.41mi |
| 5145 Cobble Creek Ct #202 Naples, FL | 2.0 | 2.0 | 1798 | $2,600 | $1.45 | 23d | 1 | 0.41mi |
| 15126 Palmer Lake Cir Naples, FL | 2.0–3.0 | 2.0 | 1254 | $3,000 | $2.39 | 25d | 2 | 0.42mi |
| 5330 Andover Dr #102 Naples, FL | 3.0 | 2.0 | 1740 | $2,550 | $1.47 | 25d | 1 | 0.47mi |
| 5325 Andover Dr #101 Naples, FL | 2.0 | 2.0 | 1654 | $5,250 | $3.17 | 25d | 1 | 0.51mi |
| 300 Diamond Cir #302 Naples, FL | 3.0 | 2.0 | 1755 | $2,600 | $1.48 | 25d | 1 | 0.56mi |
| 194 Wickliffe Dr Naples, FL | 3.0 | 2.0 | 1798 | $3,500 | $1.95 | 25d | 1 | 0.57mi |
| 5455 Worthington Ln #103 Naples, FL | 2.0 | 2.0 | 1202 | $5,000 | $4.16 | 25d | 1 | 0.58mi |
| 5455 Worthington Ln #202 Naples, FL | 2.0 | 2.0 | 1427 | $3,900 | $2.73 | 25d | 1 | 0.58mi |
| 5657 Whisperwood Blvd #204 Naples, FL | 2.0 | 2.0 | 1793 | $6,000 | $3.35 | 25d | 1 | 0.59mi |
| 5645 Whisperwood Blvd #504 Naples, FL | 2.0 | 2.0 | 1793 | $6,000 | $3.35 | 25d | 1 | 0.60mi |
| 5632 Whisperwood Blvd #1601 Naples, FL | 3.0 | 2.0 | 1856 | $8,000 | $4.31 | 25d | 1 | 0.62mi |
| 10805 Queen Anne Ln #203 Naples, FL | 2.0 | 2.0 | 1252 | $4,800 | $3.83 | 25d | 1 | 0.65mi |
| 5935 Northridge Dr Naples, FL | 2.0 | 2.0 | 1671 | $2,995 | $1.79 | 25d | 1 | 0.65mi |
| 600 Diamond Cir #607 Naples, FL | 2.0 | 2.0 | 1680 | $4,800 | $2.86 | 25d | 1 | 0.65mi |
| 700 Diamond Cir #706 Naples, FL | 3.0 | 2.0 | 1786 | $2,700 | $1.51 | 25d | 1 | 0.70mi |
HOA detail condo
- Monthly dues
- $400 · $4,800/yr
- Likely covers
- watersewertrashpool
- Assessments
- None detected in remarks — confirm with the listing agent.
Listing history 10 events
-
2026-06-17days on market $369,000 Active 183 DOM
-
2026-06-16days on market $369,000 Active 182 DOM
-
2026-06-15days on market $369,000 Active 181 DOM
-
2026-06-10days on market $369,000 Active 176 DOM
-
2026-06-09days on market $369,000 Active 175 DOM
-
2026-06-08days on market $369,000 Active 174 DOM
-
2026-06-07days on market $369,000 Active 173 DOM
-
2026-06-03days on market $369,000 Active 169 DOM
-
2026-06-03remarks 699-char remark
-
2026-06-03$369,000 Active 168 DOM
ⓘ Source: listings_history table (triggers on properties + properties_extension) + one-shot
backfill from property_details.listing_events for pre-trigger history.
Tax reassessment forecast FL · Resets to sale price
- Current annual tax
- $2,800 · $233/mo
- Projected year-2 tax
- $3,063 · $255/mo
- Expected delta
- +$263/yr (+$22/mo · 9.4%)
ⓘ Screening estimate from a state-policy table — verify with the county assessor before closing.
Climate risk First Street
- Flood 2/10 Low FEMA zone X (unshaded) · 3% chance over 30 yrs
- Wildfire 1/10 Low
- Heat 10/10 Extreme 7 d/yr ≥107°F today · 30 d/yr by 30 yrs out
- Wind 10/10 Extreme 99% chance of damaging wind over 30 yrs
- Air quality 2/10 Low 1 unhealthy d/yr today · 1 by 30 yrs out
Nearby sold comps map
Loading sold comps map…
Walkable amenities ~0.75 mi
Loading nearby amenities…
Taxation est. · year 1
- Rental income
- $37,754
- − Mortgage interest
- −$20,670
- − Property taxes
- −$2,800
- − Insurance
- −$1,845
- − Repairs & maintenance
- −$3,020
- − Management
- −$3,020
- − HOA
- −$4,800
- − Depreciation
- −$10,735
- Taxable loss
- −$9,136
- Est. tax savings @ 24.0%
- +$2,193
- After-tax cash flow
- $-647/yr
For passive investors: Depreciation is non-cash, so a rental often shows a tax loss while cash-flowing — sheltering income. Rental losses are passive: they offset passive income freely, and up to $25,000/yr can offset ordinary (W-2) income if you actively participate and your MAGI is under $100k (phasing out to $0 by $150k); unused losses carry forward. On sale, claimed depreciation is recaptured at up to 25%, and gains may owe capital-gains tax (a 1031 exchange can defer both). Figures are a year-1 estimate at your 24.0% rate — not tax advice; consult a CPA.
Schools (NCES district)
- District
- Collier
- NCES district ID
- 1200330
- Math proficiency
- 60% ▼ -4.00%
- Reading proficiency
- 56% ▼ -2.00%
- Median HH income
- $58,275
- Composite
- 50.23/100
- National rank
- #1892
- State rank
- #16 of 73 in FL
Livability — Pelican Marsh
No livability data for this city. (Only ~50 U.S. cities are tracked.)
Census & demographics
- County
- Collier County · 396,295 people
- Metro
- Naples-Marco Island, FL
- Population (ZIP)
- 27,273
- Household income
- $92,259
- Rent vs Own
- Severe rent burden
- 1712.0
Population outlook (Collier County) Hauer SSP2
- Today (2025)
- 420,858 people
- By 2030
- 450,054 · +6.9%
- By 2040
- 502,232 · +19.3%
- By 2050
- 544,932 · +29.5%
- By 2075
- 627,203 · +49.0%
- By 2100
- 659,015 · +56.6%
Race, ethnicity, and origin ACS 2023
- Neighborhood character
- Predominantly White (78%)
- Race & ethnicity
- White 78% Hispanic / Latino 11% Two or more races 9% Black 4% Asian 4%
- Hispanic origin (detail)
- Mexican 1% Puerto Rican 1% Cuban 3%
- Common ancestry
- Romanian 5% Scotch-Irish 3% Lithuanian 2%
- Foreign-born
- 20% · Canada, Jamaica, Vietnam
- Languages at home
- 77% English-only · Spanish 10% Other Indo-European 5% Russian/Polish/Slavic 3%
Political lean MEDSL · Collier
- 2024 margin
- Solid R (+33.1) · D 33.1% · R 66.2%
- 2008→2024 swing
- -10.6pp toward R · 2008: -22.5pp · 2024: -33.1pp
- All cycles
- 2024: R+33.1 2020: R+24.7 2016: R+26.0 2012: R+30.1 2008: R+22.5
Not yet ingested
- Civics
- —
Market trends
- HPI YoY
- ▲ 0.29%
- Current HPI
- 279.357
- Rent YoY
- ▲ 0.92%
- Metro
- Naples-Marco Island, FL
- State GDP YoY
- ▲ 3.28%
- F500 in state
- 36
Industry mix (Fortune 500 HQ in FL)
| Industry | F500 HQs | Revenue |
|---|---|---|
| Industrial Technology | 2 | $29B |
|
||
| Insurance | 2 | $17B |
|
||
| Retail | 1 | $60B |
|
||
| Technology Distribution | 1 | $58B |
|
||
| Homebuilding | 1 | $35B |
|
||
| Technology Manufacturing | 1 | $35B |
|
||
Price history
+84.6% since first listed12 events — show timeline
- 2025-12-16 Listed $369,000 NAPLESMLS
- 2022-10-18 Sold (Public Records) $369,500 Public Records
- 2022-10-13 Sold (MLS) $369,500 NAPLESMLS
- 2022-08-26 Pending — NAPLESMLS
- 2022-08-22 Listed $369,500 NAPLESMLS
- 2017-12-11 Sold (Public Records) $190,000 Public Records
- 2017-12-08 Sold (MLS) $190,000 NAPLESMLS
- 2017-10-25 Pending — NAPLESMLS
- 2017-10-06 Price Changed $194,000 NAPLESMLS
- 2017-09-03 Relisted — NAPLESMLS
- 2017-08-27 Pending — NAPLESMLS
- 2017-08-04 Listed $199,900 NAPLESMLS
Property tax history
+9.4%/yrLatest (2025): $2,800 · +3.2% YoY. Source: county tax records.
Cash-flow waterfall
monthlySold comps — $/sqft
last 12 mo · ≤1 miLoading sold comps…