29606 Wichita Falls St · The Woodlands, TX
Flood risk 1/10 · Minimal
- FEMA flood zone
- X (unshaded)
- Chance of flooding over 30 yrs
- 0.0%
- Est. flood insurance / yr
- $507 – $1,088
Fire risk 4/10 · Minor
- Est. fire insurance / yr
- $1,222 – $2,270
Heat risk 8/10 · Major
- Hot days now (above 111°F)
- 7 days/yr
- Hot days in 30 yrs
- 24 days/yr
Wind risk 8/10 · Major
- Chance of severe wind over 30 yrs
- 99.0%
Air-quality risk 2/10 · Minimal
- Unhealthy air days now
- 2 days/yr
- Unhealthy air days in 30 yrs
- 2 days/yr
Risk factors via First Street. Map © Google.
Why this score? — see what drove the C- grade
The composite is a weighted blend of 9 inputs, each scored 0–100. Each bar is that input's sub-score; the figure is the points it added to the 100-point composite (weight × sub-score).
- Cash flow +19.8/30.0
- Appreciation +10.0/10.0
- DSCR +6.3/10.0
- 1% rule +5.3/10.0
- Livability +4.5/5.0
- Schools +3.9/10.0
- Rent growth +2.6/5.0
- Condition / age +2.5/5.0
- ARV discount +0.0/15.0
$240,000
🖨 Deal sheet (PDF) 📄 Offer letter ✓ Due diligence
Listing remarks
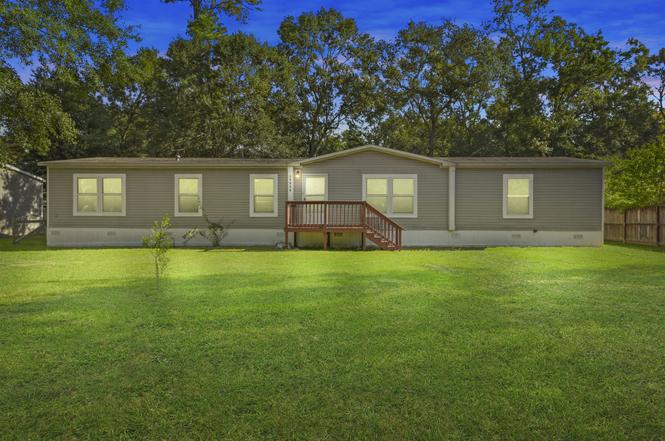
Beautiful 4-bedroom, 2-bath double-wide manufactured home on a 0.34-acre lot with no HOA. Home is in excellent condition with a split floor plan, spacious bedrooms, and an open living area. Fully fenced backyard perfect for outdoor activities. Refrigerator included. Conveniently located steps from the park and minutes from shopping, dining, and The Woodlands. Low tax rate and no MUD tax!
Key facts
- Steps from the park
- 0.34-acre lot
- Minutes from dining
Tags
Property features AI
Exterior
- Parking: No designated parking
- Utilities: Public water; Public sewer
- Home design: Residential property; Full ownership; Single-story layout (all bedrooms on first floor); Entry level: First floor
- Construction: Built in 2020; Pillar/post/pier foundation; Composition roof; Construction materials: Unknown
- Exterior features: Fully fenced private yard; Back-yard fencing; Cleared lot; Subdivision setting
Interior
- Kitchen: Dishwasher; Electric oven; Electric range; Free‑standing range
- Bedrooms: Three first-floor bedrooms (each about 8 x 10); First-floor primary bedroom (about 12 x 15)
- Flooring: Vinyl
- Bathrooms: Two full bathrooms
- Heating & cooling: Central heating (electric); Central air (electric)
- Interior features: Breakfast bar; Kitchen/family room combo
- Laundry & utility: Washer hookup; Electric dryer hookup
Neighborhood map
What this means for you Summary
Snapshot
- This is a 4-bed/2.0-bath manufactured listed at $240k.
Deal economics
- At list price, monthly cash flow is $284 ($3k/yr) — positive.
- The deal already cash-flows at list — no discount required.
- Meets the 1% rule at list price ($2k rent vs $240k).
- Recommended offer: $226k (6.0% below list) — sets the bar for market timing.
- Cap rate 7.7% vs local median 2.3% in The Woodlands — top-decile yield for the area; either an underpriced asset or a hidden risk that comps aren't pricing in. Stress-test before assuming the spread holds.
Location & tenants
- Location reads 91/100 on livability (#1 in TX, #47 nationally) — a professional / high-income tenant draw. Strengths: amenities A+, commute A+, employment A+; Watch: cost of living D-.
- Magnolia ISD (rural): math 42% / reading 45% proficiency, ranked #247 of 826 in TX (top 30%) — families likely to look elsewhere, expect single-tenant / working-renter base with shorter leases.
- Zoned schools: Magnolia Parkway El (math 38% / reading 46%, grade F, #1,335 of 4,322 statewide, top 33%, 776 students, 45% FRL); Bear Branch J H (math 44% / reading 46%, grade D, #479 of 1,662 statewide, top 29%, 1,076 students, 37% FRL); Magnolia H S (math 47% / reading 62%, grade C-, #379 of 1,632 statewide, top 26%, 2,248 students, 31% FRL) — zoned schools at 37% FRL track the district average.
- Market conditions: Rents flat; 1622 active listings in the ZIP; 3 comparable units currently listed for rent nearby; rentals at typical pace (median 26d on market — plan ~3-4 weeks tenant-placement turnaround); high-income renter base; 13,259 units permitted in Montgomery County in 2024 (1,402 in 5+ unit buildings).
Forward outlook
- In year one you build about $26k of equity ($2k loan paydown + $24k appreciation (10.0% local appreciation)).
- Montgomery County population projected at +65% by 2050 — long-run rental-demand tailwind backs the buy-and-hold thesis.
- At projected returns (10.0% appreciation + 0.3% rent growth), your $67k cash investment doubles in ~3 years — after that, you're playing with house money.
- By year 2, paydown + projected appreciation supports a ~$41k cash-out refi (75% LTV) — recoverable capital for the next deal without selling this one.
Negotiation context
- It's been on market 72 days — a 6% lower offer ($226k) is reasonable based on typical stale-listing flexibility.
- 2 sale attempts with the ask held roughly flat each time — persistent listings suggest the price (not the market) is what's stuck; bring a comps-based counter.
Risks & watch-outs
- Climate carrying-cost: severe wind risk, 99% chance of damaging wind over 30y; extreme-heat days projected 7→24/yr by 2055 (HVAC capex compounding) — expect insurance premiums to compound above CPI over the hold.
Questions for the listing agent
- It's been on market 72 days. Have you received any prior offers? Is the seller open to a 6% concession, seller financing, or rate buy-down credit?
- Why hasn't it sold? Are there any deal-killer items the seller is aware of (foundation, flood, title, zoning, code violations)?
- Is there a deadline driving the sale (1031 exchange, divorce, estate, relocation)? That informs how much negotiation room exists.
- Schools are A-rated — typically a magnet for longer-tenancy family renters. What's the average tenant stay here, and is there a school-zone premium baked into asking?
- What's the average days-on-market for RENTAL listings here right now (not sales)? A rising rental-DOM trend means longer vacancies and softer asking-rent achievability than the comps imply.
- What's the recent tenant-quality profile in this submarket — average credit score on applications, eviction rate, late-payment / NSF rate, and stable-employment percentage? A property-management company in the area should have these aggregated.
- How much new for-sale + rental construction is in the pipeline within 1–3 miles? Heavy new supply typically softens prices + rents 12–24 months out; constrained supply supports both.
Investment metrics
- 1% rule
- 1.03% ✓
- Cap rate
- 7.71%
- Cash-on-cash
- 5.07%
- DSCR
- 1.23
- GRM
- 8.1
CMA / ARV
- ARV (on-the-fly)
- $205,632
- Comps found
- 1
Show comp detail 1 sale within ~0.75 mi
| Address | Dist | Beds/Ba | Sqft | Sold | Price | $/sf | Match |
|---|---|---|---|---|---|---|---|
| 29603 Temple St | 0.04mi | 3/2.0 (-1) | 1,856 (-8%) | 12mo | $190,000 | $102 | 70 |
Match score weights: distance 35% · size 25% · config 20% · recency 20%. Top-matched comps best support the ARV.
Projected returns pro-forma
10.0% appreciation · 0.32% rent growth · sell at horizon
- IRR
- 26.9%
- Equity multiple
- 3.12×
- Total profit
- $142,350
- Equity at exit
- $216,211
- IRR
- 22.8%
- Equity multiple
- 6.85×
- Total profit
- $393,325
- Equity at exit
- $466,267
Cash invested: $67,200 (down + closing). Projections, not guarantees.
Landlord ↔ Tenant lean methodology
- Overall (STATE)
- 87 Strongly Landlord-Friendly
- State Texas
- 87 Strongly Landlord-Friendly · R+5
- County
- — inherits STATE
- City
- — inherits STATE
ZIP-level market 77354
- Home prices YoY
- 2.4%
- Rents YoY
- 0.3%
- Active inventory
- 1622
- Price-to-rent
- 8.1×
Monthly cashflow live
- Estimated rent
- $2,463 medium interval (Pro) →
- Mortgage (P&I)
- −$1,259
- Tax from tax record
- −$304 /mo · $3,643/yr
- Insurance
- −$100
- HOA
- −$0
- Vacancy / Maint / Mgmt
- −$517
- Net cashflow
- $284
Break-even live
Sensitivity live
| Price | -10% $420 | -5% $352 | +0% $284 | +5% $216 | +10% $148 |
|---|---|---|---|---|---|
| Rent | -10% $89 | -5% $186 | +0% $284 | +5% $381 | +10% $478 |
| Rate | -1.0pp $405 | -0.5pp $345 | base $284 | +0.5pp $222 | +1.0pp $158 |
UW: 25.0% down · 7.5% · 30yr · 1.5% tax · 5.0% vac · 8.0% maint · 8.0% mgmt
Financing live
Cash to close
- Down payment
- $60,000
- Closing costs
- $7,200
- Reserves months
- —
- Total cash needed
- —
Loan-product check · same deal, 3 products live
Conventional
25% down · 7.5% · 30yr
- Down + closing
- —
- Monthly P&I
- —
- Monthly cashflow
- —
- DSCR
- —
- Eligible?
- —
Personal DTI + credit; lowest rate.
DSCR
20% down · 8.5% · 30yr
- Down + closing
- —
- Monthly P&I
- —
- Monthly cashflow
- —
- DSCR
- —
- Eligible?
- —
No personal income docs; deal must DSCR.
Hard money
10% down · 12.0% · 12mo
- Down + closing
- —
- Monthly P&I
- —
- Monthly cashflow
- —
- DSCR
- —
- Eligible?
- —
Short-term bridge; refi at stabilization.
Rent comps 3 comps
| Address | Beds | Baths | Sqft | Rent | $/sqft | DOM | Units | Dist |
|---|---|---|---|---|---|---|---|---|
| 30314 Ruby Forest Ct Magnolia, TX | 3.0 | 2.0 | 1650 | $2,595 | $1.57 | 45d | 1 | 0.86mi |
| 28618 Hidden Cove Dr Magnolia, TX | 4.0 | 2.5 | 2430 | $2,046 | $0.84 | 14d | 1 | 1.43mi |
| 28603 Hidden Lk W Magnolia, TX | 5.0 | 2.5 | 2478 | $2,446 | $0.99 | 26d | 1 | 1.46mi |
Listing history 25 events
-
2026-06-21days on market $240,000 Active 72 DOM
-
2026-06-18days on market $240,000 Active 69 DOM
-
2026-06-17days on market $240,000 Active 68 DOM
-
2026-06-16days on market $240,000 Active 67 DOM
-
2026-06-15days on market $240,000 Active 66 DOM
-
2026-06-13days on market $240,000 Active 64 DOM
-
2026-06-09days on market $240,000 Active 60 DOM
-
2026-06-08days on market $240,000 Active 59 DOM
-
2026-06-07days on market $240,000 Active 58 DOM
-
2026-06-04days on market $240,000 Active 55 DOM
-
2026-06-03days on market $240,000 Active 54 DOM
-
2026-06-02days on market $240,000 Active 53 DOM
-
2026-06-01days on market $240,000 Active 52 DOM
-
2026-05-31days on market $240,000 Active 51 DOM
-
2026-05-12historical Active Under Contract
-
2026-04-12status Pending
-
2026-04-07status Pending
-
2026-03-11$240,000 Active
-
2026-02-14historical
-
2025-10-16$240,000 Active
-
2025-09-11soldstatus
-
2020-09-18soldstatus
-
2020-09-18soldstatus
-
2020-09-18soldstatus
-
1993-12-01soldstatus
ⓘ Source: listings_history table (triggers on properties + properties_extension) + one-shot
backfill from property_details.listing_events for pre-trigger history.
Tax reassessment forecast TX · Resets to sale price
- Current annual tax
- $3,643 · $304/mo
- Projected year-2 tax
- $4,392 · $366/mo
- Expected delta
- +$749/yr (+$62/mo · 20.5%)
ⓘ Screening estimate from a state-policy table — verify with the county assessor before closing.
Climate risk First Street
- Flood 1/10 Low FEMA zone X (unshaded) · 0% chance over 30 yrs
- Wildfire 4/10 Moderate
- Heat 8/10 Severe 7 d/yr ≥111°F today · 24 d/yr by 30 yrs out
- Wind 8/10 Severe 99% chance of damaging wind over 30 yrs
- Air quality 2/10 Low 2 unhealthy d/yr today · 2 by 30 yrs out
Nearby sold comps map
Loading sold comps map…
Walkable amenities ~0.75 mi
Loading nearby amenities…
Taxation est. · year 1
- Rental income
- $29,558
- − Mortgage interest
- −$13,444
- − Property taxes
- −$3,643
- − Insurance
- −$1,200
- − Repairs & maintenance
- −$2,365
- − Management
- −$2,365
- − Depreciation
- −$6,982
- Taxable loss
- −$440
- Est. tax savings @ 24.0%
- +$106
- After-tax cash flow
- $3,510/yr
For passive investors: Depreciation is non-cash, so a rental often shows a tax loss while cash-flowing — sheltering income. Rental losses are passive: they offset passive income freely, and up to $25,000/yr can offset ordinary (W-2) income if you actively participate and your MAGI is under $100k (phasing out to $0 by $150k); unused losses carry forward. On sale, claimed depreciation is recaptured at up to 25%, and gains may owe capital-gains tax (a 1031 exchange can defer both). Figures are a year-1 estimate at your 24.0% rate — not tax advice; consult a CPA.
Schools (NCES district)
- District
- Magnolia ISD
- NCES district ID
- 4828740
- Math proficiency
- 42% ▼ -7.00%
- Reading proficiency
- 45% ▼ -4.00%
- Median HH income
- $71,692
- Composite
- 39.46/100
- National rank
- #3958
- State rank
- #247 of 826 in TX
Livability — The Woodlands
- Score
- 91/100
- State rank
- #1
- US rank
- #47
Category grades
Schools grade is shown separately in the Schools card above.
Census & demographics
- County
- Montgomery County · 663,713 people
- City population
- 106,505
- Metro
- Houston-The Woodlands-Sugar Land, TX
- Population (ZIP)
- 44,900
- Household income
- $112,504
- Rent vs Own
- Severe rent burden
- 586.0
Population outlook (Montgomery County) Hauer SSP2
- Today (2025)
- 713,896 people
- By 2030
- 805,263 · +12.8%
- By 2040
- 992,708 · +39.1%
- By 2050
- 1,179,590 · +65.2%
- By 2075
- 1,628,084 · +128.1%
- By 2100
- 1,937,880 · +171.5%
Race, ethnicity, and origin ACS 2023
- Neighborhood character
- Predominantly White (66%)
- Race & ethnicity
- White 66% Hispanic / Latino 25% Two or more races 18% Black 3% Asian 1%
- Hispanic origin (detail)
- Mexican 14% Puerto Rican 1%
- Common ancestry
- Lithuanian 4% Slovak 2% Italian 2%
- Foreign-born
- 11% · Canada, Vietnam
- Languages at home
- 83% English-only · Spanish 15% Other Indo-European 1% German/W. Germanic 1%
Political lean MEDSL · Montgomery
- 2024 margin
- Solid R (+45.5) · D 26.8% · R 72.3%
- 2008→2024 swing
- +7.2pp toward D · 2008: -52.7pp · 2024: -45.5pp
- All cycles
- 2024: R+45.5 2020: R+43.8 2016: R+51.4 2012: R+60.7 2008: R+52.7
Not yet ingested
- Civics
- —
Market trends
- HPI YoY
- ▲ 12.09%
- Current HPI
- 512.87
- Rent YoY
- ▲ 0.32%
- Metro
- Houston-The Woodlands-Sugar Land, TX
- State GDP YoY
- ▲ 3.95%
- F500 in state
- 110
Industry mix (Fortune 500 HQ in TX)
| Industry | F500 HQs | Revenue |
|---|---|---|
| Energy | 16 | $1,198B |
|
||
| Technology | 5 | $198B |
|
||
| Engineering / Construction | 4 | $72B |
|
||
| Energy Services | 3 | $60B |
|
||
| Utilities | 3 | $41B |
|
||
| Healthcare | 2 | $330B |
|
||
Price history
+0.0% since first listed11 events — show timeline
- 2026-05-12 Contingent — HARMLS
- 2026-04-12 Pending — HARMLS
- 2026-04-07 Pending — HARMLS
- 2026-03-11 Listed $240,000 HARMLS
- 2026-02-14 Listing Removed — HARMLS
- 2025-10-16 Listed $240,000 HARMLS
- 2025-09-11 Sold (Public Records) — Public Records
- 2020-09-18 Sold (Public Records) — Public Records
- 2020-09-18 Sold (Public Records) — Public Records
- 2020-09-18 Sold (Public Records) — Public Records
- 1993-12-01 Sold (Public Records) — Public Records
Property tax history
+7.3%/yrLatest (2025): $3,643 · +19.8% YoY. Source: county tax records.
Cash-flow waterfall
monthlySold comps — $/sqft
last 12 mo · ≤1 miLoading sold comps…