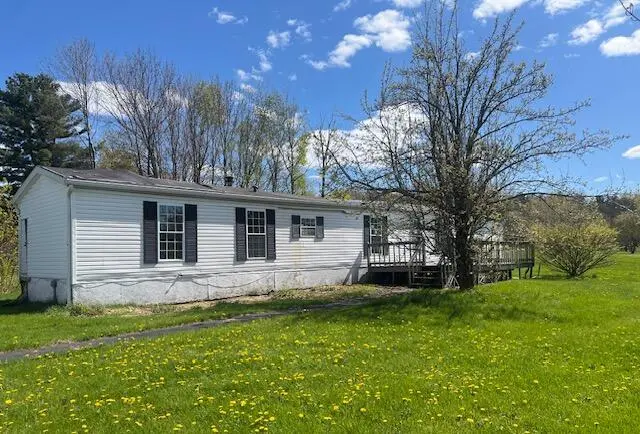
11 Maple Ave · Chateaugay, NY
Flood risk 1/10 · Minimal
- FEMA flood zone
- —
- Chance of flooding over 30 yrs
- 0.0%
- Est. flood insurance / yr
- —
Fire risk 1/10 · Minimal
- Est. fire insurance / yr
- $691 – $1,283
Heat risk 1/10 · Minimal
- Hot days now (above 89°F)
- 7 days/yr
- Hot days in 30 yrs
- 16 days/yr
Wind risk 1/10 · Minimal
- Chance of severe wind over 30 yrs
- —
Air-quality risk 1/10 · Minimal
- Unhealthy air days now
- 0 days/yr
- Unhealthy air days in 30 yrs
- 0 days/yr
Risk factors via First Street. Map © Google.
Why this score? — see what drove the B+ grade
The composite is a weighted blend of 9 inputs, each scored 0–100. Each bar is that input's sub-score; the figure is the points it added to the 100-point composite (weight × sub-score).
- Cash flow +29.5/30.0
- DSCR +10.0/10.0
- 1% rule +9.3/10.0
- ARV discount +7.5/15.0
- Appreciation +7.2/10.0
- Schools +4.3/10.0
- Livability +3.2/5.0
- Rent growth +2.5/5.0
- Condition / age +2.5/5.0
$61,600
🖨 Deal sheet 📄 Offer letter ✓ Due diligence
Listing remarks
Quiet street in village, excellent school district, walking distance to school and town
Key facts
- Quiet street
- 0.86 acre lot
- 2 garage spots
Tags
Property features AI
Finance
- Other: Lot size approximately 0.86 acres; Residential zoning
Exterior
- Parking: Detached or attached 2-car garage
- Utilities: Public water; Public sewer; 100 amp electric service; Cable, electricity and phone available; Sewer connected; Water available
- Home design: Manufactured house (single wide); One story; Fixer condition
- Construction: Vinyl siding; Pillar/post/pier foundation; Built as a manufactured home
- Exterior features: Back yard; Corner lot; Level lot; Paved road access
Interior
- Kitchen: Dishwasher; Electric range; Refrigerator
- Bedrooms: 3 bedrooms
- Flooring: Carpet; Vinyl
- Bathrooms: 2 full bathrooms
- Heating & cooling: Forced air heating; Kerosene heating; No central cooling
- Interior features: Dishwasher, Electric range, Refrigerator; No basement; Seven total rooms
- Laundry & utility: Washer/dryer hookups available
Neighborhood map
What this means for you Summary
Snapshot
- This is a 3-bed/2.0-bath manufactured listed at $62k.
Deal economics
- At list price, monthly cash flow is $221 ($3k/yr) — positive.
- The deal already cash-flows at list — no discount required.
- Meets the 1% rule at list price ($881 rent vs $62k).
- Recommended offer: $61k (1.5% below list) — sets the bar for market timing.
Location & tenants
- Location reads 65/100 on livability (#694 in NY) — a middle-class / working-renter tenant base. Strengths: cost of living A+, housing A+, employment B; Watch: health & safety C-, crime F, amenities F.
- Chateaugay Central School District (rural): math 45% / reading 50% proficiency, ranked #515 of 755 in NY (top 68%) — families likely to look elsewhere, expect single-tenant / working-renter base with shorter leases.
- Market conditions: 34 active listings in the ZIP; 124 units permitted in Franklin County in 2024 (0 in 5+ unit buildings).
Forward outlook
- In year one you build about $3k of equity ($426 loan paydown + $3k appreciation (4.3% local appreciation)).
- Franklin County population projected at -14% by 2050 — secular population decline; favor cash flow + early exit over multi-decade hold.
- At projected returns (4.3% appreciation + 3.0% rent growth), your $17k cash investment doubles in ~3 years — after that, you're playing with house money.
- By year 10, paydown + projected appreciation supports a ~$31k cash-out refi (75% LTV) — recoverable capital for the next deal without selling this one.
Negotiation context
- It's been on market 29 days — a 2% lower offer ($61k) is reasonable based on typical stale-listing flexibility.
Questions for the listing agent
- Is there a deadline driving the sale (1031 exchange, divorce, estate, relocation)? That informs how much negotiation room exists.
- Crime grade is F in this area — have there been break-ins, vandalism, or insurance claims at this property in the last 3 years? What carrier currently insures it and at what premium?
- What's the average days-on-market for RENTAL listings here right now (not sales)? A rising rental-DOM trend means longer vacancies and softer asking-rent achievability than the comps imply.
- What's the recent tenant-quality profile in this submarket — average credit score on applications, eviction rate, late-payment / NSF rate, and stable-employment percentage? A property-management company in the area should have these aggregated.
- How much new for-sale + rental construction is in the pipeline within 1–3 miles? Heavy new supply typically softens prices + rents 12–24 months out; constrained supply supports both.
Investment metrics
- 1% rule
- 1.43% ✓
- Cap rate
- 10.60%
- Cash-on-cash
- 15.39%
- DSCR
- 1.68
- GRM
- 5.8
CMA / ARV
No comps found within radius.
Projected returns pro-forma
4.33% appreciation · 3.0% rent growth · sell at horizon
- IRR
- 24.8%
- Equity multiple
- 2.51×
- Total profit
- $26,010
- Equity at exit
- $32,444
- IRR
- 24.5%
- Equity multiple
- 4.93×
- Total profit
- $67,728
- Equity at exit
- $54,055
Cash invested: $17,248 (down + closing). Projections, not guarantees.
Landlord ↔ Tenant lean methodology
- Overall (STATE)
- 15 Strongly Tenant-Friendly
- State New York
- 15 Strongly Tenant-Friendly · D+10
- County
- — inherits STATE
- City
- — inherits STATE
ZIP-level market 12920
- Home prices YoY
- 1.5%
- Active inventory
- 34
- Price-to-rent
- 5.8×
Monthly cashflow live
- Estimated rent
- $881 medium interval (Pro) →
- Mortgage (P&I)
- −$323
- Tax from tax record
- −$126 /mo · $1,510/yr
- Insurance
- −$26
- HOA
- −$0
- Vacancy / Maint / Mgmt
- −$185
- Net cashflow
- $221
Break-even live
UW: 25.0% down · 7.5% · 30yr · 1.5% tax · 5.0% vac · 8.0% maint · 8.0% mgmt
Financing live
Cash to close
- Down payment
- $15,400
- Closing costs
- $1,848
- Reserves months
- —
- Total cash needed
- —
Loan-product check · same deal, 3 products live
Conventional
25% down · 7.5% · 30yr
- Down + closing
- —
- Monthly P&I
- —
- Monthly cashflow
- —
- DSCR
- —
- Eligible?
- —
Personal DTI + credit; lowest rate.
DSCR
20% down · 8.5% · 30yr
- Down + closing
- —
- Monthly P&I
- —
- Monthly cashflow
- —
- DSCR
- —
- Eligible?
- —
No personal income docs; deal must DSCR.
Hard money
10% down · 12.0% · 12mo
- Down + closing
- —
- Monthly P&I
- —
- Monthly cashflow
- —
- DSCR
- —
- Eligible?
- —
Short-term bridge; refi at stabilization.
Listing history 15 events
-
2026-06-18days on market $61,600 Active 29 DOM
-
2026-06-17days on market $61,600 Active 28 DOM
-
2026-06-16days on market $61,600 Active 27 DOM
-
2026-06-15days on market $61,600 Active 26 DOM
-
2026-06-13days on market $61,600 Active 24 DOM
-
2026-06-12days on market $61,600 Active 23 DOM
-
2026-06-09days on market $61,600 Active 20 DOM
-
2026-06-08days on market $61,600 Active 19 DOM
-
2026-06-07days on market $61,600 Active 18 DOM
-
2026-06-07days on market $61,600 Active 17 DOM
-
2026-06-04days on market $61,600 Active 14 DOM
-
2026-06-02days on market $61,600 Active 13 DOM
-
2026-06-01days on market $61,600 Active 12 DOM
-
2026-05-31days on market $61,600 Active 11 DOM
-
2026-05-18$61,600 Active
ⓘ Source: listings_history table (triggers on properties + properties_extension) + one-shot
backfill from property_details.listing_events for pre-trigger history.
Tax reassessment forecast NY · Partial reset (capped growth)
- Current annual tax
- $1,510 · $126/mo
- Projected year-2 tax
- $1,510 · $126/mo
- Expected delta
- $0/yr ($0/mo · 0.0%)
ⓘ Screening estimate from a state-policy table — verify with the county assessor before closing.
Climate risk First Street
- Flood 1/10 Low 0% chance over 30 yrs
- Wildfire 1/10 Low
- Heat 1/10 Low 7 d/yr ≥89°F today · 16 d/yr by 30 yrs out
- Wind 1/10 Low
- Air quality 1/10 Low 0 unhealthy d/yr today · 0 by 30 yrs out
Nearby sold comps map
Loading sold comps map…
Walkable amenities ~0.75 mi
Loading nearby amenities…
Taxation est. · year 1
- Rental income
- $10,568
- − Mortgage interest
- −$3,451
- − Property taxes
- −$1,510
- − Insurance
- −$308
- − Repairs & maintenance
- −$845
- − Management
- −$845
- − Depreciation
- −$1,792
- Taxable income
- $1,816
- Est. tax owed @ 24.0%
- −$436
- After-tax cash flow
- $2,218/yr
For passive investors: Depreciation is non-cash, so a rental often shows a tax loss while cash-flowing — sheltering income. Rental losses are passive: they offset passive income freely, and up to $25,000/yr can offset ordinary (W-2) income if you actively participate and your MAGI is under $100k (phasing out to $0 by $150k); unused losses carry forward. On sale, claimed depreciation is recaptured at up to 25%, and gains may owe capital-gains tax (a 1031 exchange can defer both). Figures are a year-1 estimate at your 24.0% rate — not tax advice; consult a CPA.
Schools (NCES district)
- District
- Chateaugay Central School District
- NCES district ID
- 3607080
- Math proficiency
- 45% ▼ -5.00%
- Reading proficiency
- 50% ▬ 0.00%
- Median HH income
- $48,279
- Composite
- 42.66/100
- National rank
- #6803
- State rank
- #515 of 755 in NY
Livability — Chateaugay
- Score
- 65/100
- State rank
- #694
- US rank
- #13108
Category grades
Schools grade is shown separately in the Schools card above.
Census & demographics
- Census place
- Chateaugay, NY
- Population (ZIP)
- 2,509
Population outlook (Franklin County) Hauer SSP2
- Today (2025)
- 48,098 people
- By 2030
- 46,790 · -2.7%
- By 2040
- 44,400 · -7.7%
- By 2050
- 41,256 · -14.2%
- By 2075
- 32,190 · -33.1%
- By 2100
- 23,407 · -51.3%
Race, ethnicity, and origin ACS 2023
- Neighborhood character
- Predominantly White (89%)
- Race & ethnicity
- White 89% Two or more races 5% Black 4% Hispanic / Latino 3%
- Common ancestry
- Lithuanian 18% Slovak 3% Romanian 3%
- Foreign-born
- 3% · Canada
- Languages at home
- 98% English-only · French/Haitian/Cajun 1% Russian/Polish/Slavic 1%
Political lean MEDSL · Franklin
- 2024 margin
- Lean R (+9.0) · D 45.5% · R 54.5%
- 2008→2024 swing
- -31.2pp toward R · 2008: 22.2pp · 2024: -9.0pp
- All cycles
- 2024: R+9.0 2020: R+2.2 2016: R+7.4 2012: D+26.3 2008: D+22.2
Not yet ingested
- Civics
- —
Market trends
- HPI YoY
- ▲ 4.33%
- Current HPI
- 300.5209
- Rent YoY
- —
- Metro
- —
- State GDP YoY
- ▲ 2.60%
- F500 in state
- 92
Industry mix (Fortune 500 HQ in NY)
| Industry | F500 HQs | Revenue |
|---|---|---|
| Financial Services | 10 | $950B |
|
||
| Consumer Goods | 9 | $162B |
|
||
| Insurance | 4 | $225B |
|
||
| Telecommunications | 2 | $144B |
|
||
| Pharmaceuticals | 2 | $112B |
|
||
| Media / Entertainment | 2 | $69B |
|
||
Price history
1 event — show timeline
- 2026-05-18 Listed $61,600 ACVMLS
Property tax history
+5.8%/yrLatest (2025): $1,510 · +2.4% YoY. Source: county tax records.
Cash-flow waterfall
monthlySold comps — $/sqft
last 12 mo · ≤1 miLoading sold comps…