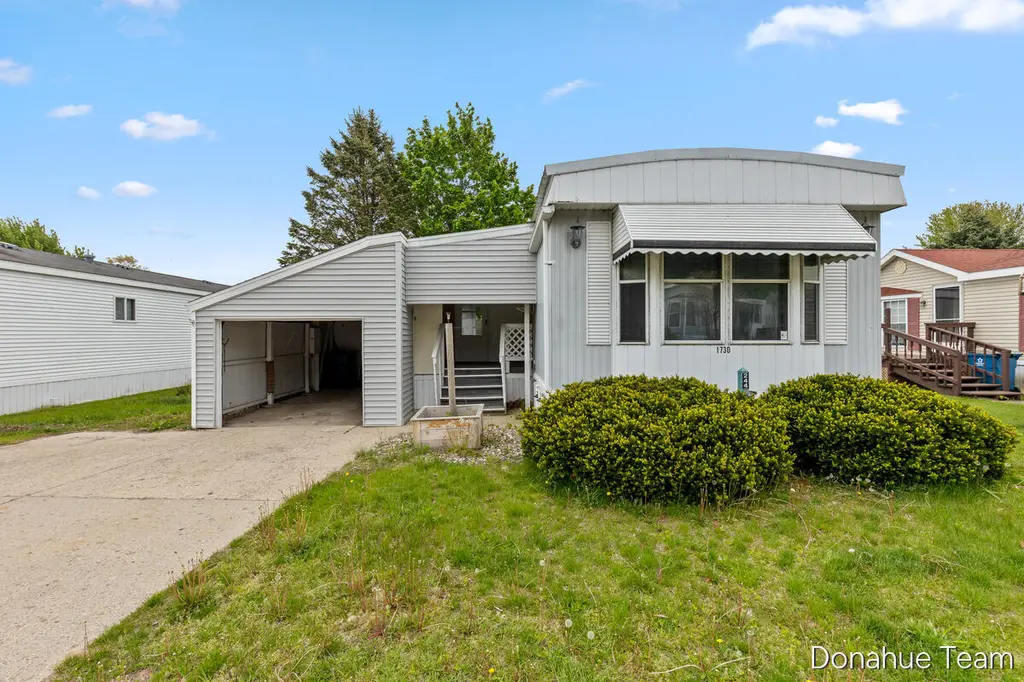
1730 Fay St SE · Lowell, MI
Flood risk No data
- FEMA flood zone
- —
- Chance of flooding over 30 yrs
- —
- Est. flood insurance / yr
- —
Fire risk No data
- Est. fire insurance / yr
- —
Heat risk No data
- Hot days now (above threshold)
- —
- Hot days in 30 yrs
- —
Wind risk No data
- Chance of severe wind over 30 yrs
- —
Air-quality risk No data
- Unhealthy air days now
- —
- Unhealthy air days in 30 yrs
- —
Risk factors via First Street. Map © Google.
Why this score? — see what drove the C+ grade
The composite is a weighted blend of 9 inputs, each scored 0–100. Each bar is that input's sub-score; the figure is the points it added to the 100-point composite (weight × sub-score).
- Cash flow +30.0/30.0
- 1% rule +10.0/10.0
- DSCR +10.0/10.0
- Schools +5.0/10.0
- Livability +4.0/5.0
- Rent growth +2.5/5.0
- Condition / age +2.2/5.0
- ARV discount +0.0/15.0
- Appreciation +0.0/10.0
$49,000
🖨 Deal sheet 📄 Offer letter ✓ Due diligence
Listing remarks MLS
Welcome to 1730 Fay St located in Key Heights manufactured home park. This home is in the cute town of Lowell, just 20 minutes from Grand Rapids. This 2 bedroom 2 bath open floor plan home has it all. The large sunroom that looks out into the peaceful neighborhood, an attached garage, covered porch and to top it off, a large shed with plenty of storage. The park is just a walk away from town. Also the amenities include a large park around the corner, a large playground next to the underground pool. Don't miss out. Schedule your private showing today!!! Ask about financing options
Key facts
- Covered porch
- Sunroom
- Large shed
Tags
Property features AI
Finance
- Other: Living area listed as 840; Directions available to the property
- HOA & community: Community amenities include meeting room, playground, and pool; Pets allowed; Monthly association fee (includes water, trash, snow removal)
Exterior
- Parking: Attached garage (1 car)
- Utilities: Natural gas water heater
- Home design: Ranch-style residence; Residential property; Built in 1987
- Construction: Aluminum siding; Vinyl siding; Slab basement
- Exterior features: Paved road access; Shed(s)
Interior
- Kitchen: Oven; Refrigerator
- Bedrooms: Primary bedroom; Bedroom 2
- Bathrooms: 2 full bathrooms
- Heating & cooling: Forced air heating; Window air conditioning units
- Interior features: Garage door opener; Pantry; Five total rooms
- Laundry & utility: Washer; Dryer; Laundry room
Neighborhood map
What this means for you Summary
Snapshot
- This is a 2-bed/2.0-bath manufactured listed at $49k. Condition is rated fair.
Deal economics
- At list price, monthly cash flow is $496 ($6k/yr) — positive.
- The deal already cash-flows at list — no discount required.
- Meets the 1% rule at list price ($2k rent vs $49k).
- Recommended offer: $48k (1.5% below list) — sets the bar for market timing.
- Cap rate 18.4% vs local median 2.9% in Lowell — top-decile yield for the area; either an underpriced asset or a hidden risk that comps aren't pricing in. Stress-test before assuming the spread holds.
Location & tenants
- Location reads 80/100 on livability (#76 in MI, #1,669 nationally) — a professional / high-income tenant draw. Strengths: cost of living A+, housing A+, health & safety A+; Watch: amenities F, commute F.
- Lowell Area Schools (rural): math 51% / reading 64% proficiency, ranked #51 of 540 in MI (top 9%) — acceptable for families but not a draw, mixed tenant base, ~2y average lease.
- Market conditions: 116 active listings in the ZIP; 3 comparable units currently listed for rent nearby; rentals leasing fast (median 3d on market — plan ~1-2 weeks tenant-placement turnaround); 2,253 units permitted in Kent County in 2024 (969 in 5+ unit buildings).
Forward outlook
- Local home prices are declining (-3.0%/yr); year-one equity from $339 of loan paydown is wiped out by about $1k of value loss. Plan a longer hold.
- Kent County population projected at +22% by 2050 — long-run rental-demand tailwind backs the buy-and-hold thesis.
- At projected returns (-3.0% appreciation + 3.0% rent growth), your $14k cash investment doubles in ~3 years — after that, you're playing with house money.
Negotiation context
- It's been on market 16 days — a 2% lower offer ($48k) is reasonable based on typical stale-listing flexibility.
- 3 sale attempts with the ask held roughly flat each time — persistent listings suggest the price (not the market) is what's stuck; bring a comps-based counter.
Risks & watch-outs
- Watch-outs: HOA is 32% of rent.
Questions for the listing agent
- Have any recent inspections been done? Can we get a copy of the seller's disclosures and any deferred-maintenance estimates?
- What does the HOA fee cover, when was the last increase, and are there any pending special assessments or reserve-fund shortfalls?
- Is there a deadline driving the sale (1031 exchange, divorce, estate, relocation)? That informs how much negotiation room exists.
- Schools are B-rated — typically a magnet for longer-tenancy family renters. What's the average tenant stay here, and is there a school-zone premium baked into asking?
- What's the average days-on-market for RENTAL listings here right now (not sales)? A rising rental-DOM trend means longer vacancies and softer asking-rent achievability than the comps imply.
- What's the recent tenant-quality profile in this submarket — average credit score on applications, eviction rate, late-payment / NSF rate, and stable-employment percentage? A property-management company in the area should have these aggregated.
- How much new for-sale + rental construction is in the pipeline within 1–3 miles? Heavy new supply typically softens prices + rents 12–24 months out; constrained supply supports both.
Investment metrics
- 1% rule
- 3.66% ✓
- Cap rate
- 18.44%
- Cash-on-cash
- 43.40%
- DSCR
- 2.93
- GRM
- 2.3
CMA / ARV
- ARV (median comp)
- $40,564
- List price
- $49,000
- Delta
- 20.80%
- Verdict
- OVERPRICED
- Comps
- 2 within 1.0 mi
Show comp detail 2 sales within ~0.75 mi
| Address | Dist | Beds/Ba | Sqft | Sold | Price | $/sf | Match |
|---|---|---|---|---|---|---|---|
| 1873 Veronica St SE | 0.20mi | 2/2.0 | 924 (+10%) | 11mo | $60,400 | $65 | 65 |
| 11274 Ann St SE | 0.29mi | 2/1.0 | 793 (-6%) | 11mo | $30,000 | $38 | 64 |
Match score weights: distance 35% · size 25% · config 20% · recency 20%. Top-matched comps best support the ARV.
Projected returns pro-forma
-3.0% appreciation · 3.0% rent growth · sell at horizon
- IRR
- 40.7%
- Equity multiple
- 2.75×
- Total profit
- $24,047
- Equity at exit
- $7,306
- IRR
- 47.1%
- Equity multiple
- 5.61×
- Total profit
- $63,195
- Equity at exit
- $4,237
Cash invested: $13,720 (down + closing). Projections, not guarantees.
Landlord ↔ Tenant lean methodology
- Overall (STATE)
- 62 Landlord-Friendly
- State Michigan
- 62 Landlord-Friendly · EVEN
- County
- — inherits STATE
- City
- — inherits STATE
ZIP-level market 49331
- Home prices YoY
- -31.2%
- Active inventory
- 116
- Price-to-rent
- 2.3×
Monthly cashflow live
- Estimated rent
- $1,793 medium interval (Pro) →
- Mortgage (P&I)
- −$257
- Tax est. 1.5%
- −$61 /mo · $735/yr
- Insurance
- −$20
- HOA
- −$582
- Vacancy / Maint / Mgmt
- −$377
- Net cashflow
- $496
Break-even live
UW: 25.0% down · 7.5% · 30yr · 1.5% tax · 5.0% vac · 8.0% maint · 8.0% mgmt
Financing live
Cash to close
- Down payment
- $12,250
- Closing costs
- $1,470
- Reserves months
- —
- Total cash needed
- —
Loan-product check · same deal, 3 products live
Conventional
25% down · 7.5% · 30yr
- Down + closing
- —
- Monthly P&I
- —
- Monthly cashflow
- —
- DSCR
- —
- Eligible?
- —
Personal DTI + credit; lowest rate.
DSCR
20% down · 8.5% · 30yr
- Down + closing
- —
- Monthly P&I
- —
- Monthly cashflow
- —
- DSCR
- —
- Eligible?
- —
No personal income docs; deal must DSCR.
Hard money
10% down · 12.0% · 12mo
- Down + closing
- —
- Monthly P&I
- —
- Monthly cashflow
- —
- DSCR
- —
- Eligible?
- —
Short-term bridge; refi at stabilization.
Rent comps 3 comps
| Address | Beds | Baths | Sqft | Rent | $/sqft | DOM | Units | Dist |
|---|---|---|---|---|---|---|---|---|
| 11443 Boulder Dr SE Lowell, MI | 2.0 | 2.0 | 953 | $1,650 | $1.73 | 2d | 1 | 0.56mi |
| 11731 Boulder Dr SE Lowell, MI | 1.0–2.0 | 1.0–2.0 | 1081 | $1,985 | $1.84 | 2d | 2 | 0.68mi |
| 1711 Alden Nash Ave SE Lowell, MI | 2.0 | 1.0 | 960 | $1,800 | $1.88 | 43d | 1 | 0.92mi |
HOA detail
- Monthly dues
- $582 · $6,984/yr
- Likely covers
- pool
Listing history 3 events
-
2026-05-13$49,000 Active 586-char remark
Show marketing remark (586 chars)
Welcome to 1730 Fay St located in Key Heights manufactured home park. This home is in the cute town of Lowell, just 20 minutes from Grand Rapids. This 2 bedroom 2 bath open floor plan home has it all. The large sunroom that looks out into the peaceful neighborhood, an attached garage, covered porch and to top it off, a large shed with plenty of storage. The park is just a walk away from town. Also the amenities include a large park around the corner, a large playground next to the underground pool. Don't miss out. Schedule your private showing today!!! Ask about financing options
-
2026-05-13$49,000 Active 597-char remark
Show marketing remark (586 chars)
Welcome to 1730 Fay St located in Key Heights manufactured home park. This home is in the cute town of Lowell, just 20 minutes from Grand Rapids. This 2 bedroom 2 bath open floor plan home has it all. The large sunroom that looks out into the peaceful neighborhood, an attached garage, covered porch and to top it off, a large shed with plenty of storage. The park is just a walk away from town. Also the amenities include a large park around the corner, a large playground next to the underground pool. Don't miss out. Schedule your private showing today!!! Ask about financing options
-
2026-05-13$49,000 Active
Show marketing remark (586 chars)
Welcome to 1730 Fay St located in Key Heights manufactured home park. This home is in the cute town of Lowell, just 20 minutes from Grand Rapids. This 2 bedroom 2 bath open floor plan home has it all. The large sunroom that looks out into the peaceful neighborhood, an attached garage, covered porch and to top it off, a large shed with plenty of storage. The park is just a walk away from town. Also the amenities include a large park around the corner, a large playground next to the underground pool. Don't miss out. Schedule your private showing today!!! Ask about financing options
ⓘ Source: listings_history table (triggers on properties + properties_extension) + one-shot
backfill from property_details.listing_events for pre-trigger history.
Nearby sold comps map
Loading sold comps map…
Walkable amenities ~0.75 mi
Loading nearby amenities…
Taxation est. · year 1
- Rental income
- $21,521
- − Mortgage interest
- −$2,745
- − Property taxes
- −$735
- − Insurance
- −$245
- − Repairs & maintenance
- −$1,722
- − Management
- −$1,722
- − HOA
- −$6,984
- − Depreciation
- −$1,425
- Taxable income
- $5,944
- Est. tax owed @ 24.0%
- −$1,426
- After-tax cash flow
- $4,528/yr
For passive investors: Depreciation is non-cash, so a rental often shows a tax loss while cash-flowing — sheltering income. Rental losses are passive: they offset passive income freely, and up to $25,000/yr can offset ordinary (W-2) income if you actively participate and your MAGI is under $100k (phasing out to $0 by $150k); unused losses carry forward. On sale, claimed depreciation is recaptured at up to 25%, and gains may owe capital-gains tax (a 1031 exchange can defer both). Figures are a year-1 estimate at your 24.0% rate — not tax advice; consult a CPA.
Condition & rehab AI · 20 photos
This manufactured home requires moderate renovations to improve its condition and increase its resale and rental value.
Repairs flagged
- Major kitchen cabinets — severe wear and tear
- Major bathroom fixtures — dated and worn
- Moderate exterior siding — moderate wear
- Major flooring — carpeted floors in need of replacement
- Major interior paint — severe peeling and wear
Value-add opportunities
- Resale paint interior walls — enhances curb appeal and interior aesthetics
- Resale replace carpeted flooring — improves living space and adds value
- Resale repair and paint exterior siding — enhances curb appeal and adds value
- Resale replace kitchen cabinets — modernizes kitchen and adds value
- Resale replace bathroom fixtures — modernizes bathroom and adds value
Renovation cost estimate screening
| Repair item | Severity | Est. cost |
|---|---|---|
| kitchen cabinets · severe wear and tear | Major | $15,000–50,000 |
| bathroom fixtures · dated and worn | Major | $15,000–50,000 |
| exterior siding · moderate wear | Moderate | $3,000–15,000 |
| flooring · carpeted floors in need of replacement | Major | $15,000–50,000 |
| interior paint · severe peeling and wear | Major | $15,000–50,000 |
| Total estimated repair cost · 5 items | $63,000–215,000 |
Value-add ROI direction
- Resale paint interior walls — enhances curb appeal and interior aesthetics ↑
- Resale replace carpeted flooring — improves living space and adds value ↑
- Resale repair and paint exterior siding — enhances curb appeal and adds value ↑
- Resale replace kitchen cabinets — modernizes kitchen and adds value ↑
- Resale replace bathroom fixtures — modernizes bathroom and adds value ↑
ⓘ Cost ranges are severity-bucket heuristics (US national rule-of-thumb). Get contractor quotes + a written scope before underwriting a rehab budget.
Schools (NCES district)
- District
- Lowell Area Schools
- NCES district ID
- 2622050
- Math proficiency
- 51% ▼ -6.00%
- Reading proficiency
- 64% ▼ -3.00%
- Median HH income
- $64,828
- Composite
- 50.37/100
- National rank
- #1873
- State rank
- #51 of 540 in MI
Livability — Lowell
- Score
- 80/100
- State rank
- #76
- US rank
- #1669
Category grades
Schools grade is shown separately in the Schools card above.
Census & demographics
- Population (ZIP)
- 17,419
Population outlook (Kent County) Hauer SSP2
- Today (2025)
- 712,484 people
- By 2030
- 748,618 · +5.1%
- By 2040
- 814,777 · +14.4%
- By 2050
- 868,556 · +21.9%
- By 2075
- 966,487 · +35.7%
- By 2100
- 967,975 · +35.9%
Race, ethnicity, and origin ACS 2023
- Neighborhood character
- Predominantly White (88%)
- Race & ethnicity
- White 88% Two or more races 7% Hispanic / Latino 4% Black 1%
- Common ancestry
- Iranian 16% Romanian 8% Italian 3%
- Foreign-born
- 1%
- Languages at home
- 98% English-only · French/Haitian/Cajun 1% Spanish 1% Other Asian/Pacific 1%
Political lean MEDSL · Kent
- 2024 margin
- Lean D (+5.4) · D 51.8% · R 46.5% · Other 1.7%
- 2008→2024 swing
- +4.8pp toward D · 2008: 0.5pp · 2024: 5.4pp
- All cycles
- 2024: D+5.4 2020: D+6.1 2016: R+3.1 2012: R+7.9 2008: D+0.5
Not yet ingested
- Civics
- —
Market trends
- HPI YoY
- ▼ -120.98%
- Current HPI
- 266.8058
- Rent YoY
- —
- Metro
- —
- State GDP YoY
- ▲ 1.37%
- F500 in state
- 28
Industry mix (Fortune 500 HQ in MI)
| Industry | F500 HQs | Revenue |
|---|---|---|
| Automotive Parts | 3 | $48B |
|
||
| Automotive | 2 | $372B |
|
||
| Chemicals | 1 | $45B |
|
||
| Automotive Retail | 1 | $29B |
|
||
| Healthcare / Medical Devices | 1 | $23B |
|
||
| Automotive Technology | 1 | $20B |
|
||
Price history
+0.0% since first listed6 events — show timeline
- 2026-05-29 Pending — REALCOMP
- 2026-05-29 Pending — MiRealSource-MiMLS
- 2026-05-29 Pending — SW Michigan MLS
- 2026-05-13 Listed $49,000 REALCOMP
- 2026-05-13 Listed $49,000 SW Michigan MLS
- 2026-05-13 Listed $49,000 MiRealSource-MiMLS
Cash-flow waterfall
monthlySold comps — $/sqft
last 12 mo · ≤1 miLoading sold comps…