2752 Meadow Lake Dr · Toms River, NJ
Flood risk 1/10 · Minimal
- FEMA flood zone
- X (unshaded)
- Chance of flooding over 30 yrs
- 0.0%
- Est. flood insurance / yr
- $507 – $1,088
Fire risk 2/10 · Minimal
- Est. fire insurance / yr
- $526 – $976
Heat risk 7/10 · Major
- Hot days now (above 102°F)
- 7 days/yr
- Hot days in 30 yrs
- 15 days/yr
Wind risk 6/10 · Moderate
- Chance of severe wind over 30 yrs
- 60.0%
Air-quality risk 3/10 · Minor
- Unhealthy air days now
- 3 days/yr
- Unhealthy air days in 30 yrs
- 4 days/yr
Risk factors via First Street. Map © Google.
Why this score? — see what drove the D- grade
The composite is a weighted blend of 9 inputs, each scored 0–100. Each bar is that input's sub-score; the figure is the points it added to the 100-point composite (weight × sub-score).
- ARV discount +12.5/15.0
- Cash flow +7.9/30.0
- Livability +4.0/5.0
- 1% rule +3.0/10.0
- Schools +2.9/10.0
- Rent growth +2.5/5.0
- Condition / age +2.5/5.0
- DSCR +2.0/10.0
- Appreciation +0.0/10.0
$389,000
🖨 Deal sheet 📄 Offer letter ✓ Due diligence
Listing remarks
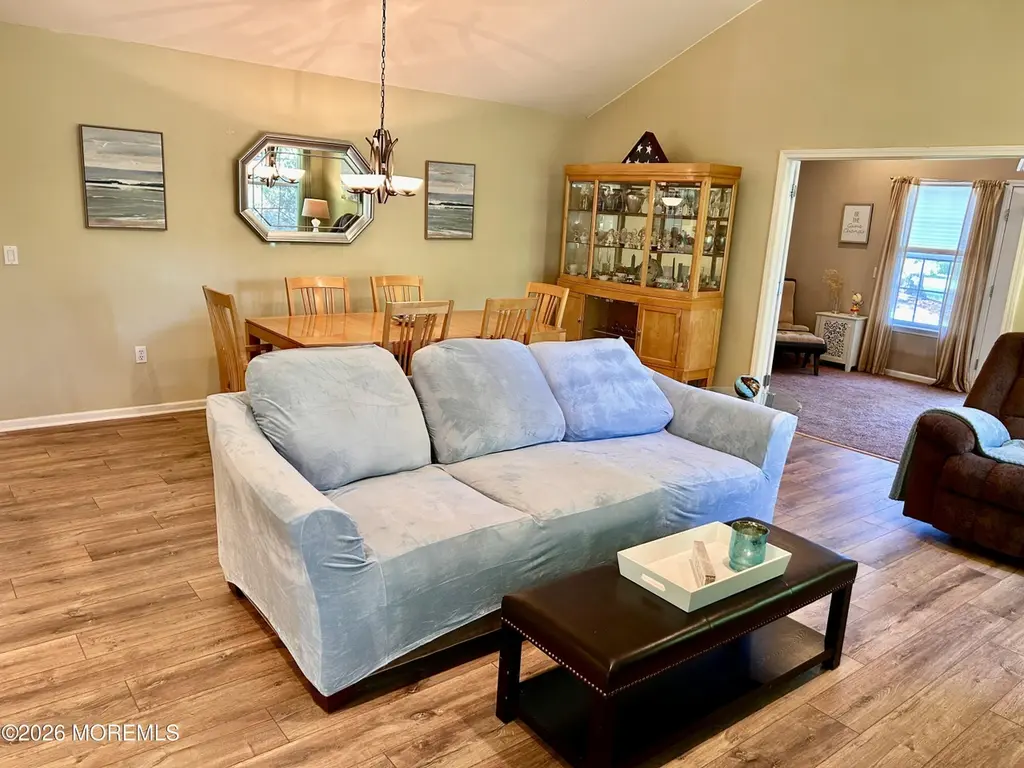
In the desired community of Lake Ridge, this exceptionally well-maintained home offers an open floor plan with vaulted ceilings and neutral colors throughout. The 2-bedroom, 2-bath home also features a sunroom that opens up to a private backyard patio. And if that wasn't enough, this privately gated, beautifully landscaped community, offers resort like living with a modern clubhouse, large pool, pickleball courts, shuffleboard, and endless classes and events that is sure to fill up your calendar! Don't miss out on your opportunity to call this house your HOME!
Key facts
- Open floor plan
- Privately gated
- Landscaped community
Tags
Property features AI
Finance
- HOA & community: HOA with monthly fee; Community amenities include exercise room, swimming (pool), and clubhouse; HOA covers trash, pool, and snow removal
Exterior
- Parking: Attached 1-car garage
- Utilities: Public sewer
- Home design: Model: Barrington II; Fee simple ownership
- Exterior features: Shingle roof; Located in the Lake Ridge subdivision (North Dover / Toms River Twp area)
Interior
- Kitchen: Dishwasher; Refrigerator
- Bedrooms: 2 bedrooms
- Bathrooms: 2 full bathrooms
- Heating & cooling: Forced air heating; Central air conditioning
- Interior features: Blinds/Shades; No fireplace
- Laundry & utility: Washer; Dryer
Neighborhood map
What this means for you Summary
Snapshot
- This is a 2-bed/2.0-bath single-family listed at $389k.
Deal economics
- At list price, monthly cash flow is $-414 ($-5k/yr) — negative.
- To cash-flow at today's rent, offer at most $316k (18.8% below list).
- To meet the 1% rule (rent ≥ 1% of price), the offer needs to be $313k (19.6% below list).
- Recommended offer: $313k (19.6% below list) — sets the bar for 1% rule.
- Cap rate 5.0% vs local median 3.8% in Toms River — top-decile yield for the area; either an underpriced asset or a hidden risk that comps aren't pricing in. Stress-test before assuming the spread holds.
Location & tenants
- Location reads 81/100 on livability (#61 in NJ, #1,538 nationally) — a professional / high-income tenant draw. Strengths: employment A+, housing A+, health & safety A+; Watch: commute D, cost of living F.
- Toms River Regional School District (suburban): math 18% / reading 44% proficiency, ranked #316 of 472 in NJ (top 67%) — families likely to look elsewhere, expect single-tenant / working-renter base with shorter leases.
- Market conditions: 262 active listings in the ZIP; 2 comparable units currently listed for rent nearby; solid renter incomes; 4,434 units permitted in Ocean County in 2024 (868 in 5+ unit buildings).
- This rent runs 43% of the median local income ($88k/yr) — at the standard rent-burdened threshold; future hikes will face affordability resistance.
Forward outlook
- Local home prices are declining (-3.0%/yr); year-one equity from $3k of loan paydown is wiped out by about $12k of value loss. Plan a longer hold.
- Ocean County population projected to shrink 8% by 2050 — rents likely to lag national; underwrite the cash flow, not the appreciation.
Negotiation context
- It's been on market 39 days — a 3% lower offer ($377k) is reasonable based on typical stale-listing flexibility.
- 2 sale attempts with the ask held roughly flat each time — persistent listings suggest the price (not the market) is what's stuck; bring a comps-based counter.
- Current owner paid $290k; 34% above their basis — modest negotiation headroom, anchor on the comps not their cost.
Risks & watch-outs
- Climate carrying-cost: major wind risk, 60% chance of damaging wind over 30y; extreme-heat days projected 7→15/yr by 2055 (HVAC capex compounding) — expect insurance premiums to compound above CPI over the hold.
Questions for the listing agent
- What do current leases actually rent for vs. the listed asking? Can we see a recent rent roll and the last 12 months of T-12 income?
- It's been on market 39 days. Have you received any prior offers? Is the seller open to a 20% concession, seller financing, or rate buy-down credit?
- What does the HOA fee cover, when was the last increase, and are there any pending special assessments or reserve-fund shortfalls?
- Is there a deadline driving the sale (1031 exchange, divorce, estate, relocation)? That informs how much negotiation room exists.
- The area grade is low — what's the realistic commute time and amenity access for the typical tenant pool here? Any planned neighborhood developments (good or bad) we should know about?
- What's the average days-on-market for RENTAL listings here right now (not sales)? A rising rental-DOM trend means longer vacancies and softer asking-rent achievability than the comps imply.
- What's the recent tenant-quality profile in this submarket — average credit score on applications, eviction rate, late-payment / NSF rate, and stable-employment percentage? A property-management company in the area should have these aggregated.
- How much new for-sale + rental construction is in the pipeline within 1–3 miles? Heavy new supply typically softens prices + rents 12–24 months out; constrained supply supports both.
Investment metrics
- 1% rule
- 0.80% ✗
- Cap rate
- 5.02%
- Cash-on-cash
- -4.56%
- DSCR
- 0.80
- GRM
- 10.4
CMA / ARV
- ARV (median comp)
- $437,917
- List price
- $389,000
- Delta
- -11.17%
- Verdict
- UNDERPRICED
- Comps
- 20 within 1.0 mi
Show comp detail 12 sales within ~0.75 mi
| Address | Dist | Beds/Ba | Sqft | Sold | Price | $/sf | Match |
|---|---|---|---|---|---|---|---|
| 2725 Brookdale Ct | 0.09mi | 2/2.0 | 1,667 (+4%) | 0mo | $450,000 | $270 | 88 |
| 20 Winding River Rd | 0.19mi | 2/2.0 | 1,696 (+6%) | 1mo | $415,000 | $245 | 80 |
| 2656 Silver Hill Ln | 0.14mi | 2/2.0 | 1,727 (+8%) | 0mo | $350,000 | $203 | 80 |
| 2666 Meadow Lake Dr | 0.20mi | 2/2.0 | 1,444 (-10%) | 0mo | $399,999 | $277 | 74 |
| 2396 Crisfield Cir | 0.41mi | 2/2.0 | 1,667 (+4%) | 2mo | $424,900 | $255 | 73 |
| 3349 Deep River Ln | 0.44mi | 2/2.0 | 1,675 (+5%) | 1mo | $365,000 | $218 | 71 |
| 2570 Little Pine Ct | 0.34mi | 2/2.0 | 1,741 (+9%) | 1mo | $450,000 | $258 | 68 |
| 2357 W Ashfield Ct | 0.51mi | 2/2.0 | 1,667 (+4%) | 2mo | $480,000 | $288 | 68 |
| 45 Deer Chase Ln | 0.31mi | 2/2.0 | 1,432 (-10%) | 2mo | $360,000 | $251 | 67 |
| 2684 Rockport Ln | 0.28mi | 2/2.0 | 1,814 (+13%) | 1mo | $510,000 | $281 | 64 |
| 14 Oakmont Rd | 0.42mi | 3/2.0 (+1) | 1,745 (+9%) | 1mo | $516,500 | $296 | 59 |
| 2430 Woodbine Ln | 0.57mi | 2/2.0 | 1,814 (+13%) | 0mo | $500,000 | $276 | 51 |
Match score weights: distance 35% · size 25% · config 20% · recency 20%. Top-matched comps best support the ARV.
Projected returns pro-forma
-3.0% appreciation · 3.0% rent growth · sell at horizon
- IRR
- -24.0%
- Equity multiple
- 0.18×
- Total profit
- $-89,239
- Equity at exit
- $58,001
- IRR
- -18.9%
- Equity multiple
- -0.02×
- Total profit
- $-110,983
- Equity at exit
- $33,634
Cash invested: $108,920 (down + closing). Projections, not guarantees.
Landlord ↔ Tenant lean methodology
- Overall (STATE)
- 21 Tenant-Leaning
- State New Jersey
- 21 Tenant-Leaning · D+6
- County
- — inherits STATE
- City
- — inherits STATE
ZIP-level market 08755
- Active inventory
- 262
- Price-to-rent
- 10.4×
Monthly cashflow live
- Estimated rent
- $3,128 medium interval (Pro) →
- Mortgage (P&I)
- −$2,040
- Tax from tax record
- −$456 /mo · $5,472/yr
- Insurance
- −$162
- HOA
- −$227
- Vacancy / Maint / Mgmt
- −$657
- Net cashflow
- $-414
Break-even live
UW: 25.0% down · 7.5% · 30yr · 1.5% tax · 5.0% vac · 8.0% maint · 8.0% mgmt
Financing live
Cash to close
- Down payment
- $97,250
- Closing costs
- $11,670
- Reserves months
- —
- Total cash needed
- —
Loan-product check · same deal, 3 products live
Conventional
25% down · 7.5% · 30yr
- Down + closing
- —
- Monthly P&I
- —
- Monthly cashflow
- —
- DSCR
- —
- Eligible?
- —
Personal DTI + credit; lowest rate.
DSCR
20% down · 8.5% · 30yr
- Down + closing
- —
- Monthly P&I
- —
- Monthly cashflow
- —
- DSCR
- —
- Eligible?
- —
No personal income docs; deal must DSCR.
Hard money
10% down · 12.0% · 12mo
- Down + closing
- —
- Monthly P&I
- —
- Monthly cashflow
- —
- DSCR
- —
- Eligible?
- —
Short-term bridge; refi at stabilization.
Rent comps 2 comps
| Address | Beds | Baths | Sqft | Rent | $/sqft | DOM | Units | Dist |
|---|---|---|---|---|---|---|---|---|
| 2106 Grassy Hollow Dr Toms River, NJ | 3.0 | 2.5 | 2022 | $2,900 | $1.43 | 18d | 1 | 0.83mi |
| 100 Jumper Dr Toms River, NJ | 2.0–3.0 | 2.0–2.5 | 1502 | $2,869 | $1.91 | 1d | 25 | 1.39mi |
HOA detail
- Monthly dues
- $227 · $2,724/yr
- Likely covers
- poolsecurity
Listing history 19 events
-
2026-06-18days on market $389,000 Active 39 DOM
-
2026-06-17days on market $389,000 Active 38 DOM
-
2026-06-16days on market $389,000 Active 37 DOM
-
2026-06-15days on market $389,000 Active 36 DOM
-
2026-06-13days on market $389,000 Active 34 DOM
-
2026-06-13days on market $389,000 Active 33 DOM
-
2026-06-09days on market $389,000 Active 30 DOM
-
2026-06-08days on market $389,000 Active 29 DOM
-
2026-06-07days on market $389,000 Active 28 DOM
-
2026-06-04days on market $389,000 Active 25 DOM
-
2026-06-03days on market $389,000 Active 24 DOM
-
2026-06-02days on market $389,000 Active 23 DOM
-
2026-06-01days on market $389,000 Active 22 DOM
-
2026-05-31days on market $389,000 Active 21 DOM
-
2026-05-11$389,000 Active 568-char remark
-
2025-09-04price $389,000
-
2025-07-21price $399,900
-
2025-06-04$409,000 Active
-
2007-08-29soldstatus $290,000
ⓘ Source: listings_history table (triggers on properties + properties_extension) + one-shot
backfill from property_details.listing_events for pre-trigger history.
Tax reassessment forecast NJ · Partial reset (capped growth)
- Current annual tax
- $5,472 · $456/mo
- Projected year-2 tax
- $7,579 · $632/mo
- Expected delta
- +$2,107/yr (+$176/mo · 38.5%)
ⓘ Screening estimate from a state-policy table — verify with the county assessor before closing.
Climate risk First Street
- Flood 1/10 Low FEMA zone X (unshaded) · 0% chance over 30 yrs
- Wildfire 2/10 Low
- Heat 7/10 Severe 7 d/yr ≥102°F today · 15 d/yr by 30 yrs out
- Wind 6/10 Major 60% chance of damaging wind over 30 yrs
- Air quality 3/10 Moderate 3 unhealthy d/yr today · 4 by 30 yrs out
Nearby sold comps map
Loading sold comps map…
Walkable amenities ~0.75 mi
Loading nearby amenities…
Taxation est. · year 1
- Rental income
- $37,534
- − Mortgage interest
- −$21,790
- − Property taxes
- −$5,472
- − Insurance
- −$1,945
- − Repairs & maintenance
- −$3,003
- − Management
- −$3,003
- − HOA
- −$2,724
- − Depreciation
- −$11,316
- Taxable loss
- −$11,719
- Est. tax savings @ 24.0%
- +$2,813
- After-tax cash flow
- $-2,156/yr
For passive investors: Depreciation is non-cash, so a rental often shows a tax loss while cash-flowing — sheltering income. Rental losses are passive: they offset passive income freely, and up to $25,000/yr can offset ordinary (W-2) income if you actively participate and your MAGI is under $100k (phasing out to $0 by $150k); unused losses carry forward. On sale, claimed depreciation is recaptured at up to 25%, and gains may owe capital-gains tax (a 1031 exchange can defer both). Figures are a year-1 estimate at your 24.0% rate — not tax advice; consult a CPA.
Schools (NCES district)
- District
- Toms River Regional School District
- NCES district ID
- 3416230
- Math proficiency
- 18% ▼ -19.00%
- Reading proficiency
- 44% ▼ -10.00%
- Median HH income
- $72,370
- Composite
- 29.07/100
- National rank
- #6602
- State rank
- #316 of 472 in NJ
Livability — Toms River
- Score
- 81/100
- State rank
- #61
- US rank
- #1538
Category grades
Schools grade is shown separately in the Schools card above.
Census & demographics
- Census place
- Toms River, NJ
- County
- Ocean County · 439,426 people
- City population
- 131,205
- Metro
- New York-Newark-Jersey City, NY-NJ-PA
- Population (ZIP)
- 29,670
- Household income
- $87,575
- Rent vs Own
- Severe rent burden
- 529.0
Population outlook (Ocean County) Hauer SSP2
- Today (2025)
- 586,991 people
- By 2030
- 581,403 · -1.0%
- By 2040
- 564,913 · -3.8%
- By 2050
- 538,149 · -8.3%
- By 2075
- 468,845 · -20.1%
- By 2100
- 350,297 · -40.3%
Race, ethnicity, and origin ACS 2023
- Neighborhood character
- Predominantly White (73%)
- Race & ethnicity
- White 73% Hispanic / Latino 11% Black 9% Two or more races 8% Asian 4%
- Hispanic origin (detail)
- Puerto Rican 6%
- Common ancestry
- Romanian 5% Italian 2% Scotch-Irish 2%
- Foreign-born
- 10% · Canada, Jamaica, South Korea
- Languages at home
- 84% English-only · Spanish 7% Other Indo-European 2% Tagalog/Filipino 2%
Political lean MEDSL · Ocean
- 2024 margin
- Solid R (+36.0) · D 31.4% · R 67.4% · Other 1.2%
- 2008→2024 swing
- -17.6pp toward R · 2008: -18.4pp · 2024: -36.0pp
- All cycles
- 2024: R+36.0 2020: R+28.7 2016: R+34.0 2012: R+17.7 2008: R+18.4
Not yet ingested
- Civics
- —
Market trends
- HPI YoY
- ▼ -223.51%
- Current HPI
- 303.2721
- Rent YoY
- —
- Metro
- New York-Newark-Jersey City, NY-NJ-PA
- State GDP YoY
- ▲ 2.05%
- F500 in state
- 34
Industry mix (Fortune 500 HQ in NJ)
| Industry | F500 HQs | Revenue |
|---|---|---|
| Consumer Goods | 3 | $31B |
|
||
| Pharmaceuticals | 2 | $153B |
|
||
| Technology | 2 | $21B |
|
||
| Insurance | 2 | $20B |
|
||
| Healthcare | 2 | $19B |
|
||
| Financial Services | 1 | $70B |
|
||
Price history
+34.1% since first listed5 events — show timeline
- 2026-05-11 Listed $389,000 MOMLS
- 2025-09-04 Price Changed $389,000 MOMLS
- 2025-07-21 Price Changed $399,900 MOMLS
- 2025-06-04 Listed $409,000 MOMLS
- 2007-08-29 Sold (Public Records) $290,000 Public Records
Property tax history
+2.6%/yrLatest (2025): $5,472 · +7.3% YoY. Source: county tax records.
Cash-flow waterfall
monthlySold comps — $/sqft
last 12 mo · ≤1 miLoading sold comps…