6181 Colorado 71 · Ordway, CO
Flood risk No data
- FEMA flood zone
- —
- Chance of flooding over 30 yrs
- —
- Est. flood insurance / yr
- —
Fire risk No data
- Est. fire insurance / yr
- —
Heat risk No data
- Hot days now (above threshold)
- —
- Hot days in 30 yrs
- —
Wind risk No data
- Chance of severe wind over 30 yrs
- —
Air-quality risk No data
- Unhealthy air days now
- —
- Unhealthy air days in 30 yrs
- —
Risk factors via First Street. Map © Google.
Why this score? — see what drove the D grade
The composite is a weighted blend of 9 inputs, each scored 0–100. Each bar is that input's sub-score; the figure is the points it added to the 100-point composite (weight × sub-score).
- Cash flow +13.4/30.0
- ARV discount +7.5/15.0
- DSCR +4.0/10.0
- 1% rule +3.8/10.0
- Appreciation +3.8/10.0
- Livability +3.1/5.0
- Rent growth +2.5/5.0
- Schools +2.1/10.0
- Condition / age +1.0/5.0
$175,000
🖨 Deal sheet (PDF) 📄 Offer letter ✓ Due diligence
Listing remarks
This house has 5 bedroom, 1 bath with the potential for a second bathroom. There is a walk in pantry, laundry room, a living room, a dinning room, a formal living room. with an extra room that could be used as a game room or craft room. There is 3 acres, a large barn/shop, one big animal pen with Lean to, and one small pen with lean to. The whole property is fences with a gate at the entries. This is a great property for the person interested in a diy with the opportunity to put your own interest into the charm of this place.
Key facts
- Laundry room
- Living room
- Extra room
Tags
Neighborhood map
What this means for you Summary
Snapshot
- This is a 5-bed/1.0-bath other listed at $175k. Condition is rated poor.
Deal economics
- At list price, monthly cash flow is $2 ($28/yr) — positive.
- The deal already cash-flows at list — no discount required.
- To meet the 1% rule (rent ≥ 1% of price), the offer needs to be $153k (12.4% below list).
- Recommended offer: $153k (12.4% below list) — sets the bar for 1% rule.
Location & tenants
- Location reads 61/100 on livability (#233 in CO) — a middle-class / working-renter tenant base. Strengths: cost of living A+, housing A+; Watch: health & safety C-, amenities F, commute F.
- Crowley County School District No. Re-1-J (rural): math 16% / reading 28% proficiency, ranked #150 of 176 in CO (top 85%) — low school quality limits family demand, transient renter base, plan for 1-2y turnover; 62% free/reduced lunch — lower-income household profile, screen leases tightly.
- Zoned schools: Crowley County Elementary K-6 (math 15% / reading 37%, grade F, #581 of 966 statewide, top 61%, 191 students, 65% FRL); Crowley County Elementary K-6 (math 15% / reading 37%, grade F, #581 of 966 statewide, top 61%, 191 students, 65% FRL); Crowley County Junior And Senior High School (math 15% / reading 32%, grade F, #304 of 381 statewide, top 80%, 188 students, 62% FRL) — zoned schools at 64% FRL track the district average.
- Market conditions: 29 active listings in the ZIP; 4 units permitted in Crowley County in 2024 (0 in 5+ unit buildings).
Forward outlook
- Local home prices are declining (-2.4%/yr); year-one equity from $1k of loan paydown is wiped out by about $4k of value loss. Plan a longer hold.
- Crowley County population projected at +14% by 2050 — modest demand growth; plan on rents tracking national, not racing it.
Negotiation context
- It's been on market 40 days — a 3% lower offer ($170k) is reasonable based on typical stale-listing flexibility.
Questions for the listing agent
- It's been on market 40 days. Have you received any prior offers? Is the seller open to a 12% concession, seller financing, or rate buy-down credit?
- Have any recent inspections been done? Can we get a copy of the seller's disclosures and any deferred-maintenance estimates?
- Is there a deadline driving the sale (1031 exchange, divorce, estate, relocation)? That informs how much negotiation room exists.
- Schools are F-rated, which usually means shorter tenancies and higher turnover. Who's the typical renter profile here, and what's been the actual vacancy rate?
- The area grade is low — what's the realistic commute time and amenity access for the typical tenant pool here? Any planned neighborhood developments (good or bad) we should know about?
- What's the average days-on-market for RENTAL listings here right now (not sales)? A rising rental-DOM trend means longer vacancies and softer asking-rent achievability than the comps imply.
- What's the recent tenant-quality profile in this submarket — average credit score on applications, eviction rate, late-payment / NSF rate, and stable-employment percentage? A property-management company in the area should have these aggregated.
- How much new for-sale + rental construction is in the pipeline within 1–3 miles? Heavy new supply typically softens prices + rents 12–24 months out; constrained supply supports both.
Investment metrics
- 1% rule
- 0.88% ✗
- Cap rate
- 6.31%
- Cash-on-cash
- 0.06%
- DSCR
- 1.00
- GRM
- 9.5
CMA / ARV
No comps found within radius.
Projected returns pro-forma
-2.42% appreciation · 3.0% rent growth · sell at horizon
- IRR
- -12.9%
- Equity multiple
- 0.51×
- Total profit
- $-23,931
- Equity at exit
- $30,618
- IRR
- -4.7%
- Equity multiple
- 0.66×
- Total profit
- $-16,840
- Equity at exit
- $23,019
Cash invested: $49,000 (down + closing). Projections, not guarantees.
Landlord ↔ Tenant lean methodology
- Overall (STATE)
- 38 Tenant-Leaning
- State Colorado
- 38 Tenant-Leaning · D+4
- County
- — inherits STATE
- City
- — inherits STATE
ZIP-level market 81063
- Home prices YoY
- -1.1%
- Active inventory
- 29
- Price-to-rent
- 9.5×
Monthly cashflow live
- Estimated rent
- $1,534 medium interval (Pro) →
- Mortgage (P&I)
- −$918
- Tax est. 1.5%
- −$219 /mo · $2,625/yr
- Insurance
- −$73
- HOA
- −$0
- Vacancy / Maint / Mgmt
- −$322
- Net cashflow
- $2
Break-even live
Sensitivity live
| Price | -10% $123 | -5% $63 | +0% $2 | +5% $-58 | +10% $-119 |
|---|---|---|---|---|---|
| Rent | -10% $-119 | -5% $-58 | +0% $2 | +5% $63 | +10% $124 |
| Rate | -1.0pp $90 | -0.5pp $47 | base $2 | +0.5pp $-43 | +1.0pp $-89 |
UW: 25.0% down · 7.5% · 30yr · 1.5% tax · 5.0% vac · 8.0% maint · 8.0% mgmt
Financing live
Cash to close
- Down payment
- $43,750
- Closing costs
- $5,250
- Reserves months
- —
- Total cash needed
- —
Loan-product check · same deal, 3 products live
Conventional
25% down · 7.5% · 30yr
- Down + closing
- —
- Monthly P&I
- —
- Monthly cashflow
- —
- DSCR
- —
- Eligible?
- —
Personal DTI + credit; lowest rate.
DSCR
20% down · 8.5% · 30yr
- Down + closing
- —
- Monthly P&I
- —
- Monthly cashflow
- —
- DSCR
- —
- Eligible?
- —
No personal income docs; deal must DSCR.
Hard money
10% down · 12.0% · 12mo
- Down + closing
- —
- Monthly P&I
- —
- Monthly cashflow
- —
- DSCR
- —
- Eligible?
- —
Short-term bridge; refi at stabilization.
Listing history 17 events
-
2026-06-21days on market $175,000 Active 40 DOM
-
2026-06-19days on market $175,000 Active 38 DOM
-
2026-06-18days on market $175,000 Active 37 DOM
-
2026-06-17days on market $175,000 Active 36 DOM
-
2026-06-16pricedays on market $175,000 Active 35 DOM
-
2026-06-15days on market $200,000 Active 34 DOM
-
2026-06-13days on market $200,000 Active 32 DOM
-
2026-06-12days on market $200,000 Active 31 DOM
-
2026-06-09days on market $200,000 Active 28 DOM
-
2026-06-08days on market $200,000 Active 27 DOM
-
2026-06-07days on market $200,000 Active 26 DOM
-
2026-06-04days on market $200,000 Active 22 DOM
-
2026-06-02days on market $200,000 Active 21 DOM
-
2026-06-01days on market $200,000 Active 20 DOM
-
2026-05-31days on market $200,000 Active 19 DOM
-
2026-05-31days on market $200,000 Active 18 DOM
-
2026-05-12$200,000 Active
ⓘ Source: listings_history table (triggers on properties + properties_extension) + one-shot
backfill from property_details.listing_events for pre-trigger history.
Nearby sold comps map
Loading sold comps map…
Walkable amenities ~0.75 mi
Loading nearby amenities…
Taxation est. · year 1
- Rental income
- $18,406
- − Mortgage interest
- −$9,803
- − Property taxes
- −$2,625
- − Insurance
- −$875
- − Repairs & maintenance
- −$1,472
- − Management
- −$1,472
- − Depreciation
- −$5,091
- Taxable loss
- −$2,932
- Est. tax savings @ 24.0%
- +$704
- After-tax cash flow
- $732/yr
For passive investors: Depreciation is non-cash, so a rental often shows a tax loss while cash-flowing — sheltering income. Rental losses are passive: they offset passive income freely, and up to $25,000/yr can offset ordinary (W-2) income if you actively participate and your MAGI is under $100k (phasing out to $0 by $150k); unused losses carry forward. On sale, claimed depreciation is recaptured at up to 25%, and gains may owe capital-gains tax (a 1031 exchange can defer both). Figures are a year-1 estimate at your 24.0% rate — not tax advice; consult a CPA.
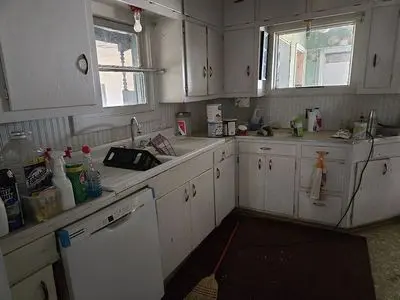
Condition & rehab AI · 1 photo
This property requires extensive repairs and updates to its roof, exterior, flooring, interior walls, and systems. Significant investment is needed to bring the property up to a livable condition.
Repairs flagged
- Major roof — No visible roof in the image.
- Major exterior — No visible exterior in the image.
- Major flooring — No visible flooring in the image.
- Major interior walls/paint — No visible interior walls/paint in the image.
- Major systems — No visible systems in the image.
Value-add opportunities
- Both roof replacement — A new roof would significantly improve the home's appearance and functionality.
- Both exterior painting and siding repair — A fresh coat of paint and repairs to the siding would enhance curb appeal and increase the home's value.
- Both flooring replacement — New flooring would improve the home's aesthetic and functionality.
- Both interior painting and repairs — Fresh paint and repairs to interior walls would improve the home's appearance and functionality.
- Both system upgrades — Upgrading the HVAC and other systems would improve the home's comfort and energy efficiency, enhancing both resale and rental value.
Renovation cost estimate screening
| Repair item | Severity | Est. cost |
|---|---|---|
| roof · No visible roof in the image. | Major | $15,000–50,000 |
| exterior · No visible exterior in the image. | Major | $15,000–50,000 |
| flooring · No visible flooring in the image. | Major | $15,000–50,000 |
| interior walls/paint · No visible interior walls/paint in the image. | Major | $15,000–50,000 |
| systems · No visible systems in the image. | Major | $15,000–50,000 |
| Total estimated repair cost · 5 items | $75,000–250,000 |
Value-add ROI direction
- Both roof replacement — A new roof would significantly improve the home's appearance and functionality. ↑
- Both exterior painting and siding repair — A fresh coat of paint and repairs to the siding would enhance curb appeal and increase the home's value. ↑
- Both flooring replacement — New flooring would improve the home's aesthetic and functionality. ↑
- Both interior painting and repairs — Fresh paint and repairs to interior walls would improve the home's appearance and functionality. ↑
- Both system upgrades — Upgrading the HVAC and other systems would improve the home's comfort and energy efficiency, enhancing both resale and rental value. ↑
ⓘ Cost ranges are severity-bucket heuristics (US national rule-of-thumb). Get contractor quotes + a written scope before underwriting a rehab budget.
Schools (NCES district)
- District
- Crowley County School District No. Re-1-J
- NCES district ID
- 0803210
- Math proficiency
- 16% ▼ -10.00%
- Reading proficiency
- 28% ▼ -12.00%
- Median HH income
- $35,031
- Composite
- 21.28/100
- National rank
- #13663
- State rank
- #150 of 176 in CO
Livability — Ordway
- Score
- 61/100
- State rank
- #233
- US rank
- #18425
Category grades
Schools grade is shown separately in the Schools card above.
Census & demographics
- Population (ZIP)
- 3,060
Population outlook (Crowley County) Hauer SSP2
- Today (2025)
- 5,612 people
- By 2030
- 5,725 · +2.0%
- By 2040
- 6,092 · +8.6%
- By 2050
- 6,391 · +13.9%
- By 2075
- 6,250 · +11.4%
- By 2100
- 5,349 · -4.7%
Race, ethnicity, and origin ACS 2023
- Neighborhood character
- Diverse neighborhood (Simpson 0.64)
- Race & ethnicity
- White 52% Hispanic / Latino 28% Two or more races 18% Black 7% Native American 6%
- Hispanic origin (detail)
- Mexican 11%
- Common ancestry
- Serbian 3% Portuguese 2% Iranian 1%
- Foreign-born
- 2% · Vietnam, Canada
- Languages at home
- 91% English-only · Spanish 8% Vietnamese 1%
Political lean MEDSL · Crowley
- 2024 margin
- Solid R (+47.4) · D 24.7% · R 72.2% · Other 3.1%
- 2008→2024 swing
- -20.2pp toward R · 2008: -27.2pp · 2024: -47.4pp
- All cycles
- 2024: R+47.4 2020: R+47.7 2016: R+48.5 2012: R+25.9 2008: R+27.2
Not yet ingested
- Civics
- —
Market trends
- HPI YoY
- ▼ -2.42%
- Current HPI
- 211.1097
- Rent YoY
- —
- Metro
- —
- State GDP YoY
- ▲ 1.95%
- F500 in state
- 14
Industry mix (Fortune 500 HQ in CO)
| Industry | F500 HQs | Revenue |
|---|---|---|
| Technology Distribution | 1 | $31B |
|
||
| Food / Agriculture | 1 | $18B |
|
||
| Packaging | 1 | $14B |
|
||
| Healthcare | 1 | $13B |
|
||
| Energy | 1 | $10B |
|
||
| Technology | 1 | $4B |
|
||
Price history
1 event — show timeline
- 2026-05-12 Listed $200,000 FSBO.com
Cash-flow waterfall
monthlySold comps — $/sqft
last 12 mo · ≤1 miLoading sold comps…