3286 170th St · Moville, IA
Flood risk 1/10 · Minimal
- FEMA flood zone
- X (unshaded)
- Chance of flooding over 30 yrs
- 0.0%
- Est. flood insurance / yr
- $507 – $1,088
Fire risk 1/10 · Minimal
- Est. fire insurance / yr
- $902 – $1,676
Heat risk 2/10 · Minimal
- Hot days now (above 102°F)
- 7 days/yr
- Hot days in 30 yrs
- 15 days/yr
Wind risk 2/10 · Minimal
- Chance of severe wind over 30 yrs
- —
Air-quality risk 2/10 · Minimal
- Unhealthy air days now
- 0 days/yr
- Unhealthy air days in 30 yrs
- 1 days/yr
Risk factors via First Street. Map © Google.
Why this score? — see what drove the B grade
The composite is a weighted blend of 9 inputs, each scored 0–100. Each bar is that input's sub-score; the figure is the points it added to the 100-point composite (weight × sub-score).
- Cash flow +30.0/30.0
- DSCR +10.0/10.0
- 1% rule +8.4/10.0
- ARV discount +7.5/15.0
- Schools +6.2/10.0
- Livability +4.2/5.0
- Rent growth +2.5/5.0
- Condition / age +2.5/5.0
- Appreciation +0.0/10.0
$90,000
🖨 Deal sheet 📄 Offer letter ✓ Due diligence
Listing remarks
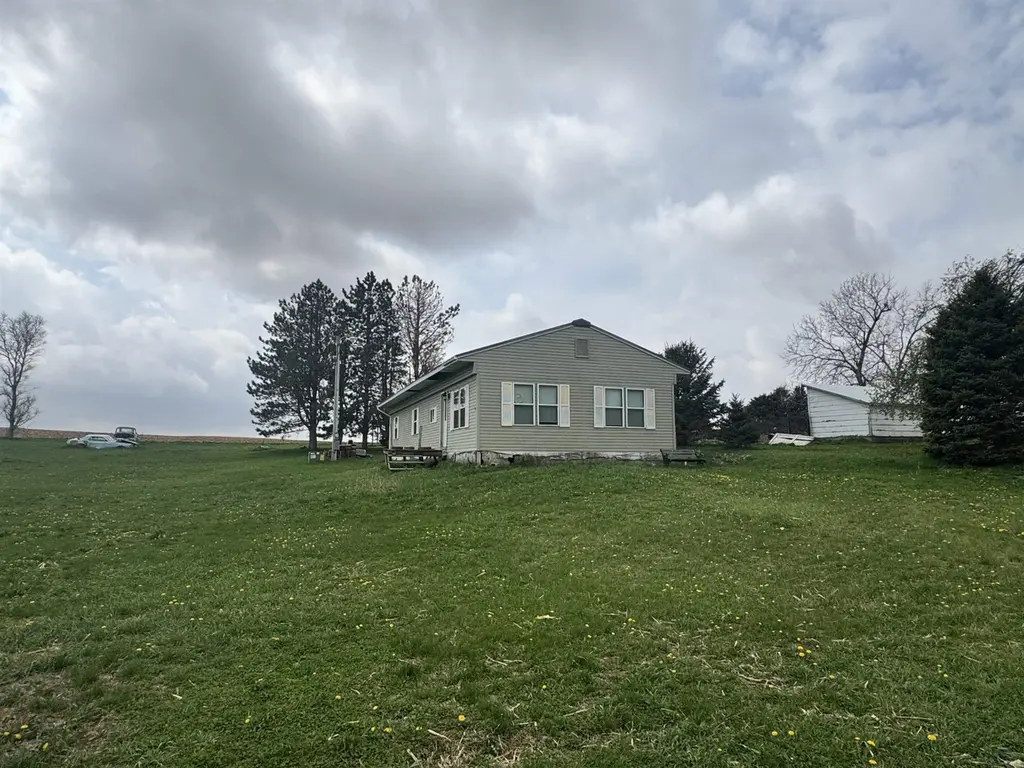
Here is your chance to buy 2 acres with a base structure. Build your dream home today. The 1977 manufactured home IS CURRENTLY NOT HABITABLE. The new owners will need to remove this structure or convert it into something usable. Strictly selling AS-IS and all improvements will be at the new owners expense.
Key facts
- 2 acre lot
- Built 1977
- Listed 45 days
Property features AI
Exterior
- Parking: No designated parking
- Utilities: Private well water; Septic tank
- Home design: Single-family residence (residential property)
- Construction: Vinyl siding
- Exterior features: Metal roof; 2-acre lot; Zoned AE
Interior
- Bathrooms: 2 full bathrooms
- Interior features: Central air conditioning; Electric forced-air heating
Neighborhood map
What this means for you Summary
Snapshot
- This is a 3-bed/2.0-bath manufactured listed at $90k.
Deal economics
- At list price, monthly cash flow is $391 ($5k/yr) — positive.
- The deal already cash-flows at list — no discount required.
- Meets the 1% rule at list price ($1k rent vs $90k).
- Recommended offer: $87k (3.0% below list) — sets the bar for market timing.
Location & tenants
- Location reads 85/100 on livability (#14 in IA, #486 nationally) — a professional / high-income tenant draw. Strengths: crime A+, employment A+, cost of living A+; Watch: amenities F, commute F.
- Woodbury Central Community School District (rural): math 66% / reading 79% proficiency, ranked #88 of 289 in IA (top 30%) — strong family-tenant draw, lease renewals of 3-5y typical; only 16% free/reduced lunch — higher-income household profile.
- Zoned schools: Woodbury Central Middle School (math 72% / reading 77%, grade A, #76 of 246 statewide, top 33%, 120 students, 28% FRL); Woodbury Central High School (math 62% / reading 82%, grade B+, #117 of 336 statewide, top 39%, 178 students, 26% FRL).
- Market conditions: 15 active listings in the ZIP; 170 units permitted in Woodbury County in 2024 (90 in 5+ unit buildings).
Forward outlook
- Local home prices are declining (-3.0%/yr); year-one equity from $622 of loan paydown is wiped out by about $3k of value loss. Plan a longer hold.
- At projected returns (-3.0% appreciation + 3.0% rent growth), your $25k cash investment doubles in ~7 years — after that, you're playing with house money.
Negotiation context
- It's been on market 45 days — a 3% lower offer ($87k) is reasonable based on typical stale-listing flexibility.
Questions for the listing agent
- It's been on market 45 days. Have you received any prior offers? Is the seller open to a 3% concession, seller financing, or rate buy-down credit?
- Built in 1977 — when were the roof, HVAC, electrical panel, plumbing, and water heater last replaced?
- Is there a deadline driving the sale (1031 exchange, divorce, estate, relocation)? That informs how much negotiation room exists.
- Schools are A-rated — typically a magnet for longer-tenancy family renters. What's the average tenant stay here, and is there a school-zone premium baked into asking?
- What's the average days-on-market for RENTAL listings here right now (not sales)? A rising rental-DOM trend means longer vacancies and softer asking-rent achievability than the comps imply.
- What's the recent tenant-quality profile in this submarket — average credit score on applications, eviction rate, late-payment / NSF rate, and stable-employment percentage? A property-management company in the area should have these aggregated.
- How much new for-sale + rental construction is in the pipeline within 1–3 miles? Heavy new supply typically softens prices + rents 12–24 months out; constrained supply supports both.
Investment metrics
- 1% rule
- 1.34% ✓
- Cap rate
- 11.51%
- Cash-on-cash
- 18.62%
- DSCR
- 1.83
- GRM
- 6.2
CMA / ARV
No comps found within radius.
Projected returns pro-forma
-3.0% appreciation · 3.0% rent growth · sell at horizon
- IRR
- 10.4%
- Equity multiple
- 1.41×
- Total profit
- $10,303
- Equity at exit
- $13,419
- IRR
- 19.4%
- Equity multiple
- 2.63×
- Total profit
- $40,967
- Equity at exit
- $7,782
Cash invested: $25,200 (down + closing). Projections, not guarantees.
Landlord ↔ Tenant lean methodology
- Overall (STATE)
- 83 Strongly Landlord-Friendly
- State Iowa
- 83 Strongly Landlord-Friendly · R+6
- County
- — inherits STATE
- City
- — inherits STATE
ZIP-level market 51039
- Home prices YoY
- -11.6%
- Active inventory
- 15
- Price-to-rent
- 6.2×
Monthly cashflow live
- Estimated rent
- $1,208 medium interval (Pro) →
- Mortgage (P&I)
- −$472
- Tax from tax record
- −$54 /mo · $644/yr
- Insurance
- −$38
- HOA
- −$0
- Vacancy / Maint / Mgmt
- −$254
- Net cashflow
- $391
Break-even live
UW: 25.0% down · 7.5% · 30yr · 1.5% tax · 5.0% vac · 8.0% maint · 8.0% mgmt
Financing live
Cash to close
- Down payment
- $22,500
- Closing costs
- $2,700
- Reserves months
- —
- Total cash needed
- —
Loan-product check · same deal, 3 products live
Conventional
25% down · 7.5% · 30yr
- Down + closing
- —
- Monthly P&I
- —
- Monthly cashflow
- —
- DSCR
- —
- Eligible?
- —
Personal DTI + credit; lowest rate.
DSCR
20% down · 8.5% · 30yr
- Down + closing
- —
- Monthly P&I
- —
- Monthly cashflow
- —
- DSCR
- —
- Eligible?
- —
No personal income docs; deal must DSCR.
Hard money
10% down · 12.0% · 12mo
- Down + closing
- —
- Monthly P&I
- —
- Monthly cashflow
- —
- DSCR
- —
- Eligible?
- —
Short-term bridge; refi at stabilization.
Listing history 16 events
-
2026-06-18days on market $90,000 Active 45 DOM
-
2026-06-17days on market $90,000 Active 44 DOM
-
2026-06-16days on market $90,000 Active 43 DOM
-
2026-06-15days on market $90,000 Active 42 DOM
-
2026-06-13days on market $90,000 Active 40 DOM
-
2026-06-12days on market $90,000 Active 39 DOM
-
2026-06-09days on market $90,000 Active 36 DOM
-
2026-06-08days on market $90,000 Active 35 DOM
-
2026-06-07days on market $90,000 Active 34 DOM
-
2026-06-05days on market $90,000 Active 32 DOM
-
2026-06-04days on market $90,000 Active 30 DOM
-
2026-06-02days on market $90,000 Active 29 DOM
-
2026-06-01days on market $90,000 Active 28 DOM
-
2026-05-31days on market $90,000 Active 27 DOM
-
2026-05-31days on market $90,000 Active 26 DOM
-
2026-05-01$100,000 Active 307-char remark
ⓘ Source: listings_history table (triggers on properties + properties_extension) + one-shot
backfill from property_details.listing_events for pre-trigger history.
Tax reassessment forecast IA · Partial reset (capped growth)
- Current annual tax
- $644 · $54/mo
- Projected year-2 tax
- $1,028 · $86/mo
- Expected delta
- +$384/yr (+$32/mo · 59.7%)
ⓘ Screening estimate from a state-policy table — verify with the county assessor before closing.
Climate risk First Street
- Flood 1/10 Low FEMA zone X (unshaded) · 0% chance over 30 yrs
- Wildfire 1/10 Low
- Heat 2/10 Low 7 d/yr ≥102°F today · 15 d/yr by 30 yrs out
- Wind 2/10 Low
- Air quality 2/10 Low 0 unhealthy d/yr today · 1 by 30 yrs out
Nearby sold comps map
Loading sold comps map…
Walkable amenities ~0.75 mi
Loading nearby amenities…
Taxation est. · year 1
- Rental income
- $14,494
- − Mortgage interest
- −$5,041
- − Property taxes
- −$644
- − Insurance
- −$450
- − Repairs & maintenance
- −$1,159
- − Management
- −$1,159
- − Depreciation
- −$2,618
- Taxable income
- $3,421
- Est. tax owed @ 24.0%
- −$821
- After-tax cash flow
- $3,871/yr
For passive investors: Depreciation is non-cash, so a rental often shows a tax loss while cash-flowing — sheltering income. Rental losses are passive: they offset passive income freely, and up to $25,000/yr can offset ordinary (W-2) income if you actively participate and your MAGI is under $100k (phasing out to $0 by $150k); unused losses carry forward. On sale, claimed depreciation is recaptured at up to 25%, and gains may owe capital-gains tax (a 1031 exchange can defer both). Figures are a year-1 estimate at your 24.0% rate — not tax advice; consult a CPA.
Schools (NCES district)
- District
- Woodbury Central Community School District
- NCES district ID
- 1931950
- Math proficiency
- 66% ▼ -7.00%
- Reading proficiency
- 79% ▬ 0.00%
- Median HH income
- $59,994
- Composite
- 62.35/100
- National rank
- #694
- State rank
- #88 of 289 in IA
Livability — Moville
- Score
- 85/100
- State rank
- #14
- US rank
- #486
Category grades
Schools grade is shown separately in the Schools card above.
Census & demographics
- Population (ZIP)
- 2,831
Population outlook (Woodbury County) Hauer SSP2
- Today (2025)
- 103,226 people
- By 2030
- 103,060 · -0.2%
- By 2040
- 102,533 · -0.7%
- By 2050
- 102,788 · -0.4%
- By 2075
- 107,227 · +3.9%
- By 2100
- 113,980 · +10.4%
Race, ethnicity, and origin ACS 2023
- Neighborhood character
- Predominantly White (85%)
- Race & ethnicity
- White 85% Two or more races 12% Asian 1%
- Common ancestry
- Portuguese 4% Italian 3% Slovak 2%
- Foreign-born
- 1% · South Korea
- Languages at home
- 98% English-only · Spanish 1%
Political lean MEDSL · Woodbury
- 2024 margin
- Strong R (+23.0) · D 37.8% · R 60.9% · Other 1.3%
- 2008→2024 swing
- -22.5pp toward R · 2008: -0.5pp · 2024: -23.0pp
- All cycles
- 2024: R+23.0 2020: R+15.5 2016: R+19.9 2012: R+0.2 2008: R+0.5
Not yet ingested
- Civics
- —
Market trends
- HPI YoY
- ▼ -31.92%
- Current HPI
- 242.2042
- Rent YoY
- —
- Metro
- —
- State GDP YoY
- ▲ 2.48%
- F500 in state
- 4
Industry mix (Fortune 500 HQ in IA)
| Industry | F500 HQs | Revenue |
|---|---|---|
| Financial Services | 1 | $16B |
|
||
| Retail / Convenience | 1 | $15B |
|
||
Price history
-10.0% since first listed2 events — show timeline
- 2026-05-23 Price Changed $90,000 NWIA
- 2026-05-01 Listed $100,000 NWIA
Property tax history
+7.2%/yrLatest (2025): $644 · +5.9% YoY. Source: county tax records.
Cash-flow waterfall
monthlySold comps — $/sqft
last 12 mo · ≤1 miLoading sold comps…