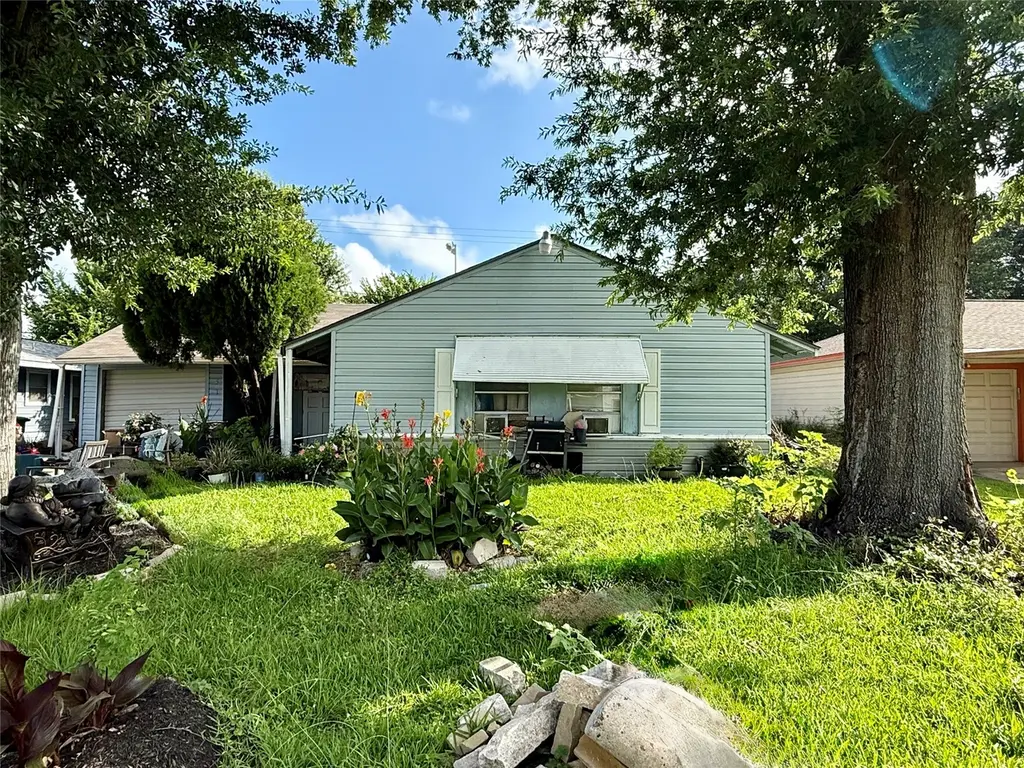
5221 Browncroft St · Houston, TX
Flood risk 7/10 · Major
- FEMA flood zone
- X (unshaded)
- Chance of flooding over 30 yrs
- 0.99%
- Est. flood insurance / yr
- $507 – $1,088
Fire risk 1/10 · Minimal
- Est. fire insurance / yr
- $1,222 – $2,270
Heat risk 9/10 · Severe
- Hot days now (above 109°F)
- 7 days/yr
- Hot days in 30 yrs
- 24 days/yr
Wind risk 9/10 · Severe
- Chance of severe wind over 30 yrs
- 99.0%
Air-quality risk 2/10 · Minimal
- Unhealthy air days now
- 2 days/yr
- Unhealthy air days in 30 yrs
- 2 days/yr
Risk factors via First Street. Map © Google.
Why this score? — see what drove the B- grade
The composite is a weighted blend of 9 inputs, each scored 0–100. Each bar is that input's sub-score; the figure is the points it added to the 100-point composite (weight × sub-score).
- Cash flow +30.0/30.0
- DSCR +10.0/10.0
- 1% rule +9.8/10.0
- ARV discount +7.5/15.0
- Livability +3.7/5.0
- Rent growth +3.0/5.0
- Schools +2.7/10.0
- Condition / age +2.5/5.0
- Appreciation +0.0/10.0
$110,000
🖨 Deal sheet 📄 Offer letter ✓ Due diligence
Listing remarks
* Investor Special in Houston’s Historic Third Ward * Opportunity awaits with this 3-bedroom, 1-bath home situated on a quiet residential street in one of Houston’s most rapidly evolving communities. This property is being sold as-is and will either require significant renovation or a complete renovation, making it an ideal project for experienced investors, flippers, or builders seeking their next venture. Whether you’re planning a complete remodel or a full redevelopment, the potential is undeniable. Conveniently located near downtown Houston, major freeways, universities, dining, and entertainment, this property offers the location and upside that savvy investors s
Key facts
- Major freeways
- Dining
- Universities
Tags
Property features AI
Finance
- Other: Lease not considered; Seller disclosure available
Exterior
- Parking: 1-car garage; No additional parking features listed
- Utilities: Public sewer
- Home design: Residential property; Faces east; Built in 1960; Entry on main level
- Construction: Composition roof; Foundation: pillar/post/pier and slab
- Exterior features: Asphalt road access; Lot includes other unspecified features
Interior
- Bedrooms: Primary bedroom on the first floor (approx. 12 x 13); Bedroom on the first floor (approx. 11 x 11); Bedroom on the first floor (approx. 11 x 10)
- Flooring: Laminate
- Bathrooms: 1 full bathroom
- Heating & cooling: Central heating (gas); Window air conditioning units
- Interior features: Laminate flooring; 3 total rooms
Neighborhood map
What this means for you Summary
Snapshot
- This is a 3-bed/1.0-bath single-family listed at $110k.
Deal economics
- At list price, monthly cash flow is $357 ($4k/yr) — positive.
- The deal already cash-flows at list — no discount required.
- Meets the 1% rule at list price ($2k rent vs $110k).
- Recommended offer: $108k (1.5% below list) — sets the bar for market timing.
- Cap rate 10.9% vs local median 3.2% in Houston — top-decile yield for the area; either an underpriced asset or a hidden risk that comps aren't pricing in. Stress-test before assuming the spread holds.
Location & tenants
- Location reads 74/100 on livability (#184 in TX, #4,771 nationally) — a middle-class / working-renter tenant base. Strengths: amenities A+, cost of living A+, housing A+; Watch: crime F.
- Houston ISD (urban): math 27% / reading 35% proficiency, ranked #593 of 826 in TX (top 72%) — families likely to look elsewhere, expect single-tenant / working-renter base with shorter leases; 71% free/reduced lunch — lower-income household profile, screen leases tightly.
- Zoned schools: Hartsfield El (math 27% / reading 22%, grade F, #3,052 of 4,322 statewide, top 74%, 303 students, 98% FRL); Cullen Middle (math 6% / reading 14%, grade F, #1,641 of 1,662 statewide, top 99%, 324 students, 100% FRL); Yates H S (math 12% / reading 23%, grade F, #1,451 of 1,632 statewide, top 89%, 851 students, 96% FRL) — zoned schools average 98% FRL vs 71% district-wide (27 pts higher); higher-poverty schools than district average — tighter screening recommended.
- Zoned-school proficiency averages 17% at this address vs 31% district-wide (-14 pts) — the specific schools serving this property underperform the Houston ISD average; the district grade overstates school quality for this exact location.
- Market conditions: Rents rising (+2.2%/yr); 467 active listings in the ZIP; 33 comparable units currently listed for rent nearby; rentals at typical pace (median 24d on market — plan ~3-4 weeks tenant-placement turnaround); 45% of comp listings sitting > 30 days — soft ceiling on asking rent; 29,883 units permitted in Harris County in 2024 (8,621 in 5+ unit buildings).
Forward outlook
- Local home prices are declining (-3.0%/yr); year-one equity from $761 of loan paydown is wiped out by about $3k of value loss. Plan a longer hold.
- Harris County population projected at +47% by 2050 — long-run rental-demand tailwind backs the buy-and-hold thesis.
- At projected returns (-3.0% appreciation + 2.2% rent growth), your $31k cash investment doubles in ~10 years — after that, you're playing with house money.
Negotiation context
- It's been on market 16 days — a 2% lower offer ($108k) is reasonable based on typical stale-listing flexibility.
- 5 sale attempts since 7y ago with the ask held roughly flat each time — persistent listings suggest the price (not the market) is what's stuck; bring a comps-based counter.
Risks & watch-outs
- Watch-outs: property tax is 2.7% of price; flood insurance adds $66/mo.
- Climate carrying-cost: major flood risk; severe wind risk, 99% chance of damaging wind over 30y; extreme-heat days projected 7→24/yr by 2055 (HVAC capex compounding) — expect insurance premiums to compound above CPI over the hold.
Questions for the listing agent
- Built in 1960 — when were the roof, HVAC, electrical panel, plumbing, and water heater last replaced?
- Property tax is high relative to price — has the assessment been appealed recently, and will the sale trigger a re-assessment?
- What's the actual annual flood-insurance premium (NFIP or private), and is the property in a SFHA with mandatory coverage?
- Is there a deadline driving the sale (1031 exchange, divorce, estate, relocation)? That informs how much negotiation room exists.
- Schools are D-rated, which usually means shorter tenancies and higher turnover. Who's the typical renter profile here, and what's been the actual vacancy rate?
- Crime grade is F in this area — have there been break-ins, vandalism, or insurance claims at this property in the last 3 years? What carrier currently insures it and at what premium?
- What's the average days-on-market for RENTAL listings here right now (not sales)? A rising rental-DOM trend means longer vacancies and softer asking-rent achievability than the comps imply.
- What's the recent tenant-quality profile in this submarket — average credit score on applications, eviction rate, late-payment / NSF rate, and stable-employment percentage? A property-management company in the area should have these aggregated.
- How much new for-sale + rental construction is in the pipeline within 1–3 miles? Heavy new supply typically softens prices + rents 12–24 months out; constrained supply supports both.
Investment metrics
- 1% rule
- 1.48% ✓
- Cap rate
- 10.92%
- Cash-on-cash
- 16.51%
- DSCR
- 1.73
- GRM
- 5.6
CMA / ARV
- ARV (on-the-fly)
- $231,504
- Comps found
- 12
Show comp detail 12 sales within ~0.75 mi
| Address | Dist | Beds/Ba | Sqft | Sold | Price | $/sf | Match |
|---|---|---|---|---|---|---|---|
| 5259 Perry St | 0.27mi | 4/2.0 (+1) | 1,400 (+2%) | 7mo | $190,000 | $136 | 70 |
| 5518 Nassau Rd | 0.32mi | 3/2.0 | 1,279 (-7%) | 4mo | $145,000 | $113 | 66 |
| 5126 Hull St | 0.53mi | 3/2.0 | 1,306 (-5%) | 3mo | $220,000 | $168 | 60 |
| 5111 Cosby St | 0.34mi | 3/2.0 | 1,225 (-11%) | 4mo | $225,000 | $184 | 58 |
| 6018 Beekman Rd | 0.25mi | 3/2.0 | 1,202 (-13%) | 9mo | $242,000 | $201 | 56 |
| 4902 Winfree Dr | 0.49mi | 3/2.0 | 1,511 (+10%) | 2mo | $169,500 | $112 | 55 |
| 4826 Ventura Ln | 0.58mi | 3/2.0 | 1,268 (-8%) | 2mo | $259,900 | $205 | 54 |
| 4735 Marietta Ln | 0.68mi | 3/2.0 | 1,439 (+4%) | 7mo | $235,000 | $163 | 51 |
| 4826 Culmore Dr | 0.60mi | 3/2.0 | 1,501 (+9%) | 3mo | $279,000 | $186 | 50 |
| 5822 Grace Ln | 0.44mi | 2/1.0 (-1) | 1,178 (-14%) | 5mo | $90,000 | $76 | 46 |
| 6326 Calhoun Rd | 0.72mi | 3/2.5 | 1,453 (+5%) | 7mo | $299,000 | $206 | 46 |
| 5014 Yellowstone Blvd | 0.70mi | 3/2.0 | 1,190 (-14%) | 6mo | $189,900 | $160 | 35 |
Match score weights: distance 35% · size 25% · config 20% · recency 20%. Top-matched comps best support the ARV.
Projected returns pro-forma
-3.0% appreciation · 2.17% rent growth · sell at horizon
- IRR
- 3.2%
- Equity multiple
- 1.12×
- Total profit
- $3,707
- Equity at exit
- $16,401
- IRR
- 11.9%
- Equity multiple
- 1.90×
- Total profit
- $27,599
- Equity at exit
- $9,511
Cash invested: $30,800 (down + closing). Projections, not guarantees.
Landlord ↔ Tenant lean methodology
- Overall (STATE)
- 87 Strongly Landlord-Friendly
- State Texas
- 87 Strongly Landlord-Friendly · R+5
- County
- — inherits STATE
- City
- — inherits STATE
ZIP-level market 77021
- Home prices YoY
- -23.6%
- Rents YoY
- 2.2%
- Active inventory
- 467
- Price-to-rent
- 5.6×
Monthly cashflow live
- Estimated rent
- $1,633 high interval (Pro) →
- Mortgage (P&I)
- −$577
- Tax from tax record
- −$244 /mo · $2,923/yr
- Insurance
- −$46
- Flood insurance flood zone
- −$66 /mo · $798/yr
- HOA
- −$0
- Vacancy / Maint / Mgmt
- −$343
- Net cashflow
- $357
Break-even live
UW: 25.0% down · 7.5% · 30yr · 1.5% tax · 5.0% vac · 8.0% maint · 8.0% mgmt
Financing live
Cash to close
- Down payment
- $27,500
- Closing costs
- $3,300
- Reserves months
- —
- Total cash needed
- —
Loan-product check · same deal, 3 products live
Conventional
25% down · 7.5% · 30yr
- Down + closing
- —
- Monthly P&I
- —
- Monthly cashflow
- —
- DSCR
- —
- Eligible?
- —
Personal DTI + credit; lowest rate.
DSCR
20% down · 8.5% · 30yr
- Down + closing
- —
- Monthly P&I
- —
- Monthly cashflow
- —
- DSCR
- —
- Eligible?
- —
No personal income docs; deal must DSCR.
Hard money
10% down · 12.0% · 12mo
- Down + closing
- —
- Monthly P&I
- —
- Monthly cashflow
- —
- DSCR
- —
- Eligible?
- —
Short-term bridge; refi at stabilization.
Rent comps 33 comps
| Address | Beds | Baths | Sqft | Rent | $/sqft | DOM | Units | Dist |
|---|---|---|---|---|---|---|---|---|
| 5116 Griggs Rd Houston, TX | 3.0 | 2.0 | 1131 | $1,316 | $1.16 | 43d | 1 | 0.12mi |
| 5154 Griggs Rd Unit CAVE Houston, TX | 2.0 | 2.0 | 1322 | $1,420 | $1.07 | 3d | 1 | 0.13mi |
| 5123 Dewberry St Houston, TX | 4.0 | 2.0 | 1391 | $2,400 | $1.73 | 43d | 1 | 0.19mi |
| 5918 Schroeder Rd Houston, TX | 1.0–2.0 | 1.0 | 850 | $1,000 | $1.18 | 43d | 1 | 0.29mi |
| 5924 Schroeder Rd Houston, TX | 2.0 | 1.0 | 900 | $895 | $0.99 | 43d | 1 | 0.29mi |
| 5924 Schroeder Rd Houston, TX | 2.0 | 1.0 | 900 | $895 | $0.99 | 22d | 1 | 0.29mi |
| 5610 Royal Palms St Houston, TX | 2.0 | 1.0 | 900 | $950 | $1.06 | 24d | 1 | 0.30mi |
| 5514 Griggs Rd Unit 2047 Houston, TX | 2.0 | 2.0 | 1322 | $1,225 | $0.93 | 11d | 1 | 0.36mi |
| 5514 Griggs Rd Unit 2047 Houston, TX | 2.0 | 2.0 | 1322 | $1,214 | $0.92 | 3d | 1 | 0.36mi |
| 5514 Griggs Rd Houston, TX | 2.0 | 2.0 | 1322 | $1,210 | $0.92 | 43d | 1 | 0.36mi |
| 5514 Griggs Rd Unit 5571 Houston, TX | 2.0 | 2.0 | 1322 | $1,214 | $0.92 | 10d | 1 | 0.36mi |
| 5514 Griggs Rd Unit 2162 Houston, TX | 2.0 | 2.0 | 1322 | $1,190 | $0.90 | 5d | 1 | 0.36mi |
| 5514 Griggs Rd Unit 422 Houston, TX | 2.0 | 2.0 | 1322 | $1,190 | $0.90 | 7d | 1 | 0.36mi |
| 5514 Griggs Rd Unit 2187 Houston, TX | 2.0 | 2.0 | 1322 | $1,182 | $0.89 | 3d | 1 | 0.36mi |
| 5520 Griggs Rd Houston, TX | 2.0 | 2.0 | 1322 | $1,241 | $0.94 | 22d | 1 | 0.41mi |
| 5520 Griggs Rd Houston, TX | 2.0 | 2.0 | 1322 | $1,241 | $0.94 | 43d | 1 | 0.41mi |
| 4907 Culmore Dr Houston, TX | 4.0 | 2.0 | 1800 | $2,700 | $1.50 | 16d | 1 | 0.54mi |
| 4907 Marietta Ln Unit 1494902P Houston, TX | 3.0 | 2.0 | 1593 | $3,278 | $2.06 | 14d | 1 | 0.63mi |
| 5101 Martin Luther King Blvd Unit MO54 Houston, TX | 2.0 | 2.0 | 1322 | $1,210 | $0.92 | 12d | 1 | 0.64mi |
| 6528 Weston St Unit A Houston, TX | 3.0 | 3.0 | 1484 | $2,200 | $1.48 | 43d | 1 | 0.65mi |
| 6532 Weston St Unit A Houston, TX | 3.0 | 3.0 | 1484 | $2,200 | $1.48 | 18d | 1 | 0.66mi |
| 5835 Southmont St Houston, TX | 3.0 | 2.0 | 1200 | $1,700 | $1.42 | 43d | 1 | 0.74mi |
| 4977 Martin Luther King Blvd Houston, TX | 4.0 | 4.0 | 1396 | $870 | $0.62 | 24d | 1 | 0.75mi |
| 5537 Bataan Rd Houston, TX | 2.0 | 1.0 | 880 | $1,300 | $1.48 | 43d | 1 | 0.77mi |
| 4722 Old Spanish Trl Unit B301 Houston, TX | 2.0 | 2.0 | 1027 | $1,695 | $1.65 | 44d | 1 | 0.78mi |
| 5317 Chennault Rd Unit A Houston, TX | 3.0 | 2.5 | 1608 | $1,999 | $1.24 | 43d | 1 | 0.90mi |
| 5813 England St Unit A Houston, TX | 3.0 | 2.5 | 1473 | $2,195 | $1.49 | 4d | 1 | 1.02mi |
| 4705 Idaho St Houston, TX | 3.0 | 2.5 | 1664 | $2,500 | $1.50 | 17d | 1 | 1.02mi |
| 4942 Bataan Rd Unit 77033 Houston, TX | 4.0 | 2.0 | 1350 | $1,800 | $1.33 | 43d | 1 | 1.08mi |
| 4465 N MacGregor Way Houston, TX | 4.0 | 4.0 | 1366 | $940 | $0.69 | 24d | 1 | 1.22mi |
| 5954 Doolittle Blvd Houston, TX | 3.0 | 2.0 | 1371 | $1,575 | $1.15 | 43d | 1 | 1.37mi |
| 7358 Guadalcanal Rd Houston, TX | 3.0 | 3.0 | 1768 | $2,195 | $1.24 | 43d | 1 | 1.38mi |
| 7032 Conley St Houston, TX | 3.0 | 2.0 | 1220 | $2,850 | $2.34 | 43d | 1 | 1.49mi |
Listing history 11 events
-
2026-06-18days on market $110,000 Pending 16 DOM
-
2026-06-17days on market $110,000 Pending 15 DOM
-
2026-06-16days on market $110,000 Pending 14 DOM
-
2026-06-15days on market $110,000 Pending 13 DOM
-
2026-06-13days on market $110,000 Pending 11 DOM
-
2026-06-09days on market $110,000 Pending 7 DOM
-
2026-06-08days on market $110,000 Pending 6 DOM
-
2026-06-07statusdays on market $110,000 Pending 5 DOM
-
2026-06-04days on market $110,000 Active 2 DOM
-
2026-06-02remarks 681-char remark
-
2026-06-02$110,000 Active 1 DOM
ⓘ Source: listings_history table (triggers on properties + properties_extension) + one-shot
backfill from property_details.listing_events for pre-trigger history.
Tax reassessment forecast TX · Resets to sale price
- Current annual tax
- $2,923 · $244/mo
- Projected year-2 tax
- $2,923 · $244/mo
- Expected delta
- $0/yr ($0/mo · 0.0%)
ⓘ Screening estimate from a state-policy table — verify with the county assessor before closing.
Climate risk First Street
- Flood 7/10 Severe FEMA zone X (unshaded) · 99% chance over 30 yrs
- Wildfire 1/10 Low
- Heat 9/10 Extreme 7 d/yr ≥109°F today · 24 d/yr by 30 yrs out
- Wind 9/10 Extreme 99% chance of damaging wind over 30 yrs
- Air quality 2/10 Low 2 unhealthy d/yr today · 2 by 30 yrs out
Nearby sold comps map
Loading sold comps map…
Walkable amenities ~0.75 mi
Loading nearby amenities…
Taxation est. · year 1
- Rental income
- $19,594
- − Mortgage interest
- −$6,162
- − Property taxes
- −$2,923
- − Insurance
- −$1,348
- − Repairs & maintenance
- −$1,568
- − Management
- −$1,568
- − Depreciation
- −$3,200
- Taxable income
- $2,827
- Est. tax owed @ 24.0%
- −$679
- After-tax cash flow
- $3,608/yr
For passive investors: Depreciation is non-cash, so a rental often shows a tax loss while cash-flowing — sheltering income. Rental losses are passive: they offset passive income freely, and up to $25,000/yr can offset ordinary (W-2) income if you actively participate and your MAGI is under $100k (phasing out to $0 by $150k); unused losses carry forward. On sale, claimed depreciation is recaptured at up to 25%, and gains may owe capital-gains tax (a 1031 exchange can defer both). Figures are a year-1 estimate at your 24.0% rate — not tax advice; consult a CPA.
Schools (NCES district)
- District
- Houston ISD
- NCES district ID
- 4823640
- Math proficiency
- 27% ▼ -18.00%
- Reading proficiency
- 35% ▼ -6.00%
- Median HH income
- $46,054
- Composite
- 26.63/100
- National rank
- #7173
- State rank
- #593 of 826 in TX
Livability — Houston
- Score
- 74/100
- State rank
- #184
- US rank
- #4771
Category grades
Schools grade is shown separately in the Schools card above.
Census & demographics
- Census place
- Houston, TX
- County
- Harris County · 4,702,590 people
- City population
- 3,226,434
- Metro
- Houston-The Woodlands-Sugar Land, TX
- Population (ZIP)
- 26,153
- Household income
- $45,574
- Rent vs Own
- Severe rent burden
- 2532.0
Population outlook (Harris County) Hauer SSP2
- Today (2025)
- 5,571,493 people
- By 2030
- 6,089,821 · +9.3%
- By 2040
- 7,142,806 · +28.2%
- By 2050
- 8,185,864 · +46.9%
- By 2075
- 10,574,329 · +89.8%
- By 2100
- 12,109,958 · +117.4%
Race, ethnicity, and origin ACS 2023
- Neighborhood character
- Diverse neighborhood (Simpson 0.55)
- Race & ethnicity
- Black 62% Hispanic / Latino 22% Two or more races 12% White 10% Asian 2%
- Hispanic origin (detail)
- Mexican 15%
- Common ancestry
- Italian 1% Romanian 1% Lithuanian 1%
- Foreign-born
- 11% · Canada
- Languages at home
- 77% English-only · Spanish 19% French/Haitian/Cajun 1% Other Indo-European 1%
Political lean MEDSL · Harris
- 2024 margin
- Lean D (+5.5) · D 52.0% · R 46.4% · Other 1.6%
- 2008→2024 swing
- +3.9pp toward D · 2008: 1.6pp · 2024: 5.5pp
- All cycles
- 2024: D+5.5 2020: D+13.3 2016: D+12.4 2012: D+0.1 2008: D+1.6
Not yet ingested
- Civics
- —
Market trends
- HPI YoY
- ▼ -71.22%
- Current HPI
- 230.2869
- Rent YoY
- ▲ 2.17%
- Metro
- Houston-The Woodlands-Sugar Land, TX
- State GDP YoY
- ▲ 3.95%
- F500 in state
- 110
Industry mix (Fortune 500 HQ in TX)
| Industry | F500 HQs | Revenue |
|---|---|---|
| Energy | 16 | $1,198B |
|
||
| Technology | 5 | $198B |
|
||
| Engineering / Construction | 4 | $72B |
|
||
| Energy Services | 3 | $60B |
|
||
| Utilities | 3 | $41B |
|
||
| Healthcare | 2 | $330B |
|
||
Price history
+0.0% since first listed18 events — show timeline
- 2026-06-02 Listed $110,000 HARMLS
- 2021-10-08 Pending — HARMLS
- 2021-10-04 Pending — HARMLS
- 2021-10-01 Relisted — HARMLS
- 2021-10-01 Listing Removed — HARMLS
- 2021-09-30 Pending — HARMLS
- 2021-09-21 Pending — HARMLS
- 2021-09-20 Pending — HARMLS
- 2021-09-13 Pending — HARMLS
- 2021-09-04 Price Changed $150,000 HARMLS
- 2021-08-25 Listed $160,000 HARMLS
- 2021-04-18 Listing Removed — HARMLS
- 2021-03-18 Listed $147,777 HARMLS
- 2019-11-28 Pending — HARMLS
- 2019-11-26 Pending — HARMLS
- 2019-11-19 Listing Removed — HARMLS
- 2019-11-12 Listed $110,000 HARMLS
- 1988-11-23 Sold (Public Records) — Public Records
Property tax history
+2.9%/yrLatest (2025): $2,923 · +11.6% YoY. Source: county tax records.
Cash-flow waterfall
monthlySold comps — $/sqft
last 12 mo · ≤1 miLoading sold comps…