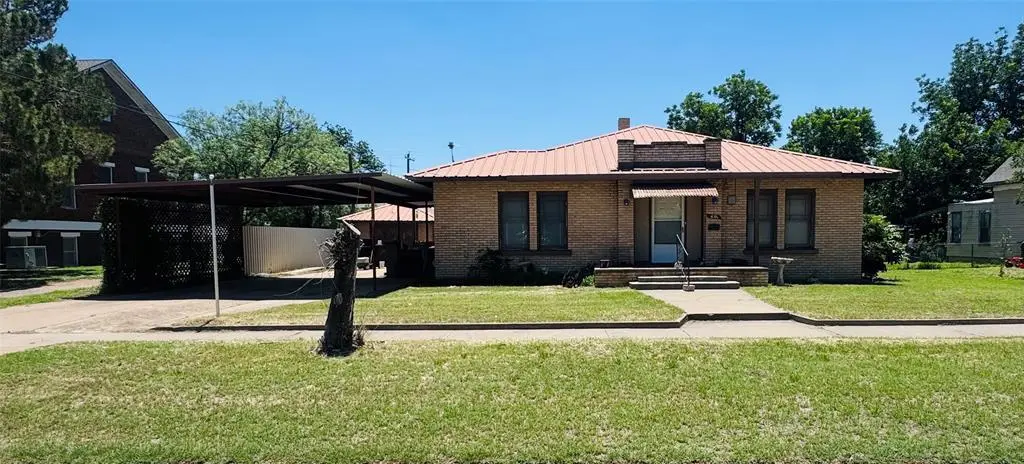
605 N 2nd St · Haskell, TX
Flood risk 1/10 · Minimal
- FEMA flood zone
- —
- Chance of flooding over 30 yrs
- 0.0%
- Est. flood insurance / yr
- —
Fire risk 2/10 · Minimal
- Est. fire insurance / yr
- $1,222 – $2,270
Heat risk 7/10 · Major
- Hot days now (above 107°F)
- 7 days/yr
- Hot days in 30 yrs
- 20 days/yr
Wind risk 3/10 · Minor
- Chance of severe wind over 30 yrs
- 7.0%
Air-quality risk 1/10 · Minimal
- Unhealthy air days now
- 0 days/yr
- Unhealthy air days in 30 yrs
- 0 days/yr
Risk factors via First Street. Map © Google.
Why this score? — see what drove the C+ grade
The composite is a weighted blend of 9 inputs, each scored 0–100. Each bar is that input's sub-score; the figure is the points it added to the 100-point composite (weight × sub-score).
- Cash flow +19.7/30.0
- ARV discount +15.0/15.0
- Appreciation +6.5/10.0
- DSCR +6.2/10.0
- 1% rule +5.5/10.0
- Livability +3.4/5.0
- Schools +2.8/10.0
- Rent growth +2.5/5.0
- Condition / age +2.5/5.0
$115,000
🖨 Deal sheet 📄 Offer letter ✓ Due diligence
Listing remarks
Welcome to this well-built brick home offering 3 spacious bedrooms and 2 full bathrooms. Designed with a functional layout and great flow, this home features a generously sized living room that provides plenty of space for gathering and relaxing. Original hardwood flooring runs through most of the home, adding warmth and timeless character. The property is equipped with a durable metal roof, a fenced backyard, and a water well for added convenience. A rare bonus for the area, the home also includes a basement, providing additional storage space, a storm shelter, or endless possibilities to fit your needs. Outside, you'll find a detached one-car garage complete with electricity and concrete
Key facts
- Metal roof
- Water well
- Basement
Tags
Property features AI
Finance
- Other: Listing status: Active; Possession at closing/funding; Listing agreement: Exclusive Right to Sell
- Financial info: Listing accepts Cash and Conventional financing; No second mortgage indicated
- HOA & community: No homeowners association
Exterior
- Parking: Detached carport (2 covered spaces); Detached garage with single 2-car door; 1-car garage (approximately 13 ft wide x 19 ft long)
- Utilities: City water; City sewer; Electricity connected and available; Natural gas available; Cable available; Phone available; Well
- Home design: Single-family residence; One story; Residential property; Not attached
- Construction: Brick construction; Metal roof; Pillar/post/pier foundation; Built in 1930
- Exterior features: Curb and sidewalk; Asphalt on local roads; Lot smaller than 0.5 acre (approximately 0.225 acre); Location in Original Town Haskell subdivision; Directions: From the stoplight in Haskell, head North on North Avenue E, turn West onto 2nd Street and property is on the left
Interior
- Kitchen: Refrigerator
- Bedrooms: 3 bedrooms (primary bedroom on level 1)
- Flooring: Hardwood/Wood flooring
- Bathrooms: 2 full bathrooms
- Heating & cooling: Central heating; Central electric air conditioning; Ceiling fans
- Interior features: Cable TV available; High-speed internet available; Basement present; One living area; One dining area; Two total rooms (room count: 2)
- Laundry & utility: Utility room; Full-size washer/dryer area; Washer hookup
Neighborhood map
What this means for you Summary
Snapshot
- This is a 3-bed/2.0-bath single-family listed at $115k.
Deal economics
- At list price, monthly cash flow is $134 ($2k/yr) — positive.
- The deal already cash-flows at list — no discount required.
- Meets the 1% rule at list price ($1k rent vs $115k).
Location & tenants
- Location reads 67/100 on livability (#573 in TX) — a middle-class / working-renter tenant base. Strengths: crime A+, cost of living A+, housing A+; Watch: health & safety C-, amenities F, commute F.
- Haskell CISD (town): math 31% / reading 36% proficiency, ranked #561 of 826 in TX (top 68%) — families likely to look elsewhere, expect single-tenant / working-renter base with shorter leases; 63% free/reduced lunch — lower-income household profile, screen leases tightly.
- Zoned schools: Haskell El (math 27% / reading 37%, grade F, #2,268 of 4,322 statewide, top 55%, 267 students, 68% FRL).
- Market conditions: 45 active listings in the ZIP.
Forward outlook
- In year one you build about $4k of equity ($795 loan paydown + $4k appreciation (3.1% local appreciation)).
- Haskell County population projected at +6% by 2050 — modest demand growth; plan on rents tracking national, not racing it.
- At projected returns (3.1% appreciation + 3.0% rent growth), your $32k cash investment doubles in ~5 years — after that, you're playing with house money.
- By year 8, paydown + projected appreciation supports a ~$32k cash-out refi (75% LTV) — recoverable capital for the next deal without selling this one.
Negotiation context
- Only 9 days on market — expect competitive offers; lowballing is unlikely to land.
Risks & watch-outs
- Watch-outs: built in 1930 — expect roof / HVAC / electrical / plumbing capex.
- Climate carrying-cost: extreme-heat days projected 7→20/yr by 2055 (HVAC capex compounding) — expect insurance premiums to compound above CPI over the hold.
Questions for the listing agent
- Built in 1930 — when were the roof, HVAC, electrical panel, plumbing, and water heater last replaced?
- Is there a deadline driving the sale (1031 exchange, divorce, estate, relocation)? That informs how much negotiation room exists.
- Schools are D-rated, which usually means shorter tenancies and higher turnover. Who's the typical renter profile here, and what's been the actual vacancy rate?
- What's the average days-on-market for RENTAL listings here right now (not sales)? A rising rental-DOM trend means longer vacancies and softer asking-rent achievability than the comps imply.
- What's the recent tenant-quality profile in this submarket — average credit score on applications, eviction rate, late-payment / NSF rate, and stable-employment percentage? A property-management company in the area should have these aggregated.
- How much new for-sale + rental construction is in the pipeline within 1–3 miles? Heavy new supply typically softens prices + rents 12–24 months out; constrained supply supports both.
Investment metrics
- 1% rule
- 1.05% ✓
- Cap rate
- 7.69%
- Cash-on-cash
- 4.98%
- DSCR
- 1.22
- GRM
- 7.9
CMA / ARV
- ARV (on-the-fly)
- $157,700
- Comps found
- 7
Show comp detail 7 sales within ~0.75 mi
| Address | Dist | Beds/Ba | Sqft | Sold | Price | $/sf | Match |
|---|---|---|---|---|---|---|---|
| 604 N 8th St | 0.43mi | 3/2.0 | 1,620 (-2%) | 7mo | $165,000 | $102 | 70 |
| 1005 N 7th St | 0.41mi | 2/1.0 (-1) | 1,579 (-5%) | 2mo | $64,000 | $41 | 62 |
| 1205 N Avenue H | 0.72mi | 3/2.0 | 1,621 (-2%) | 10mo | $154,000 | $95 | 54 |
| 1022 N 6th St | 0.41mi | 3/2.0 | 1,783 (+7%) | 18mo | $59,700 | $33 | 53 |
| 805 N 11th St | 0.61mi | 4/2.5 (+1) | 1,778 (+7%) | 2mo | $225,000 | $127 | 51 |
| 1605 Derrick Dr | 0.68mi | 3/2.0 | 1,579 (-5%) | 14mo | $199,900 | $127 | 48 |
| 1301 N Avenue F | 0.75mi | 3/2.0 | 1,614 (-3%) | 21mo | $115,000 | $71 | 43 |
Match score weights: distance 35% · size 25% · config 20% · recency 20%. Top-matched comps best support the ARV.
Projected returns pro-forma
3.09% appreciation · 3.0% rent growth · sell at horizon
- IRR
- 12.4%
- Equity multiple
- 1.71×
- Total profit
- $22,965
- Equity at exit
- $52,307
- IRR
- 14.4%
- Equity multiple
- 3.15×
- Total profit
- $69,197
- Equity at exit
- $81,080
Cash invested: $32,200 (down + closing). Projections, not guarantees.
Landlord ↔ Tenant lean methodology
- Overall (STATE)
- 87 Strongly Landlord-Friendly
- State Texas
- 87 Strongly Landlord-Friendly · R+5
- County
- — inherits STATE
- City
- — inherits STATE
ZIP-level market 79521
- Home prices YoY
- 2.6%
- Active inventory
- 45
- Price-to-rent
- 7.9×
Monthly cashflow live
- Estimated rent
- $1,213 medium interval (Pro) →
- Mortgage (P&I)
- −$603
- Tax from tax record
- −$173 /mo · $2,080/yr
- Insurance
- −$48
- HOA
- −$0
- Vacancy / Maint / Mgmt
- −$255
- Net cashflow
- $134
Break-even live
UW: 25.0% down · 7.5% · 30yr · 1.5% tax · 5.0% vac · 8.0% maint · 8.0% mgmt
Financing live
Cash to close
- Down payment
- $28,750
- Closing costs
- $3,450
- Reserves months
- —
- Total cash needed
- —
Loan-product check · same deal, 3 products live
Conventional
25% down · 7.5% · 30yr
- Down + closing
- —
- Monthly P&I
- —
- Monthly cashflow
- —
- DSCR
- —
- Eligible?
- —
Personal DTI + credit; lowest rate.
DSCR
20% down · 8.5% · 30yr
- Down + closing
- —
- Monthly P&I
- —
- Monthly cashflow
- —
- DSCR
- —
- Eligible?
- —
No personal income docs; deal must DSCR.
Hard money
10% down · 12.0% · 12mo
- Down + closing
- —
- Monthly P&I
- —
- Monthly cashflow
- —
- DSCR
- —
- Eligible?
- —
Short-term bridge; refi at stabilization.
Listing history 8 events
-
2026-06-18days on market $115,000 Active 9 DOM
-
2026-06-17days on market $115,000 Active 8 DOM
-
2026-06-16days on market $115,000 Active 7 DOM
-
2026-06-15days on market $115,000 Active 6 DOM
-
2026-06-13days on market $115,000 Active 4 DOM
-
2026-06-12days on market $115,000 Active 3 DOM
-
2026-06-10remarks 699-char remark
-
2026-06-10$115,000 Active 1 DOM
ⓘ Source: listings_history table (triggers on properties + properties_extension) + one-shot
backfill from property_details.listing_events for pre-trigger history.
Tax reassessment forecast TX · Resets to sale price
- Current annual tax
- $2,080 · $173/mo
- Projected year-2 tax
- $2,104 · $175/mo
- Expected delta
- +$25/yr (+$2/mo · 1.2%)
ⓘ Screening estimate from a state-policy table — verify with the county assessor before closing.
Climate risk First Street
- Flood 1/10 Low 0% chance over 30 yrs
- Wildfire 2/10 Low
- Heat 7/10 Severe 7 d/yr ≥107°F today · 20 d/yr by 30 yrs out
- Wind 3/10 Moderate 7% chance of damaging wind over 30 yrs
- Air quality 1/10 Low 0 unhealthy d/yr today · 0 by 30 yrs out
Nearby sold comps map
Loading sold comps map…
Walkable amenities ~0.75 mi
Loading nearby amenities…
Taxation est. · year 1
- Rental income
- $14,551
- − Mortgage interest
- −$6,442
- − Property taxes
- −$2,080
- − Insurance
- −$575
- − Repairs & maintenance
- −$1,164
- − Management
- −$1,164
- − Depreciation
- −$3,345
- Taxable loss
- −$219
- Est. tax savings @ 24.0%
- +$53
- After-tax cash flow
- $1,656/yr
For passive investors: Depreciation is non-cash, so a rental often shows a tax loss while cash-flowing — sheltering income. Rental losses are passive: they offset passive income freely, and up to $25,000/yr can offset ordinary (W-2) income if you actively participate and your MAGI is under $100k (phasing out to $0 by $150k); unused losses carry forward. On sale, claimed depreciation is recaptured at up to 25%, and gains may owe capital-gains tax (a 1031 exchange can defer both). Figures are a year-1 estimate at your 24.0% rate — not tax advice; consult a CPA.
Schools (NCES district)
- District
- Haskell CISD
- NCES district ID
- 4822740
- Math proficiency
- 31% ▼ -18.00%
- Reading proficiency
- 36% ▼ -8.00%
- Median HH income
- $41,661
- Composite
- 28.29/100
- National rank
- #6791
- State rank
- #561 of 826 in TX
Livability — Haskell
- Score
- 67/100
- State rank
- #573
- US rank
- #10965
Category grades
Schools grade is shown separately in the Schools card above.
Census & demographics
- Census place
- Haskell, TX
- Population (ZIP)
- 3,470
Population outlook (Haskell County) Hauer SSP2
- Today (2025)
- 5,679 people
- By 2030
- 5,693 · +0.2%
- By 2040
- 5,769 · +1.6%
- By 2050
- 6,012 · +5.9%
- By 2075
- 6,792 · +19.6%
- By 2100
- 6,531 · +15.0%
Race, ethnicity, and origin ACS 2023
- Neighborhood character
- Predominantly White (70%)
- Race & ethnicity
- White 70% Hispanic / Latino 22% Black 7% Two or more races 4%
- Hispanic origin (detail)
- Mexican 18%
- Common ancestry
- Serbian 4% Slovak 3% Lithuanian 2%
- Foreign-born
- 7% · Canada
- Languages at home
- 79% English-only · Spanish 19% Other Indo-European 1%
Political lean MEDSL · Haskell
- 2024 margin
- Solid R (+71.5) · D 13.9% · R 85.4%
- 2008→2024 swing
- -38.9pp toward R · 2008: -32.6pp · 2024: -71.5pp
- All cycles
- 2024: R+71.5 2020: R+67.2 2016: R+61.7 2012: R+43.4 2008: R+32.6
Not yet ingested
- Civics
- —
Market trends
- HPI YoY
- ▲ 3.09%
- Current HPI
- 121.407
- Rent YoY
- —
- Metro
- —
- State GDP YoY
- ▲ 3.95%
- F500 in state
- 110
Industry mix (Fortune 500 HQ in TX)
| Industry | F500 HQs | Revenue |
|---|---|---|
| Energy | 16 | $1,198B |
|
||
| Technology | 5 | $198B |
|
||
| Engineering / Construction | 4 | $72B |
|
||
| Energy Services | 3 | $60B |
|
||
| Utilities | 3 | $41B |
|
||
| Healthcare | 2 | $330B |
|
||
Price history
2 events — show timeline
- 2026-06-09 Listed $115,000 NTREIS
- 2010-04-19 Sold (Public Records) — Public Records
Property tax history
+5.0%/yrLatest (2025): $2,080 · +5.8% YoY. Source: county tax records.
Cash-flow waterfall
monthlySold comps — $/sqft
last 12 mo · ≤1 miLoading sold comps…