 Duplex
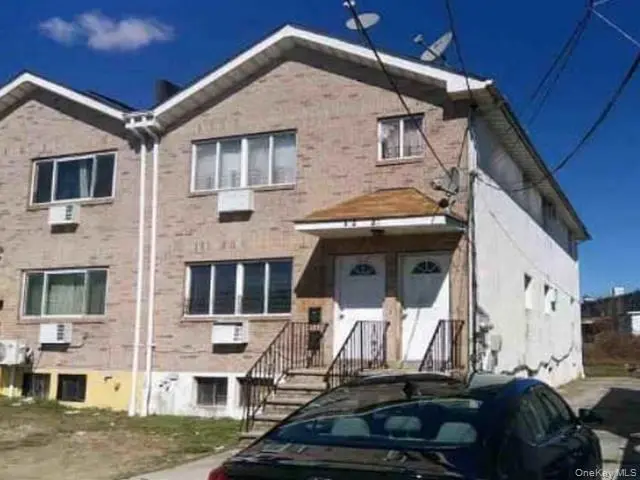
14227 122nd Ave · New York, NY
Flood risk 1/10 · Minimal
- FEMA flood zone
- X (unshaded)
- Chance of flooding over 30 yrs
- 0.0%
- Est. flood insurance / yr
- $507 – $1,088
Fire risk 1/10 · Minimal
- Est. fire insurance / yr
- $691 – $1,283
Heat risk 7/10 · Major
- Hot days now (above 99°F)
- 7 days/yr
- Hot days in 30 yrs
- 16 days/yr
Wind risk 6/10 · Moderate
- Chance of severe wind over 30 yrs
- 53.0%
Air-quality risk 4/10 · Minor
- Unhealthy air days now
- 6 days/yr
- Unhealthy air days in 30 yrs
- 6 days/yr
Risk factors via First Street. Map © Google.
Why this score? — see what drove the D+ grade
The composite is a weighted blend of 9 inputs, each scored 0–100. Each bar is that input's sub-score; the figure is the points it added to the 100-point composite (weight × sub-score).
- ARV discount +15.0/15.0
- Cash flow +13.1/30.0
- Schools +5.0/10.0
- DSCR +3.9/10.0
- Livability +3.8/5.0
- 1% rule +3.2/10.0
- Rent growth +2.5/5.0
- Condition / age +2.5/5.0
- Appreciation +0.0/10.0
$833,200
🖨 Deal sheet (PDF) 📄 Offer letter ✓ Due diligence
Multi-family units
County records classify this as Multi-Family (2-4 Unit). Listing-text estimate: 2 units. confirmed
Listing remarks
Occupied REO property being sold as is. No interior access available. Property features include approximately 6 beds, 2 full baths & 2 half baths, and approx. 2,376 square footage, based on available records. Conveniently located with access to nearby roads and amenities.
Key facts
- 5,332 sq ft lot
- Built 2002
- Listed 89 days
Property features AI
Finance
- Other: Property marketed as a multi-unit duplex
- Financial info: Tax year 2025
Exterior
- Parking: No carport; No designated parking
- Utilities: Public sewer; Utilities: See remarks
- Home design: Duplex; Total building area approximately 2,376 sq. ft. (appraiser)
- Construction: Frame construction
- Exterior features: Frame construction; Not waterfront
Interior
- Bedrooms: Two 3-bedroom units
- Bathrooms: Four full bathrooms
- Heating & cooling: Baseboard heating; Natural gas heating; Other heating; No cooling
- Interior features: Other interior features
Neighborhood map
What this means for you Summary
Snapshot
- This is a 2 × 3-bed/2.5-bath units multifamily listed at $833k.
Deal economics
- At list price, monthly cash flow is $-38 ($-451/yr) — negative. Per door: $-19/mo.
- To cash-flow at today's rent, offer at most $827k (0.8% below list).
- To meet the 1% rule (rent ≥ 1% of price), the offer needs to be $681k (18.3% below list).
- Recommended offer: $681k (18.3% below list) — sets the bar for 1% rule.
- Cap rate 6.2% vs local median 2.6% in New York — top-decile yield for the area; either an underpriced asset or a hidden risk that comps aren't pricing in. Stress-test before assuming the spread holds.
Location & tenants
- Location reads 75/100 on livability (#268 in NY, #4,188 nationally) — a middle-class / working-renter tenant base. Strengths: amenities A+, commute A+, health & safety A; Watch: crime F, cost of living F.
- Zoned schools: Elm Tree Elementary School (math 27% / reading 52%, grade F, #1,444 of 2,108 statewide, top 71%, 806 students, 94% FRL); Is 227 Louis Armstrong (math 52% / reading 69%, grade B+, #153 of 729 statewide, top 21%, 1,528 students, 68% FRL); Midwood High School (math 94% / reading 96%, grade A+, #83 of 1,100 statewide, top 8%, 4,062 students, 73% FRL).
- Market conditions: 97 active listings in the ZIP; 5,302 units permitted in Queens County in 2024 (4,918 in 5+ unit buildings).
Forward outlook
- Local home prices are declining (-3.0%/yr); year-one equity from $6k of loan paydown is wiped out by about $25k of value loss. Plan a longer hold.
- Queens County population projected at +16% by 2050 — long-run rental-demand tailwind backs the buy-and-hold thesis.
Negotiation context
- It's been on market 89 days — a 6% lower offer ($783k) is reasonable based on typical stale-listing flexibility.
- Current owner paid $140k; list at $833k implies a 495% gain — meaningful room to come down on a strong offer.
Risks & watch-outs
- Climate carrying-cost: major wind risk, 53% chance of damaging wind over 30y; extreme-heat days projected 7→16/yr by 2055 (HVAC capex compounding) — expect insurance premiums to compound above CPI over the hold.
Questions for the listing agent
- What do current leases actually rent for vs. the listed asking? Can we see a recent rent roll and the last 12 months of T-12 income?
- It's been on market 89 days. Have you received any prior offers? Is the seller open to a 18% concession, seller financing, or rate buy-down credit?
- Can we see the unit-by-unit rent roll, current vacancy, and any below-market leases? What's the average tenancy length?
- What capital expenditures (roof, boiler, parking lot, exteriors) have been made in the last 5 years, and what's planned in the next 2?
- Why hasn't it sold? Are there any deal-killer items the seller is aware of (foundation, flood, title, zoning, code violations)?
- Is there a deadline driving the sale (1031 exchange, divorce, estate, relocation)? That informs how much negotiation room exists.
- Schools are B-rated — typically a magnet for longer-tenancy family renters. What's the average tenant stay here, and is there a school-zone premium baked into asking?
- Crime grade is F in this area — have there been break-ins, vandalism, or insurance claims at this property in the last 3 years? What carrier currently insures it and at what premium?
- The area grade is low — what's the realistic commute time and amenity access for the typical tenant pool here? Any planned neighborhood developments (good or bad) we should know about?
- What's the average days-on-market for RENTAL listings here right now (not sales)? A rising rental-DOM trend means longer vacancies and softer asking-rent achievability than the comps imply.
- What's the recent tenant-quality profile in this submarket — average credit score on applications, eviction rate, late-payment / NSF rate, and stable-employment percentage? A property-management company in the area should have these aggregated.
- How much new apartment / multifamily construction is in the pipeline within 1–3 miles? Heavy new supply (>2% of stock underway) typically softens rents 12–24 months out; light construction supports rent growth.
Investment metrics
- 1% rule
- 0.82% ✗
- Cap rate
- 6.24%
- Cash-on-cash
- -0.19%
- DSCR
- 0.99
- GRM
- 10.2
CMA / ARV
- ARV (on-the-fly)
- $1,264,032
- Comps found
- 12
Show comp detail 12 sales within ~0.75 mi
| Address | Dist | Beds/Ba | Sqft | Sold | Price | $/sf | Match |
|---|---|---|---|---|---|---|---|
| 117-18 145 St | 0.25mi | 6/5.0 | 2,500 (+5%) | 3mo | $1,400,000 | $560 | 78 |
| 13016 Inwood St | 0.41mi | 6/5.0 | 2,304 (-3%) | 3mo | $1,225,000 | $532 | 73 |
| 115-42 Inwood St | 0.46mi | 6/5.0 | 2,400 (+1%) | 7mo | $1,415,000 | $590 | 71 |
| 11628 Van Wyck Expy | 0.44mi | 6/3.0 | 2,350 (-1%) | 8mo | $1,070,000 | $455 | 63 |
| 130-47 145th St | 0.46mi | 6/5.0 | 2,510 (+6%) | 10mo | $1,450,000 | $578 | 61 |
| 153-23 123 Ave | 0.50mi | 6/4.0 | 2,500 (+5%) | 5mo | $1,180,000 | $472 | 60 |
| 13031 Inwood St | 0.45mi | 6/5.0 | 2,200 (-7%) | 11mo | $1,325,000 | $602 | 57 |
| 12808 Sutter Ave | 0.73mi | 6/3.0 | 2,300 (-3%) | 6mo | $1,165,000 | $507 | 47 |
| 13023 149th St | 0.58mi | 6/2.0 | 2,500 (+5%) | 8mo | $991,000 | $396 | 46 |
| 115-08 145 St | 0.51mi | 6/3.0 | 2,024 (-15%) | 8mo | $999,999 | $494 | 36 |
| 131-17 133 St | 0.57mi | 6/2.0 | 2,100 (-12%) | 10mo | $1,180,000 | $562 | 34 |
| 14717 N Conduit Ave | 0.64mi | 6/2.0 | 2,024 (-15%) | 4mo | $995,000 | $492 | 30 |
Match score weights: distance 35% · size 25% · config 20% · recency 20%. Top-matched comps best support the ARV.
Projected returns pro-forma
-3.0% appreciation · 3.0% rent growth · sell at horizon
- IRR
- -16.6%
- Equity multiple
- 0.41×
- Total profit
- $-137,518
- Equity at exit
- $124,233
- IRR
- -8.5%
- Equity multiple
- 0.47×
- Total profit
- $-123,271
- Equity at exit
- $72,040
Cash invested: $233,296 (down + closing). Projections, not guarantees.
Landlord ↔ Tenant lean methodology
- Overall (CITY)
- 0 Strongly Tenant-Friendly
- State New York
- 15 Strongly Tenant-Friendly · D+10
- County
- — inherits STATE
- City New York
- 0 Strongly Tenant-Friendly · D+34
ZIP-level market 11436
- Home prices YoY
- -30.8%
- Active inventory
- 97
- Price-to-rent
- 20.4×
Monthly cashflow live
- Estimated rent
- $6,807 high interval (Pro) →
- Mortgage (P&I)
- −$4,369
- Tax from tax record
- −$699 /mo · $8,383/yr
- Insurance
- −$347
- HOA
- −$0
- Vacancy / Maint / Mgmt
- −$1,429
- Net cashflow
- $-38
Break-even live
Sensitivity live
| Price | -10% $434 | -5% $198 | +0% $-38 | +5% $-273 | +10% $-509 |
|---|---|---|---|---|---|
| Rent | -10% $-575 | -5% $-306 | +0% $-38 | +5% $231 | +10% $500 |
| Rate | -1.0pp $382 | -0.5pp $174 | base $-38 | +0.5pp $-254 | +1.0pp $-473 |
2-unit breakdown (identical units grouped — click to expand)
| Units | Beds | Baths | Est. rent |
|---|---|---|---|
| 2× units | 3 | 2.5 | $6,808 |
| #1 | 3 | 2.5 | $3,404 |
| #2 | 3 | 2.5 | $3,404 |
| Total (2 units) | $6,807 | ||
UW: 25.0% down · 7.5% · 30yr · 1.5% tax · 5.0% vac · 8.0% maint · 8.0% mgmt
Financing live
Cash to close
- Down payment
- $208,300
- Closing costs
- $24,996
- Reserves months
- —
- Total cash needed
- —
Loan-product check · same deal, 3 products live
Conventional
25% down · 7.5% · 30yr
- Down + closing
- —
- Monthly P&I
- —
- Monthly cashflow
- —
- DSCR
- —
- Eligible?
- —
Personal DTI + credit; lowest rate.
DSCR
20% down · 8.5% · 30yr
- Down + closing
- —
- Monthly P&I
- —
- Monthly cashflow
- —
- DSCR
- —
- Eligible?
- —
No personal income docs; deal must DSCR.
Hard money
10% down · 12.0% · 12mo
- Down + closing
- —
- Monthly P&I
- —
- Monthly cashflow
- —
- DSCR
- —
- Eligible?
- —
Short-term bridge; refi at stabilization.
Listing history 17 events
-
2026-06-21days on market $833,200 Active 89 DOM
-
2026-06-18days on market $833,200 Active 86 DOM
-
2026-06-17days on market $833,200 Active 85 DOM
-
2026-06-15days on market $833,200 Active 83 DOM
-
2026-06-13days on market $833,200 Active 81 DOM
-
2026-06-10days on market $833,200 Active 77 DOM
-
2026-06-08days on market $833,200 Active 76 DOM
-
2026-06-08days on market $833,200 Active 75 DOM
-
2026-06-04days on market $833,200 Active 72 DOM
-
2026-06-03days on market $833,200 Active 71 DOM
-
2026-06-01days on market $833,200 Active 69 DOM
-
2026-05-31days on market $833,200 Active 68 DOM
-
2026-04-24price $833,200
-
2026-04-16price $837,400
-
2026-03-26price $845,300
-
2026-03-24$837,400 Active
-
2001-06-12soldstatus $140,000
ⓘ Source: listings_history table (triggers on properties + properties_extension) + one-shot
backfill from property_details.listing_events for pre-trigger history.
Tax reassessment forecast NY · Partial reset (capped growth)
- Current annual tax
- $8,383 · $699/mo
- Projected year-2 tax
- $11,232 · $936/mo
- Expected delta
- +$2,849/yr (+$237/mo · 34.0%)
ⓘ Screening estimate from a state-policy table — verify with the county assessor before closing.
Climate risk First Street
- Flood 1/10 Low FEMA zone X (unshaded) · 0% chance over 30 yrs
- Wildfire 1/10 Low
- Heat 7/10 Severe 7 d/yr ≥99°F today · 16 d/yr by 30 yrs out
- Wind 6/10 Major 53% chance of damaging wind over 30 yrs
- Air quality 4/10 Moderate 6 unhealthy d/yr today · 6 by 30 yrs out
Nearby sold comps map
Loading sold comps map…
Walkable amenities ~0.75 mi
Loading nearby amenities…
Taxation est. · year 1
- Rental income
- $81,684
- − Mortgage interest
- −$46,672
- − Property taxes
- −$8,383
- − Insurance
- −$4,166
- − Repairs & maintenance
- −$6,535
- − Management
- −$6,535
- − Depreciation
- −$24,239
- Taxable loss
- −$14,845
- Est. tax savings @ 24.0%
- +$3,563
- After-tax cash flow
- $3,111/yr
For passive investors: Depreciation is non-cash, so a rental often shows a tax loss while cash-flowing — sheltering income. Rental losses are passive: they offset passive income freely, and up to $25,000/yr can offset ordinary (W-2) income if you actively participate and your MAGI is under $100k (phasing out to $0 by $150k); unused losses carry forward. On sale, claimed depreciation is recaptured at up to 25%, and gains may owe capital-gains tax (a 1031 exchange can defer both). Figures are a year-1 estimate at your 24.0% rate — not tax advice; consult a CPA.
Schools (NCES district)
No district data.
Livability — New York
- Score
- 75/100
- State rank
- #268
- US rank
- #4188
Category grades
Schools grade is shown separately in the Schools card above.
Census & demographics
- Census place
- New York, NY
- City population
- 7,731,280
- Population (ZIP)
- 21,364
Population outlook (Queens County) Hauer SSP2
- Today (2025)
- 2,546,320 people
- By 2030
- 2,643,059 · +3.8%
- By 2040
- 2,815,563 · +10.6%
- By 2050
- 2,944,423 · +15.6%
- By 2075
- 3,123,338 · +22.7%
- By 2100
- 3,098,688 · +21.7%
Race, ethnicity, and origin ACS 2023
- Neighborhood character
- Diverse neighborhood (Simpson 0.64)
- Race & ethnicity
- Black 59% Hispanic / Latino 12% Two or more races 11% Asian 7% White 1%
- Hispanic origin (detail)
- Puerto Rican 4% Dominican 5%
- Common ancestry
- Hispanic 4%
- Foreign-born
- 48% · Canada, Jamaica, China
- Languages at home
- 81% English-only · Spanish 8% French/Haitian/Cajun 5% Other Indo-European 3%
Political lean MEDSL · Queens
- 2024 margin
- Strong D (+24.6) · D 62.3% · R 37.7%
- 2008→2024 swing
- -26.2pp toward R · 2008: 50.8pp · 2024: 24.6pp
- All cycles
- 2024: D+24.6 2020: D+45.2 2016: D+53.4 2012: D+58.5 2008: D+50.8
Not yet ingested
- Civics
- —
Market trends
- HPI YoY
- ▼ -194.32%
- Current HPI
- 437.2442
- Rent YoY
- —
- Metro
- —
- State GDP YoY
- ▲ 2.60%
- F500 in state
- 92
Industry mix (Fortune 500 HQ in NY)
| Industry | F500 HQs | Revenue |
|---|---|---|
| Financial Services | 10 | $950B |
|
||
| Consumer Goods | 9 | $162B |
|
||
| Insurance | 4 | $225B |
|
||
| Telecommunications | 2 | $144B |
|
||
| Pharmaceuticals | 2 | $112B |
|
||
| Media / Entertainment | 2 | $69B |
|
||
Price history
+495.1% since first listed5 events — show timeline
- 2026-04-24 Price Changed $833,200 OneKey® MLS as Distributed by MLS Grid
- 2026-04-16 Price Changed $837,400 OneKey® MLS as Distributed by MLS Grid
- 2026-03-26 Price Changed $845,300 OneKey® MLS as Distributed by MLS Grid
- 2026-03-24 Listed $837,400 OneKey® MLS as Distributed by MLS Grid
- 2001-06-12 Sold (Public Records) $140,000 Public Records
Property tax history
+5.0%/yrLatest (2025): $8,383 · -0.2% YoY. Source: county tax records.
Cash-flow waterfall
monthlySold comps — $/sqft
last 12 mo · ≤1 miLoading sold comps…