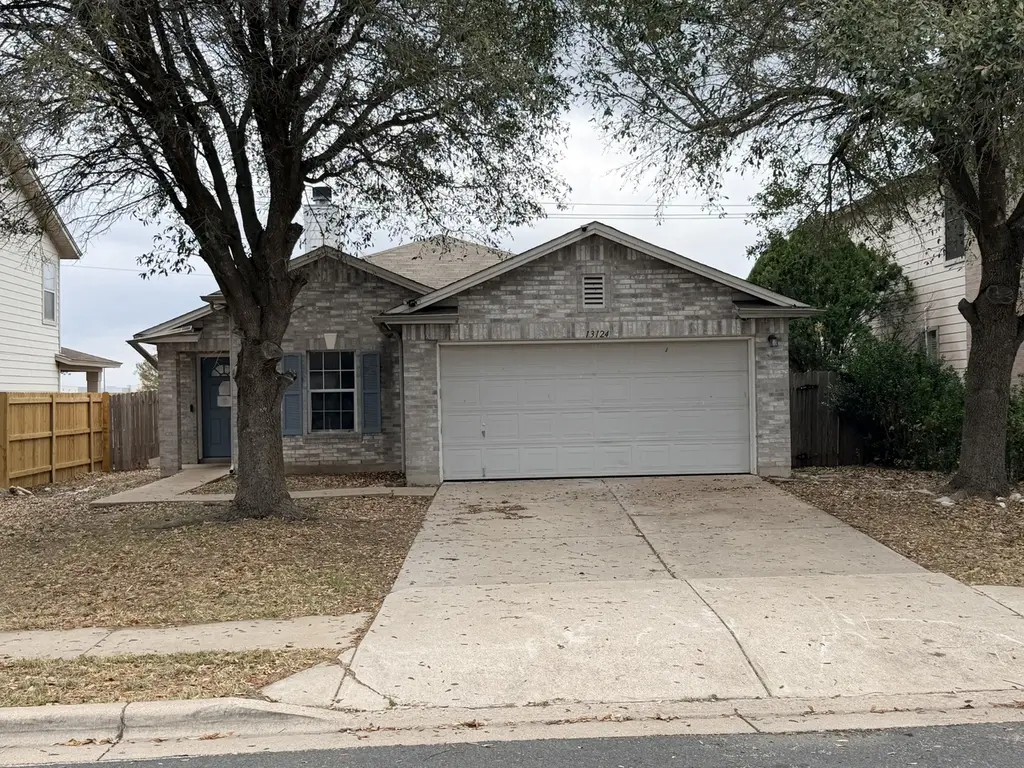
13124 Dearbonne Dr · Austin, TX
Flood risk 1/10 · Minimal
- FEMA flood zone
- X (unshaded)
- Chance of flooding over 30 yrs
- 0.0%
- Est. flood insurance / yr
- $507 – $1,088
Fire risk 5/10 · Moderate
- Est. fire insurance / yr
- $1,222 – $2,270
Heat risk 8/10 · Major
- Hot days now (above 108°F)
- 7 days/yr
- Hot days in 30 yrs
- 23 days/yr
Wind risk 8/10 · Major
- Chance of severe wind over 30 yrs
- 80.0%
Air-quality risk 1/10 · Minimal
- Unhealthy air days now
- 0 days/yr
- Unhealthy air days in 30 yrs
- 0 days/yr
Risk factors via First Street. Map © Google.
Why this score? — see what drove the C+ grade
The composite is a weighted blend of 9 inputs, each scored 0–100. Each bar is that input's sub-score; the figure is the points it added to the 100-point composite (weight × sub-score).
- Cash flow +24.1/30.0
- 1% rule +8.4/10.0
- DSCR +7.8/10.0
- ARV discount +7.5/15.0
- Livability +4.1/5.0
- Appreciation +3.4/10.0
- Condition / age +2.5/5.0
- Rent growth +2.4/5.0
- Schools +1.9/10.0
$145,000
🖨 Deal sheet (PDF) 📄 Offer letter ✓ Due diligence
Listing remarks MLS
Unlock the potential at 13124 Dearbonne Dr—this 3-bedroom, 2-bath home offers an open floor plan filled with natural light, creating a bright and airy feel from the moment you walk in. The layout flows easily from living to dining to kitchen, giving you a solid foundation to refresh and make your own. While the home shows deferred maintenance and is ready for updates, it’s priced with that opportunity in mind—ideal for buyers looking to customize or invest. Located in Del Valle with convenient access to Tesla Gigafactory, Austin-Bergstrom International Airport, and major routes like Hwy 71, you’re also near everyday stops like H-E-B, Southpark Meadows, and McKinney Falls State Park for outdoor escapes. A smart buy with space, location, and upside—this is where vision meets value.
Key facts
- Open floor plan
- Convenient access
- Natural light
Tags
Neighborhood map
What this means for you Summary
Snapshot
- This is a 3-bed/2.0-bath single-family listed at $145k.
Deal economics
- At list price, monthly cash flow is $285 ($3k/yr) — positive.
- The deal already cash-flows at list — no discount required.
- Meets the 1% rule at list price ($2k rent vs $145k).
- Recommended offer: $143k (1.5% below list) — sets the bar for market timing.
- Cap rate 8.7% vs local median 1.8% in Austin — top-decile yield for the area; either an underpriced asset or a hidden risk that comps aren't pricing in. Stress-test before assuming the spread holds.
Location & tenants
- Location reads 82/100 on livability (#16 in TX, #1,208 nationally) — a professional / high-income tenant draw. Strengths: amenities A+, commute A+, employment A+; Watch: cost of living D, crime F.
- Del Valle ISD (rural): math 19% / reading 26% proficiency, ranked #749 of 826 in TX (top 91%) — low school quality limits family demand, transient renter base, plan for 1-2y turnover; 77% free/reduced lunch — lower-income household profile, screen leases tightly.
- Zoned schools: Del Valle El (math 22% / reading 22%, grade F, #3,333 of 4,322 statewide, top 80%, 615 students, 89% FRL); Del Valle H S (math 17% / reading 28%, grade F, #1,354 of 1,632 statewide, top 83%, 3,460 students, 90% FRL).
- Market conditions: Rents soft (-0.4%/yr); 251 active listings in the ZIP; 16 comparable units currently listed for rent nearby; rentals at typical pace (median 18d on market — plan ~3-4 weeks tenant-placement turnaround); 17,121 units permitted in Travis County in 2024 (11,963 in 5+ unit buildings).
- This rent runs 33% of the median local income ($72k/yr) — at the standard rent-burdened threshold; future hikes will face affordability resistance.
Forward outlook
- Local home prices are declining (-3.0%/yr); year-one equity from $1k of loan paydown is wiped out by about $4k of value loss. Plan a longer hold.
- Travis County population projected at +60% by 2050 — long-run rental-demand tailwind backs the buy-and-hold thesis.
Negotiation context
- It's been on market 20 days — a 2% lower offer ($143k) is reasonable based on typical stale-listing flexibility.
- 5 sale attempts since 16y ago with the ask held roughly flat each time — persistent listings suggest the price (not the market) is what's stuck; bring a comps-based counter.
Risks & watch-outs
- Watch-outs: property tax is 3.2% of price.
- Climate carrying-cost: severe wind risk, 80% chance of damaging wind over 30y; moderate wildfire risk; extreme-heat days projected 7→23/yr by 2055 (HVAC capex compounding) — expect insurance premiums to compound above CPI over the hold.
Questions for the listing agent
- Property tax is high relative to price — has the assessment been appealed recently, and will the sale trigger a re-assessment?
- What does the HOA fee cover, when was the last increase, and are there any pending special assessments or reserve-fund shortfalls?
- Is there a deadline driving the sale (1031 exchange, divorce, estate, relocation)? That informs how much negotiation room exists.
- Crime grade is F in this area — have there been break-ins, vandalism, or insurance claims at this property in the last 3 years? What carrier currently insures it and at what premium?
- What's the average days-on-market for RENTAL listings here right now (not sales)? A rising rental-DOM trend means longer vacancies and softer asking-rent achievability than the comps imply.
- What's the recent tenant-quality profile in this submarket — average credit score on applications, eviction rate, late-payment / NSF rate, and stable-employment percentage? A property-management company in the area should have these aggregated.
- How much new for-sale + rental construction is in the pipeline within 1–3 miles? Heavy new supply typically softens prices + rents 12–24 months out; constrained supply supports both.
Investment metrics
- 1% rule
- 1.34% ✓
- Cap rate
- 8.65%
- Cash-on-cash
- 8.43%
- DSCR
- 1.38
- GRM
- 6.2
CMA / ARV
- ARV (median comp)
- $302,028
- List price
- $145,000
- Delta
- -51.99%
- Verdict
- UNDERPRICED
- Comps
- 20 within 1.0 mi
Show comp detail 12 sales within ~0.75 mi
| Address | Dist | Beds/Ba | Sqft | Sold | Price | $/sf | Match |
|---|---|---|---|---|---|---|---|
| 13309 Thome Valley Dr | 0.18mi | 3/2.0 | 1,343 (-7%) | 4mo | $225,000 | $168 | 77 |
| 4937 Hazelnut Ln | 0.36mi | 3/2.0 | 1,477 (+2%) | 6mo | $332,185 | $225 | 74 |
| 5012 Hazelnut Ln | 0.40mi | 3/2.0 | 1,477 (+2%) | 6mo | $317,980 | $215 | 73 |
| 4905 Stockton Ln | 0.40mi | 3/2.0 | 1,477 (+2%) | 6mo | $322,980 | $219 | 73 |
| 5024 Hazelnut Ln | 0.42mi | 3/2.0 | 1,477 (+2%) | 5mo | $330,180 | $224 | 72 |
| 5805 Alomar Cv | 0.55mi | 3/2.0 | 1,433 (-1%) | 1mo | $269,500 | $188 | 72 |
| 4901 Stockton Ln | 0.41mi | 3/2.0 | 1,498 (+4%) | 4mo | $344,015 | $230 | 71 |
| 5033 Hazelnut Ln | 0.41mi | 3/2.0 | 1,498 (+4%) | 6mo | $337,330 | $225 | 69 |
| 5008 Hazelnut Ln | 0.39mi | 3/2.0 | 1,363 (-6%) | 4mo | $309,990 | $227 | 69 |
| 13317 Alysheba Dr | 0.30mi | 3/2.5 | 1,625 (+12%) | 3mo | $265,000 | $163 | 61 |
| 14120 Gilwell Dr | 0.41mi | 3/2.0 | 1,282 (-11%) | 2mo | $295,990 | $231 | 60 |
| 5812 Swedish Farms Ter | 0.69mi | 3/2.5 | 1,572 (+9%) | 3mo | $303,750 | $193 | 48 |
Match score weights: distance 35% · size 25% · config 20% · recency 20%. Top-matched comps best support the ARV.
Projected returns pro-forma
-3.0% appreciation · 0.0% rent growth · sell at horizon
- IRR
- -7.5%
- Equity multiple
- 0.73×
- Total profit
- $-10,847
- Equity at exit
- $21,620
- IRR
- -3.2%
- Equity multiple
- 0.82×
- Total profit
- $-7,353
- Equity at exit
- $12,537
Cash invested: $40,600 (down + closing). Projections, not guarantees.
Landlord ↔ Tenant lean methodology
- Overall (STATE)
- 87 Strongly Landlord-Friendly
- State Texas
- 87 Strongly Landlord-Friendly · R+5
- County
- — inherits STATE
- City
- — inherits STATE
ZIP-level market 78617
- Home prices YoY
- -1.7%
- Rents YoY
- -0.4%
- Active inventory
- 251
- Price-to-rent
- 6.2×
Monthly cashflow live
- Estimated rent
- $1,947 high interval (Pro) →
- Mortgage (P&I)
- −$760
- Tax from tax record
- −$392 /mo · $4,706/yr
- Insurance
- −$60
- HOA
- −$40
- Vacancy / Maint / Mgmt
- −$409
- Net cashflow
- $285
Break-even live
Sensitivity live
| Price | -10% $367 | -5% $326 | +0% $285 | +5% $244 | +10% $203 |
|---|---|---|---|---|---|
| Rent | -10% $131 | -5% $208 | +0% $285 | +5% $362 | +10% $439 |
| Rate | -1.0pp $358 | -0.5pp $322 | base $285 | +0.5pp $248 | +1.0pp $210 |
UW: 25.0% down · 7.5% · 30yr · 1.5% tax · 5.0% vac · 8.0% maint · 8.0% mgmt
Financing live
Cash to close
- Down payment
- $36,250
- Closing costs
- $4,350
- Reserves months
- —
- Total cash needed
- —
Loan-product check · same deal, 3 products live
Conventional
25% down · 7.5% · 30yr
- Down + closing
- —
- Monthly P&I
- —
- Monthly cashflow
- —
- DSCR
- —
- Eligible?
- —
Personal DTI + credit; lowest rate.
DSCR
20% down · 8.5% · 30yr
- Down + closing
- —
- Monthly P&I
- —
- Monthly cashflow
- —
- DSCR
- —
- Eligible?
- —
No personal income docs; deal must DSCR.
Hard money
10% down · 12.0% · 12mo
- Down + closing
- —
- Monthly P&I
- —
- Monthly cashflow
- —
- DSCR
- —
- Eligible?
- —
Short-term bridge; refi at stabilization.
Rent comps 16 comps
| Address | Beds | Baths | Sqft | Rent | $/sqft | DOM | Units | Dist |
|---|---|---|---|---|---|---|---|---|
| 13229 Coomes Dr Del Valle, TX | 3.0 | 2.0 | 1703 | $1,995 | $1.17 | 14d | 1 | 0.32mi |
| 13400 Coomes Dr Del Valle, TX | 3.0 | 2.0 | 1625 | $1,895 | $1.17 | 6d | 1 | 0.35mi |
| 13400 Coomes Dr Del Valle, TX | 3.0 | 2.5 | 1625 | $1,895 | $1.17 | 5d | 1 | 0.35mi |
| 5521 Victory Gallop Dr Del Valle, TX | 3.0 | 2.5 | 1788 | $2,000 | $1.12 | 16d | 1 | 0.36mi |
| 5525 Victory Gallop Dr Del Valle, TX | 3.0 | 2.5 | 1788 | $1,850 | $1.03 | 45d | 1 | 0.37mi |
| 5501 Ross Rd Del Valle, TX | 1.0–3.0 | 1.0–2.0 | 950 | $1,884 | $1.98 | 0d | 18 | 0.45mi |
| 4700 Ross Rd Del Valle, TX | 1.0–3.0 | 1.0–2.0 | 932 | $1,854 | $1.99 | 16d | 11 | 0.54mi |
| 13917 Gilwell Dr Del Valle, TX | 3.0 | 2.5 | 1743 | $2,100 | $1.20 | 19d | 1 | 0.76mi |
| 12604 Paloma Blanca Way Del Valle, TX | 3.0 | 2.0 | 1423 | $1,700 | $1.19 | 18d | 1 | 0.98mi |
| 12417 Sky Harbor Dr Del Valle, TX | 3.0 | 2.0 | 1586 | $1,975 | $1.25 | 25d | 1 | 1.01mi |
| 5820 Angel Dr Del Valle, TX | 3.0 | 2.0 | 1203 | $1,850 | $1.54 | 4d | 1 | 1.04mi |
| 5820 Angel Dr Del Valle, TX | 3.0 | 2.0 | 1203 | $1,950 | $1.62 | 19d | 1 | 1.04mi |
| 12305 Paloma Blanca Way Del Valle, TX | 3.0 | 2.0 | 1208 | $1,749 | $1.45 | 45d | 1 | 1.11mi |
| 5816 Ross Rd Unit 1 Del Valle, TX | 2.0 | 2.0 | 1134 | $1,725 | $1.52 | 25d | 1 | 1.13mi |
| 6101 Ross Rd Del Valle, TX | 1.0–2.0 | 10.0 | 937 | $2,140 | $2.28 | 3d | 43 | 1.29mi |
| 6200 Albany Sleigh Dr Del Valle, TX | 3.0 | 2.0 | 1647 | $2,350 | $1.43 | 45d | 1 | 1.36mi |
HOA detail
- Monthly dues
- $40 · $480/yr
Listing history 14 events
-
2026-05-05status Pending 820-char remark
Show marketing remark (820 chars)
Unlock the potential at 13124 Dearbonne Dr—this 3-bedroom, 2-bath home offers an open floor plan filled with natural light, creating a bright and airy feel from the moment you walk in. The layout flows easily from living to dining to kitchen, giving you a solid foundation to refresh and make your own. While the home shows deferred maintenance and is ready for updates, it’s priced with that opportunity in mind—ideal for buyers looking to customize or invest. Located in Del Valle with convenient access to Tesla Gigafactory, Austin-Bergstrom International Airport, and major routes like Hwy 71, you’re also near everyday stops like H-E-B, Southpark Meadows, and McKinney Falls State Park for outdoor escapes. A smart buy with space, location, and upside—this is where vision meets value.
-
2026-04-14$145,000 Active 820-char remark
Show marketing remark (820 chars)
Unlock the potential at 13124 Dearbonne Dr—this 3-bedroom, 2-bath home offers an open floor plan filled with natural light, creating a bright and airy feel from the moment you walk in. The layout flows easily from living to dining to kitchen, giving you a solid foundation to refresh and make your own. While the home shows deferred maintenance and is ready for updates, it’s priced with that opportunity in mind—ideal for buyers looking to customize or invest. Located in Del Valle with convenient access to Tesla Gigafactory, Austin-Bergstrom International Airport, and major routes like Hwy 71, you’re also near everyday stops like H-E-B, Southpark Meadows, and McKinney Falls State Park for outdoor escapes. A smart buy with space, location, and upside—this is where vision meets value.
-
2025-10-04price
-
2025-09-11Active
-
2025-07-08Active
-
2020-05-18soldstatus Sold
-
2020-05-18soldstatus
-
2020-04-21status Pending - Taking Backups
-
2020-04-17$184,990 Active
-
2011-02-11soldstatus
-
2011-02-10soldstatus Sold
-
2011-01-13status Pending - Taking Backups
-
2010-12-30price $83,000
-
2010-12-14$86,900 Active
ⓘ Source: listings_history table (triggers on properties + properties_extension) + one-shot
backfill from property_details.listing_events for pre-trigger history.
Tax reassessment forecast TX · Resets to sale price
- Current annual tax
- $4,706 · $392/mo
- Projected year-2 tax
- $4,706 · $392/mo
- Expected delta
- $0/yr ($0/mo · 0.0%)
ⓘ Screening estimate from a state-policy table — verify with the county assessor before closing.
Climate risk First Street
- Flood 1/10 Low FEMA zone X (unshaded) · 0% chance over 30 yrs
- Wildfire 5/10 Major
- Heat 8/10 Severe 7 d/yr ≥108°F today · 23 d/yr by 30 yrs out
- Wind 8/10 Severe 80% chance of damaging wind over 30 yrs
- Air quality 1/10 Low 0 unhealthy d/yr today · 0 by 30 yrs out
Nearby sold comps map
Loading sold comps map…
Walkable amenities ~0.75 mi
Loading nearby amenities…
Taxation est. · year 1
- Rental income
- $23,366
- − Mortgage interest
- −$8,122
- − Property taxes
- −$4,706
- − Insurance
- −$725
- − Repairs & maintenance
- −$1,869
- − Management
- −$1,869
- − HOA
- −$480
- − Depreciation
- −$4,218
- Taxable income
- $1,376
- Est. tax owed @ 24.0%
- −$330
- After-tax cash flow
- $3,093/yr
For passive investors: Depreciation is non-cash, so a rental often shows a tax loss while cash-flowing — sheltering income. Rental losses are passive: they offset passive income freely, and up to $25,000/yr can offset ordinary (W-2) income if you actively participate and your MAGI is under $100k (phasing out to $0 by $150k); unused losses carry forward. On sale, claimed depreciation is recaptured at up to 25%, and gains may owe capital-gains tax (a 1031 exchange can defer both). Figures are a year-1 estimate at your 24.0% rate — not tax advice; consult a CPA.
Schools (NCES district)
- District
- Del Valle ISD
- NCES district ID
- 4816620
- Math proficiency
- 19% ▼ -13.00%
- Reading proficiency
- 26% ▼ -2.00%
- Median HH income
- $41,322
- Composite
- 19.13/100
- National rank
- #8830
- State rank
- #749 of 826 in TX
Livability — Austin
- Score
- 82/100
- State rank
- #16
- US rank
- #1208
Category grades
Schools grade is shown separately in the Schools card above.
Census & demographics
- Census place
- Austin, TX
- County
- Travis County · 1,299,254 people
- City population
- 1,066,854
- Metro
- Austin-Round Rock-Georgetown, TX
- Population (ZIP)
- 30,756
- Household income
- $71,640
- Rent vs Own
- Severe rent burden
- 681.0
Population outlook (Travis County) Hauer SSP2
- Today (2025)
- 1,545,133 people
- By 2030
- 1,729,269 · +11.9%
- By 2040
- 2,097,596 · +35.8%
- By 2050
- 2,463,890 · +59.5%
- By 2075
- 3,249,374 · +110.3%
- By 2100
- 3,801,868 · +146.1%
Race, ethnicity, and origin ACS 2023
- Neighborhood character
- Predominantly Hispanic (75%)
- Race & ethnicity
- Hispanic / Latino 75% Two or more races 33% White 16% Black 6% Asian 1%
- Hispanic origin (detail)
- Mexican 68% Puerto Rican 1%
- Common ancestry
- Romanian 1%
- Foreign-born
- 26% · Canada
- Languages at home
- 41% English-only · Spanish 57% Other Asian/Pacific 1%
Political lean MEDSL · Travis
- 2024 margin
- Solid D (+39.3) · D 68.8% · R 29.4% · Other 1.8%
- 2008→2024 swing
- +9.9pp toward D · 2008: 29.4pp · 2024: 39.3pp
- All cycles
- 2024: D+39.3 2020: D+45.0 2016: D+38.9 2012: D+23.9 2008: D+29.4
Not yet ingested
- Civics
- —
Market trends
- HPI YoY
- ▼ -3.24%
- Current HPI
- 192.3518
- Rent YoY
- ▼ -0.36%
- Metro
- Austin-Round Rock-Georgetown, TX
- State GDP YoY
- ▲ 3.95%
- F500 in state
- 110
Industry mix (Fortune 500 HQ in TX)
| Industry | F500 HQs | Revenue |
|---|---|---|
| Energy | 16 | $1,198B |
|
||
| Technology | 5 | $198B |
|
||
| Engineering / Construction | 4 | $72B |
|
||
| Energy Services | 3 | $60B |
|
||
| Utilities | 3 | $41B |
|
||
| Healthcare | 2 | $330B |
|
||
Price history
+66.9% since first listed14 events — show timeline
- 2026-05-05 Pending — HARMLS
- 2026-04-14 Listed $145,000 HARMLS
- 2025-10-04 Price Changed — Unlock MLS
- 2025-09-11 Listed — Unlock MLS
- 2025-07-08 Listed — Unlock MLS
- 2020-05-18 Sold (Public Records) — Public Records
- 2020-05-18 Sold (MLS) — Unlock MLS
- 2020-04-21 Pending — Unlock MLS
- 2020-04-17 Listed $184,990 Unlock MLS
- 2011-02-11 Sold (Public Records) — Public Records
- 2011-02-10 Sold (MLS) — Unlock MLS
- 2011-01-13 Pending — Unlock MLS
- 2010-12-30 Price Changed $83,000 Unlock MLS
- 2010-12-14 Listed $86,900 Unlock MLS
Property tax history
+3.7%/yrLatest (2026): $4,706 · -3.2% YoY. Source: county tax records.
Cash-flow waterfall
monthlySold comps — $/sqft
last 12 mo · ≤1 miLoading sold comps…