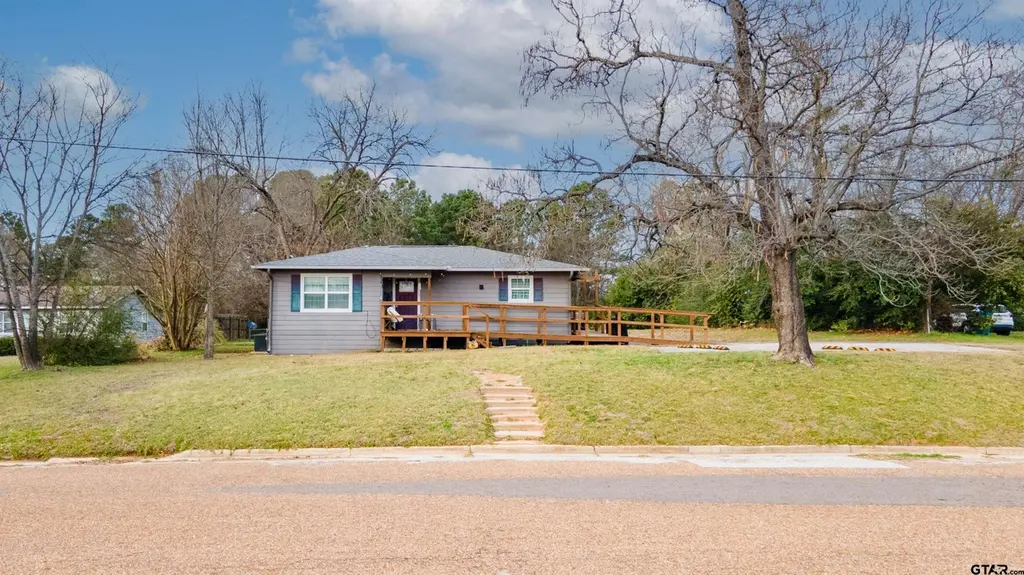
329 Lynch St · Hawkins, TX
Flood risk 1/10 · Minimal
- FEMA flood zone
- X (unshaded)
- Chance of flooding over 30 yrs
- 0.0%
- Est. flood insurance / yr
- $507 – $1,088
Fire risk 4/10 · Minor
- Est. fire insurance / yr
- $1,222 – $2,270
Heat risk 7/10 · Major
- Hot days now (above 111°F)
- 7 days/yr
- Hot days in 30 yrs
- 25 days/yr
Wind risk 6/10 · Moderate
- Chance of severe wind over 30 yrs
- 53.0%
Air-quality risk 2/10 · Minimal
- Unhealthy air days now
- 1 days/yr
- Unhealthy air days in 30 yrs
- 1 days/yr
Risk factors via First Street. Map © Google.
Why this score? — see what drove the C- grade
The composite is a weighted blend of 9 inputs, each scored 0–100. Each bar is that input's sub-score; the figure is the points it added to the 100-point composite (weight × sub-score).
- Cash flow +22.1/30.0
- DSCR +7.1/10.0
- Appreciation +6.5/10.0
- 1% rule +6.2/10.0
- Livability +3.7/5.0
- Schools +3.6/10.0
- Rent growth +2.5/5.0
- Condition / age +2.5/5.0
- ARV discount +0.0/15.0
$139,000
🖨 Deal sheet 📄 Offer letter ✓ Due diligence
Listing remarks MLS
This charming two-bedroom, one-bath home in Hawkins, Texas, offers a cozy and well-maintained living space with plenty of character. The updated kitchen features modern appliances, a stylish backsplash, and a comfortable dinette area. The spacious living room provides an open layout perfect for relaxing or entertaining. The bathroom includes a walk-in tile shower and extra storage for convenience. The home is equipped with central heat and air, along with a mini-split system in one bedroom for added comfort. Outside, a wraparound porch and side deck with a ramp create inviting spaces to enjoy the outdoors. The property also includes a backup generator, attractive siding and gutters, and a large backyard with a fire pit. A concrete pad in the backyard offers potential for a storage building or an additional patio area. This lovely East Texas home combines comfort, practicality, and charm—ready for new owners to make it their own.
Key facts
- Modern appliances
- Walk-in tile shower
- Side deck
Tags
Neighborhood map
What this means for you Summary
Snapshot
- This is a 2-bed/1.0-bath single-family listed at $139k.
Deal economics
- At list price, monthly cash flow is $224 ($3k/yr) — positive.
- The deal already cash-flows at list — no discount required.
- Meets the 1% rule at list price ($2k rent vs $139k).
- Recommended offer: $126k (9.0% below list) — sets the bar for market timing.
Location & tenants
- Location reads 73/100 on livability (#196 in TX, #4,982 nationally) — a middle-class / working-renter tenant base. Strengths: cost of living A+, health & safety A+, crime A-; Watch: schools D+, amenities F, commute F.
- Hawkins ISD (rural): math 42% / reading 43% proficiency, ranked #339 of 826 in TX (top 41%) — families likely to look elsewhere, expect single-tenant / working-renter base with shorter leases.
- Market conditions: 216 active listings in the ZIP; 72 units permitted in Wood County in 2024 (29 in 5+ unit buildings).
Forward outlook
- In year one you build about $5k of equity ($961 loan paydown + $4k appreciation (3.1% local appreciation)).
- Wood County population projected at +12% by 2050 — modest demand growth; plan on rents tracking national, not racing it.
- At projected returns (3.1% appreciation + 3.0% rent growth), your $39k cash investment doubles in ~5 years — after that, you're playing with house money.
- By year 7, paydown + projected appreciation supports a ~$33k cash-out refi (75% LTV) — recoverable capital for the next deal without selling this one.
Negotiation context
- It's been on market 108 days — a 9% lower offer ($126k) is reasonable based on typical stale-listing flexibility.
Risks & watch-outs
- Climate carrying-cost: major wind risk, 53% chance of damaging wind over 30y; extreme-heat days projected 7→25/yr by 2055 (HVAC capex compounding) — expect insurance premiums to compound above CPI over the hold.
Questions for the listing agent
- It's been on market 108 days. Have you received any prior offers? Is the seller open to a 9% concession, seller financing, or rate buy-down credit?
- Why hasn't it sold? Are there any deal-killer items the seller is aware of (foundation, flood, title, zoning, code violations)?
- Is there a deadline driving the sale (1031 exchange, divorce, estate, relocation)? That informs how much negotiation room exists.
- Schools are D-rated, which usually means shorter tenancies and higher turnover. Who's the typical renter profile here, and what's been the actual vacancy rate?
- What's the average days-on-market for RENTAL listings here right now (not sales)? A rising rental-DOM trend means longer vacancies and softer asking-rent achievability than the comps imply.
- What's the recent tenant-quality profile in this submarket — average credit score on applications, eviction rate, late-payment / NSF rate, and stable-employment percentage? A property-management company in the area should have these aggregated.
- How much new for-sale + rental construction is in the pipeline within 1–3 miles? Heavy new supply typically softens prices + rents 12–24 months out; constrained supply supports both.
Investment metrics
- 1% rule
- 1.12% ✓
- Cap rate
- 8.23%
- Cash-on-cash
- 6.92%
- DSCR
- 1.31
- GRM
- 7.4
CMA / ARV
- ARV (median comp)
- $119,056
- List price
- $139,000
- Delta
- 16.75%
- Verdict
- OVERPRICED
- Comps
- 18 within 1.0 mi
Show comp detail 6 sales within ~0.75 mi
| Address | Dist | Beds/Ba | Sqft | Sold | Price | $/sf | Match |
|---|---|---|---|---|---|---|---|
| 383 Glazner St | 0.37mi | 2/1.0 | 1,008 (+4%) | 15mo | $75,000 | $74 | 64 |
| 379 W Blackbourn St | 0.50mi | 2/1.0 | 936 (-3%) | 15mo | $60,000 | $64 | 59 |
| 209 Lone Oak Dr | 0.38mi | 2/1.0 | 896 (-7%) | 16mo | $40,000 | $45 | 56 |
| 424 W Blackbourn St | 0.52mi | 2/1.0 | 1,105 (+14%) | 1mo | $85,000 | $77 | 51 |
| 170 Wells St | 0.22mi | 2/1.0 | 857 (-12%) | 24mo | $85,000 | $99 | 51 |
| 225 Blackbourn St | 0.37mi | 3/2.0 (+1) | 1,064 (+10%) | 18mo | $169,000 | $159 | 42 |
Match score weights: distance 35% · size 25% · config 20% · recency 20%. Top-matched comps best support the ARV.
Projected returns pro-forma
3.1% appreciation · 3.0% rent growth · sell at horizon
- IRR
- 14.2%
- Equity multiple
- 1.82×
- Total profit
- $31,795
- Equity at exit
- $63,257
- IRR
- 16.0%
- Equity multiple
- 3.37×
- Total profit
- $92,385
- Equity at exit
- $98,078
Cash invested: $38,920 (down + closing). Projections, not guarantees.
Landlord ↔ Tenant lean methodology
- Overall (STATE)
- 87 Strongly Landlord-Friendly
- State Texas
- 87 Strongly Landlord-Friendly · R+5
- County
- — inherits STATE
- City
- — inherits STATE
ZIP-level market 75765
- Home prices YoY
- 1.3%
- Active inventory
- 216
- Price-to-rent
- 7.4×
Monthly cashflow live
- Estimated rent
- $1,564 medium interval (Pro) →
- Mortgage (P&I)
- −$729
- Tax from tax record
- −$224 /mo · $2,690/yr
- Insurance
- −$58
- HOA
- −$0
- Vacancy / Maint / Mgmt
- −$328
- Net cashflow
- $224
Break-even live
UW: 25.0% down · 7.5% · 30yr · 1.5% tax · 5.0% vac · 8.0% maint · 8.0% mgmt
Financing live
Cash to close
- Down payment
- $34,750
- Closing costs
- $4,170
- Reserves months
- —
- Total cash needed
- —
Loan-product check · same deal, 3 products live
Conventional
25% down · 7.5% · 30yr
- Down + closing
- —
- Monthly P&I
- —
- Monthly cashflow
- —
- DSCR
- —
- Eligible?
- —
Personal DTI + credit; lowest rate.
DSCR
20% down · 8.5% · 30yr
- Down + closing
- —
- Monthly P&I
- —
- Monthly cashflow
- —
- DSCR
- —
- Eligible?
- —
No personal income docs; deal must DSCR.
Hard money
10% down · 12.0% · 12mo
- Down + closing
- —
- Monthly P&I
- —
- Monthly cashflow
- —
- DSCR
- —
- Eligible?
- —
Short-term bridge; refi at stabilization.
Listing history 21 events
-
2026-06-19days on market $139,000 Active 108 DOM
-
2026-06-18days on market $139,000 Active 107 DOM
-
2026-06-17days on market $139,000 Active 106 DOM
-
2026-06-16days on market $139,000 Active 105 DOM
-
2026-06-15days on market $139,000 Active 104 DOM
-
2026-06-14days on market $139,000 Active 102 DOM
-
2026-06-13days on market $139,000 Active 101 DOM
-
2026-06-10days on market $139,000 Active 99 DOM
-
2026-06-09days on market $139,000 Active 98 DOM
-
2026-06-08days on market $139,000 Active 97 DOM
-
2026-06-07days on market $139,000 Active 96 DOM
-
2026-06-05days on market $139,000 Active 93 DOM
-
2026-06-03days on market $139,000 Active 92 DOM
-
2026-06-02days on market $139,000 Active 91 DOM
-
2026-06-01days on market $139,000 Active 90 DOM
-
2026-05-31days on market $139,000 Active 89 DOM
-
2026-05-30days on market $139,000 Active 88 DOM
-
2026-03-03$139,000 Active 948-char remark
Show marketing remark (948 chars)
This charming two-bedroom, one-bath home in Hawkins, Texas, offers a cozy and well-maintained living space with plenty of character. The updated kitchen features modern appliances, a stylish backsplash, and a comfortable dinette area. The spacious living room provides an open layout perfect for relaxing or entertaining. The bathroom includes a walk-in tile shower and extra storage for convenience. The home is equipped with central heat and air, along with a mini-split system in one bedroom for added comfort. Outside, a wraparound porch and side deck with a ramp create inviting spaces to enjoy the outdoors. The property also includes a backup generator, attractive siding and gutters, and a large backyard with a fire pit. A concrete pad in the backyard offers potential for a storage building or an additional patio area. This lovely East Texas home combines comfort, practicality, and charm—ready for new owners to make it their own.
-
2012-01-31soldstatus
-
2007-10-18soldstatus
-
2007-10-18soldstatus
ⓘ Source: listings_history table (triggers on properties + properties_extension) + one-shot
backfill from property_details.listing_events for pre-trigger history.
Tax reassessment forecast TX · Resets to sale price
- Current annual tax
- $2,690 · $224/mo
- Projected year-2 tax
- $2,690 · $224/mo
- Expected delta
- $0/yr ($0/mo · 0.0%)
ⓘ Screening estimate from a state-policy table — verify with the county assessor before closing.
Climate risk First Street
- Flood 1/10 Low FEMA zone X (unshaded) · 0% chance over 30 yrs
- Wildfire 4/10 Moderate
- Heat 7/10 Severe 7 d/yr ≥111°F today · 25 d/yr by 30 yrs out
- Wind 6/10 Major 53% chance of damaging wind over 30 yrs
- Air quality 2/10 Low 1 unhealthy d/yr today · 1 by 30 yrs out
Nearby sold comps map
Loading sold comps map…
Walkable amenities ~0.75 mi
Loading nearby amenities…
Taxation est. · year 1
- Rental income
- $18,764
- − Mortgage interest
- −$7,786
- − Property taxes
- −$2,690
- − Insurance
- −$695
- − Repairs & maintenance
- −$1,501
- − Management
- −$1,501
- − Depreciation
- −$4,044
- Taxable income
- $547
- Est. tax owed @ 24.0%
- −$131
- After-tax cash flow
- $2,560/yr
For passive investors: Depreciation is non-cash, so a rental often shows a tax loss while cash-flowing — sheltering income. Rental losses are passive: they offset passive income freely, and up to $25,000/yr can offset ordinary (W-2) income if you actively participate and your MAGI is under $100k (phasing out to $0 by $150k); unused losses carry forward. On sale, claimed depreciation is recaptured at up to 25%, and gains may owe capital-gains tax (a 1031 exchange can defer both). Figures are a year-1 estimate at your 24.0% rate — not tax advice; consult a CPA.
Schools (NCES district)
- District
- Hawkins ISD
- NCES district ID
- 4822770
- Math proficiency
- 42% ▼ -12.00%
- Reading proficiency
- 43% ▼ -6.00%
- Median HH income
- $43,119
- Composite
- 35.91/100
- National rank
- #4809
- State rank
- #339 of 826 in TX
Livability — Hawkins
- Score
- 73/100
- State rank
- #196
- US rank
- #4982
Category grades
Schools grade is shown separately in the Schools card above.
Census & demographics
- Census place
- Hawkins, TX
- Population (ZIP)
- 8,195
Population outlook (Wood County) Hauer SSP2
- Today (2025)
- 46,480 people
- By 2030
- 47,796 · +2.8%
- By 2040
- 50,142 · +7.9%
- By 2050
- 52,122 · +12.1%
- By 2075
- 57,033 · +22.7%
- By 2100
- 56,418 · +21.4%
Race, ethnicity, and origin ACS 2023
- Neighborhood character
- Predominantly White (79%)
- Race & ethnicity
- White 79% Black 12% Hispanic / Latino 6% Two or more races 5%
- Hispanic origin (detail)
- Mexican 5%
- Common ancestry
- Lithuanian 2% Slovak 2% Serbian 1%
- Foreign-born
- 1% · Canada
- Languages at home
- 95% English-only · Spanish 4%
Political lean MEDSL · Wood
- 2024 margin
- Solid R (+69.7) · D 14.8% · R 84.6%
- 2008→2024 swing
- -15.5pp toward R · 2008: -54.2pp · 2024: -69.7pp
- All cycles
- 2024: R+69.7 2020: R+68.2 2016: R+70.0 2012: R+64.2 2008: R+54.2
Not yet ingested
- Civics
- —
Market trends
- HPI YoY
- ▲ 3.10%
- Current HPI
- 236.7688
- Rent YoY
- —
- Metro
- —
- State GDP YoY
- ▲ 3.95%
- F500 in state
- 110
Industry mix (Fortune 500 HQ in TX)
| Industry | F500 HQs | Revenue |
|---|---|---|
| Energy | 16 | $1,198B |
|
||
| Technology | 5 | $198B |
|
||
| Engineering / Construction | 4 | $72B |
|
||
| Energy Services | 3 | $60B |
|
||
| Utilities | 3 | $41B |
|
||
| Healthcare | 2 | $330B |
|
||
Price history
4 events — show timeline
- 2026-03-03 Listed $139,000 GTAR
- 2012-01-31 Sold (Public Records) — Public Records
- 2007-10-18 Sold (Public Records) — Public Records
- 2007-10-18 Sold (Public Records) — Public Records
Property tax history
+7.0%/yrLatest (2025): $2,690 · +20.3% YoY. Source: county tax records.
Cash-flow waterfall
monthlySold comps — $/sqft
last 12 mo · ≤1 miLoading sold comps…