 Multi-family
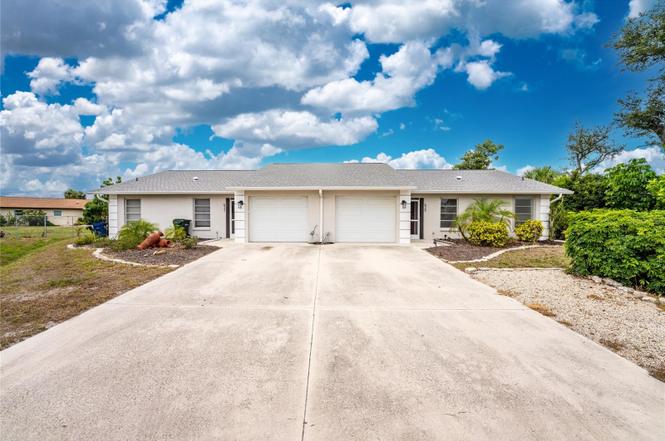
633 Harvey St · Englewood, FL
Flood risk 6/10 · Moderate
- FEMA flood zone
- X (unshaded)
- Chance of flooding over 30 yrs
- 0.52%
- Est. flood insurance / yr
- $507 – $1,088
Fire risk 1/10 · Minimal
- Est. fire insurance / yr
- $947 – $1,759
Heat risk 10/10 · Severe
- Hot days now (above 107°F)
- 7 days/yr
- Hot days in 30 yrs
- 30 days/yr
Wind risk 10/10 · Severe
- Chance of severe wind over 30 yrs
- 99.0%
Air-quality risk 2/10 · Minimal
- Unhealthy air days now
- 1 days/yr
- Unhealthy air days in 30 yrs
- 1 days/yr
Risk factors via First Street. Map © Google.
Why this score? — see what drove the B grade
The composite is a weighted blend of 9 inputs, each scored 0–100. Each bar is that input's sub-score; the figure is the points it added to the 100-point composite (weight × sub-score).
- Cash flow +30.0/30.0
- 1% rule +10.0/10.0
- DSCR +10.0/10.0
- ARV discount +7.5/15.0
- Schools +5.4/10.0
- Rent growth +4.8/5.0
- Livability +3.7/5.0
- Condition / age +2.5/5.0
- Appreciation +0.0/10.0
$359,000
🖨 Deal sheet 📄 Offer letter ✓ Due diligence
Multi-family units
County records classify this as Multi-Family (2-4 Unit). Listing-text estimate: 1 unit. estimate disagrees with records
Listing remarks MLS
The possibilities are endless with this beautiful duplex. Live in one side and rent the other for virtually payment free living. Rent both sides for a a nice monthly income. Great for a seasonal home too! Let your tenant be your caretaker! The interior is a perfect layout for entertaining your friends and family. Nice kitchen, living and dining room combination with a split bedroom floor plan. Master bedroom has a walkin closet and a nice size master bath. It also has access to the sunny Florida room. Florida room can also be walled off to be a guest room in a pinch. The guest bed and bath are tucked away on the opposite side for a perfect guest retreat. This home is located at the end of the cul-du-sac with a huge fenced backyard complete with a pond and multiple gardens. The yard is full of fruit trees and nice mature landscape. Raised beds are already in place and don't miss the hidden spot to relax in the hammock. The tenant unit has it's own private back yard! Great location approximately 2 miles from Englewood Beach.
Key facts
- Hurricane shutters
- Sunlit florida room
- Roof replaced
Tags
Property features AI
Finance
- Other: Property zoning: RMF1; Total lot approximately 0.39 acres (about 1/4 to less than 1/2 acre); Located at the end of a cul-de-sac
- Financial info: Gross lease terms for existing tenancy; Tenants pay electricity and water; Two separate water meters
- HOA & community: No association
Exterior
- Parking: Assigned parking; Driveway; Garage with door opener; Each unit includes 1 attached garage space
- Security: Smoke detectors installed
- Utilities: Public water; Public sewer; Electricity connected; Water connected; Sewer connected; Cable available
- Home design: Residential income property (duplex); Single-story (one level); Completed condition; Private rear entry porches
- Construction: Block and stucco construction; Shingle roof; Slab foundation; Built as a single building containing 2 units
- Exterior features: Covered, screened rear porch; Private mailbox; Sliding doors; Shed(s); Located on a cul-de-sac; Landscaped yard; Paved, private-maintained road
Interior
- Kitchen: Original kitchens in good condition; Range; Range hood; Microwave; Dishwasher; Disposal; Refrigerator
- Bedrooms: Total of 4 bedrooms; Each unit is a 2-bedroom unit (2 units)
- Flooring: Carpet; Ceramic tile; Hardwood; Terrazzo; Luxury vinyl plank (in one freshly painted unit)
- Bathrooms: Each unit has 2 bathrooms
- Heating & cooling: Central heating; Central air conditioning; Electric water heater
- Interior features: Ceiling fans; Split bedroom floor plan; Walk-in closets; Window treatments (blinds, aluminum frames)
- Laundry & utility: Washer hookup; Dryer hookup (electric); Laundry located in garage
Neighborhood map
What this means for you Summary
Snapshot
- This is a 4-bed/4.0-bath multifamily listed at $359k.
Deal economics
- At list price, monthly cash flow is $2k ($27k/yr) — positive.
- The deal already cash-flows at list — no discount required.
- Meets the 1% rule at list price ($6k rent vs $359k).
- Cap rate 13.9% vs local median 3.8% in Englewood — top-decile yield for the area; either an underpriced asset or a hidden risk that comps aren't pricing in. Stress-test before assuming the spread holds.
Location & tenants
- Location reads 73/100 on livability (#321 in FL) — a middle-class / working-renter tenant base. Strengths: housing A+, cost of living A, health & safety A; Watch: employment C-, amenities F, commute F.
- Sarasota (urban): math 63% / reading 63% proficiency, ranked #7 of 73 in FL (top 10%) — acceptable for families but not a draw, mixed tenant base, ~2y average lease.
- Market conditions: Rents rising fast (+9.0%/yr); 717 active listings in the ZIP; 3 comparable units currently listed for rent nearby; rentals at typical pace (median 21d on market — plan ~3-4 weeks tenant-placement turnaround); solid renter incomes; 7,466 units permitted in Sarasota County in 2024 (2,138 in 5+ unit buildings).
- At $6,024/mo this rent would consume 95% of the median local household income ($76k/yr) (locally 290% of renters already pay >50% of income on rent) — very limited rent-growth headroom before tenants either downsize or default.
Forward outlook
- Local home prices are declining (-3.0%/yr); year-one equity from $2k of loan paydown is wiped out by about $11k of value loss. Plan a longer hold.
- Sarasota County population projected at +20% by 2050 — long-run rental-demand tailwind backs the buy-and-hold thesis.
- At projected returns (-3.0% appreciation + 8.0% rent growth), your $101k cash investment doubles in ~4 years — after that, you're playing with house money.
Negotiation context
- Only 1 days on market — expect competitive offers; lowballing is unlikely to land.
- 7 sale attempts since 12y ago with the ask held roughly flat each time — persistent listings suggest the price (not the market) is what's stuck; bring a comps-based counter.
- Current owner paid $250k; 44% above their basis — modest negotiation headroom, anchor on the comps not their cost.
Risks & watch-outs
- Climate carrying-cost: major flood risk; severe wind risk, 99% chance of damaging wind over 30y; extreme-heat days projected 7→30/yr by 2055 (HVAC capex compounding) — expect insurance premiums to compound above CPI over the hold.
Questions for the listing agent
- Is there a deadline driving the sale (1031 exchange, divorce, estate, relocation)? That informs how much negotiation room exists.
- Schools are A-rated — typically a magnet for longer-tenancy family renters. What's the average tenant stay here, and is there a school-zone premium baked into asking?
- What's the average days-on-market for RENTAL listings here right now (not sales)? A rising rental-DOM trend means longer vacancies and softer asking-rent achievability than the comps imply.
- What's the recent tenant-quality profile in this submarket — average credit score on applications, eviction rate, late-payment / NSF rate, and stable-employment percentage? A property-management company in the area should have these aggregated.
- How much new apartment / multifamily construction is in the pipeline within 1–3 miles? Heavy new supply (>2% of stock underway) typically softens rents 12–24 months out; light construction supports rent growth.
Investment metrics
- 1% rule
- 1.68% ✓
- Cap rate
- 13.87%
- Cash-on-cash
- 27.05%
- DSCR
- 2.20
- GRM
- 5.0
CMA / ARV
No comps found within radius.
Projected returns pro-forma
-3.0% appreciation · 8.0% rent growth · sell at horizon
- IRR
- 26.6%
- Equity multiple
- 2.17×
- Total profit
- $118,074
- Equity at exit
- $53,528
- IRR
- 37.1%
- Equity multiple
- 5.32×
- Total profit
- $433,940
- Equity at exit
- $31,040
Cash invested: $100,520 (down + closing). Projections, not guarantees.
Landlord ↔ Tenant lean methodology
- Overall (STATE)
- 87 Strongly Landlord-Friendly
- State Florida
- 87 Strongly Landlord-Friendly · R+3
- County
- — inherits STATE
- City
- — inherits STATE
ZIP-level market 34223
- Home prices YoY
- -34.2%
- Rents YoY
- 9.0%
- Active inventory
- 717
- Price-to-rent
- 9.9×
Monthly cashflow live
- Estimated rent
- $6,024 high interval (Pro) →
- Mortgage (P&I)
- −$1,883
- Tax from tax record
- −$461 /mo · $5,531/yr
- Insurance
- −$150
- HOA
- −$0
- Vacancy / Maint / Mgmt
- −$1,265
- Net cashflow
- $2,266
Break-even live
2-unit breakdown (identical units grouped — click to expand)
| Units | Beds | Baths | Est. rent |
|---|---|---|---|
| 2× units | 2 | 1 | $6,024 |
| #1 | 2 | 1 | $3,012 |
| #2 | 2 | 1 | $3,012 |
| Total (2 units) | $6,024 | ||
UW: 25.0% down · 7.5% · 30yr · 1.5% tax · 5.0% vac · 8.0% maint · 8.0% mgmt
Financing live
Cash to close
- Down payment
- $89,750
- Closing costs
- $10,770
- Reserves months
- —
- Total cash needed
- —
Loan-product check · same deal, 3 products live
Conventional
25% down · 7.5% · 30yr
- Down + closing
- —
- Monthly P&I
- —
- Monthly cashflow
- —
- DSCR
- —
- Eligible?
- —
Personal DTI + credit; lowest rate.
DSCR
20% down · 8.5% · 30yr
- Down + closing
- —
- Monthly P&I
- —
- Monthly cashflow
- —
- DSCR
- —
- Eligible?
- —
No personal income docs; deal must DSCR.
Hard money
10% down · 12.0% · 12mo
- Down + closing
- —
- Monthly P&I
- —
- Monthly cashflow
- —
- DSCR
- —
- Eligible?
- —
Short-term bridge; refi at stabilization.
Rent comps 3 comps
| Address | Beds | Baths | Sqft | Rent | $/sqft | DOM | Units | Dist |
|---|---|---|---|---|---|---|---|---|
| 1501 Helene Ave Englewood, FL | 3.0 | 2.0 | 1608 | $3,200 | $1.99 | 13d | 1 | 0.89mi |
| 1375 Beach Rd #311 Englewood, FL | 3.0 | 2.0 | 1686 | $4,950 | $2.94 | 21d | 1 | 1.13mi |
| 5039 N Beach Rd Englewood, FL | 4.0 | 3.0 | 1650 | $4,499 | $2.73 | 21d | 1 | 1.47mi |
Listing history 2 events
-
2026-06-13remarks 695-char remark
-
2026-06-13$359,000 Pending 1 DOM
ⓘ Source: listings_history table (triggers on properties + properties_extension) + one-shot
backfill from property_details.listing_events for pre-trigger history.
Tax reassessment forecast FL · Resets to sale price
- Current annual tax
- $5,531 · $461/mo
- Projected year-2 tax
- $5,531 · $461/mo
- Expected delta
- $0/yr ($0/mo · 0.0%)
ⓘ Screening estimate from a state-policy table — verify with the county assessor before closing.
Climate risk First Street
- Flood 6/10 Major FEMA zone X (unshaded) · 52% chance over 30 yrs
- Wildfire 1/10 Low
- Heat 10/10 Extreme 7 d/yr ≥107°F today · 30 d/yr by 30 yrs out
- Wind 10/10 Extreme 99% chance of damaging wind over 30 yrs
- Air quality 2/10 Low 1 unhealthy d/yr today · 1 by 30 yrs out
Nearby sold comps map
Loading sold comps map…
Walkable amenities ~0.75 mi
Loading nearby amenities…
Taxation est. · year 1
- Rental income
- $72,288
- − Mortgage interest
- −$20,110
- − Property taxes
- −$5,531
- − Insurance
- −$1,795
- − Repairs & maintenance
- −$5,783
- − Management
- −$5,783
- − Depreciation
- −$10,444
- Taxable income
- $22,843
- Est. tax owed @ 24.0%
- −$5,482
- After-tax cash flow
- $21,708/yr
For passive investors: Depreciation is non-cash, so a rental often shows a tax loss while cash-flowing — sheltering income. Rental losses are passive: they offset passive income freely, and up to $25,000/yr can offset ordinary (W-2) income if you actively participate and your MAGI is under $100k (phasing out to $0 by $150k); unused losses carry forward. On sale, claimed depreciation is recaptured at up to 25%, and gains may owe capital-gains tax (a 1031 exchange can defer both). Figures are a year-1 estimate at your 24.0% rate — not tax advice; consult a CPA.
Schools (NCES district)
- District
- Sarasota
- NCES district ID
- 1201680
- Math proficiency
- 63% ▼ -8.00%
- Reading proficiency
- 63% ▼ -3.00%
- Median HH income
- $51,167
- Composite
- 53.68/100
- National rank
- #1428
- State rank
- #7 of 73 in FL
Livability — Englewood
- Score
- 73/100
- State rank
- #321
- US rank
- #5655
Category grades
Schools grade is shown separately in the Schools card above.
Census & demographics
- Census place
- Englewood, FL
- County
- Sarasota County · 448,376 people
- City population
- 35,420
- Metro
- North Port-Sarasota-Bradenton, FL
- Population (ZIP)
- 19,884
- Household income
- $76,016
- Rent vs Own
- Severe rent burden
- 290.0
Population outlook (Sarasota County) Hauer SSP2
- Today (2025)
- 452,380 people
- By 2030
- 474,175 · +4.8%
- By 2040
- 511,577 · +13.1%
- By 2050
- 541,467 · +19.7%
- By 2075
- 604,947 · +33.7%
- By 2100
- 621,965 · +37.5%
Race, ethnicity, and origin ACS 2023
- Neighborhood character
- Predominantly White (94%)
- Race & ethnicity
- White 94% Two or more races 3% Hispanic / Latino 3% Asian 1%
- Common ancestry
- Romanian 7% Lithuanian 4% Iranian 2%
- Foreign-born
- 9% · Canada
- Languages at home
- 94% English-only · German/W. Germanic 2% Spanish 1% Other Indo-European 1%
Political lean MEDSL · Sarasota
- 2024 margin
- R (+18.2) · D 40.5% · R 58.7%
- 2008→2024 swing
- -18.1pp toward R · 2008: -0.1pp · 2024: -18.2pp
- All cycles
- 2024: R+18.2 2020: R+10.4 2016: R+11.6 2012: R+7.4 2008: R+0.1
Not yet ingested
- Civics
- —
Market trends
- HPI YoY
- ▼ -146.26%
- Current HPI
- 281.0529
- Rent YoY
- ▲ 9.02%
- Metro
- North Port-Sarasota-Bradenton, FL
- State GDP YoY
- ▲ 3.28%
- F500 in state
- 36
Industry mix (Fortune 500 HQ in FL)
| Industry | F500 HQs | Revenue |
|---|---|---|
| Industrial Technology | 2 | $29B |
|
||
| Insurance | 2 | $17B |
|
||
| Retail | 1 | $60B |
|
||
| Technology Distribution | 1 | $58B |
|
||
| Homebuilding | 1 | $35B |
|
||
| Technology Manufacturing | 1 | $35B |
|
||
Price history
+223.4% since first listed20 events — show timeline
- 2026-06-12 Pending — Stellar MLS as Distributed by MLS Grid
- 2026-06-11 Listed $359,000 Stellar MLS as Distributed by MLS Grid
- 2018-02-28 Sold (Public Records) $249,900 Public Records
- 2018-02-28 Sold (MLS) $249,900 Stellar MLS as Distributed by MLS Grid
- 2018-02-05 Pending — Stellar MLS as Distributed by MLS Grid
- 2018-02-02 Relisted — Stellar MLS as Distributed by MLS Grid
- 2018-01-18 Pending — Stellar MLS as Distributed by MLS Grid
- 2018-01-17 Listing Removed — Stellar MLS as Distributed by MLS Grid
- 2018-01-15 Listed $249,900 Stellar MLS as Distributed by MLS Grid
- 2014-12-05 Sold (Public Records) $150,000 Public Records
- 2014-11-26 Sold (MLS) $150,000 Stellar MLS as Distributed by MLS Grid
- 2014-10-08 Pending — Stellar MLS as Distributed by MLS Grid
- 2014-09-22 Listed $149,900 Stellar MLS as Distributed by MLS Grid
- 2014-04-07 Listing Removed — Stellar MLS as Distributed by MLS Grid
- 2014-04-07 Listing Removed — Stellar MLS as Distributed by MLS Grid
- 2014-04-07 Relisted — Stellar MLS as Distributed by MLS Grid
- 2014-03-29 Listing Removed — Stellar MLS as Distributed by MLS Grid
- 2014-03-05 Listed $164,900 Stellar MLS as Distributed by MLS Grid
- 2014-03-01 Listed $164,900 Stellar MLS as Distributed by MLS Grid
- 1983-05-01 Sold (Public Records) $111,000 Public Records
Property tax history
+7.0%/yrLatest (2025): $5,531 · -1.1% YoY. Source: county tax records.
Cash-flow waterfall
monthlySold comps — $/sqft
last 12 mo · ≤1 miLoading sold comps…