97 Keystone Ct · Glenmoore, PA
Flood risk 1/10 · Minimal
- FEMA flood zone
- X (unshaded)
- Chance of flooding over 30 yrs
- 0.0%
- Est. flood insurance / yr
- $507 – $1,088
Fire risk 3/10 · Minor
- Est. fire insurance / yr
- $511 – $949
Heat risk 5/10 · Moderate
- Hot days now (above 98°F)
- 7 days/yr
- Hot days in 30 yrs
- 15 days/yr
Wind risk 4/10 · Minor
- Chance of severe wind over 30 yrs
- 23.0%
Air-quality risk 2/10 · Minimal
- Unhealthy air days now
- 1 days/yr
- Unhealthy air days in 30 yrs
- 3 days/yr
Risk factors via First Street. Map © Google.
Why this score? — see what drove the B- grade
The composite is a weighted blend of 9 inputs, each scored 0–100. Each bar is that input's sub-score; the figure is the points it added to the 100-point composite (weight × sub-score).
- Cash flow +30.0/30.0
- DSCR +10.0/10.0
- 1% rule +8.4/10.0
- ARV discount +5.9/15.0
- Schools +5.2/10.0
- Condition / age +4.0/5.0
- Rent growth +2.5/5.0
- Livability +2.5/5.0
- Appreciation +0.0/10.0
$89,500
🖨 Deal sheet (PDF) 📄 Offer letter ✓ Due diligence
Listing remarks MLS
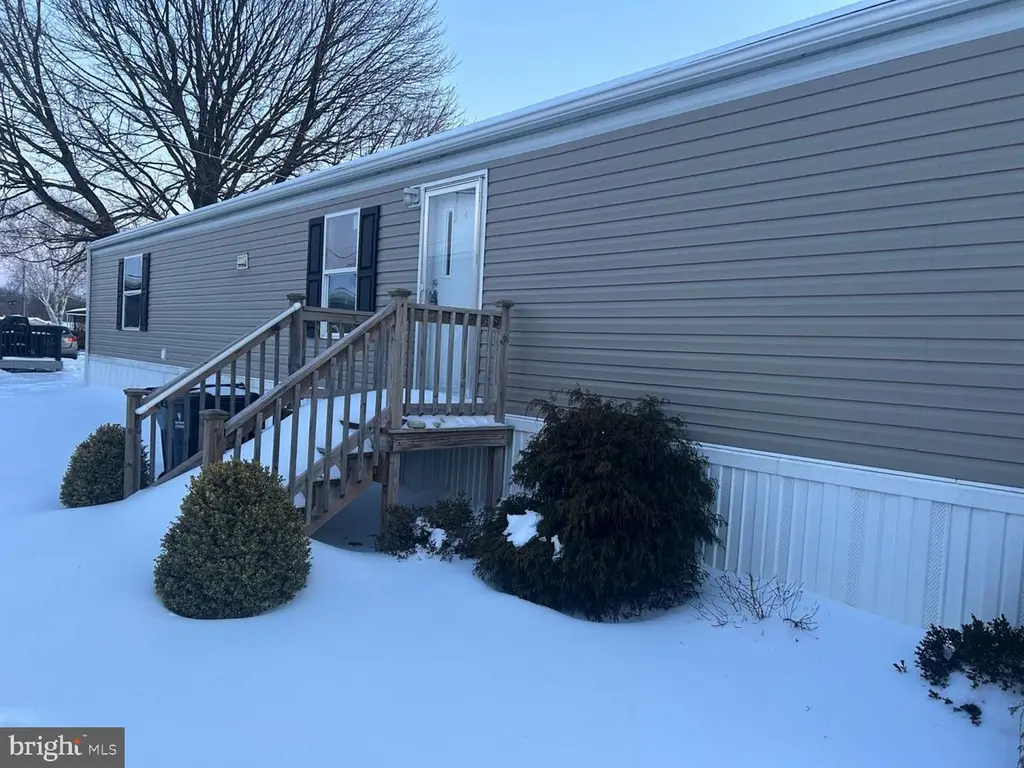
Must See!! Like-New 2021 3 bedroom, 2 bath mobile home with an open floor plan. Keystone Courts offeres community walking trails, playgrounds, and snow removal.
Key facts
- Built 2021
- Listed 128 days
Neighborhood map
What this means for you Summary
Snapshot
- This is a 3-bed/2.0-bath manufactured listed at $90k. Condition is rated good.
Deal economics
- At list price, monthly cash flow is $348 ($4k/yr) — positive.
- The deal already cash-flows at list — no discount required.
- Meets the 1% rule at list price ($1k rent vs $90k).
- Recommended offer: $79k (12.0% below list) — sets the bar for market timing.
- Cap rate 11.0% vs local median 0.1% in Glenmoore — top-decile yield for the area; either an underpriced asset or a hidden risk that comps aren't pricing in. Stress-test before assuming the spread holds.
Location & tenants
- Location reads: area grade B — affects rentability + tenant quality, not the cash-flow math above.
- Twin Valley SD (rural): math 52% / reading 65% proficiency, ranked #72 of 539 in PA (top 13%) — acceptable for families but not a draw, mixed tenant base, ~2y average lease.
- Market conditions: 46 active listings in the ZIP; 1 comparable units currently listed for rent nearby; 1,513 units permitted in Chester County in 2024 (354 in 5+ unit buildings).
Forward outlook
- Local home prices are declining (-3.0%/yr); year-one equity from $619 of loan paydown is wiped out by about $3k of value loss. Plan a longer hold.
- Chester County population projected at +6% by 2050 — modest demand growth; plan on rents tracking national, not racing it.
- At projected returns (-3.0% appreciation + 3.0% rent growth), your $25k cash investment doubles in ~8 years — after that, you're playing with house money.
Negotiation context
- It's been on market 128 days — a 12% lower offer ($79k) is reasonable based on typical stale-listing flexibility.
Risks & watch-outs
- Climate carrying-cost: extreme-heat days projected 7→15/yr by 2055 (HVAC capex compounding) — expect insurance premiums to compound above CPI over the hold.
Questions for the listing agent
- It's been on market 128 days. Have you received any prior offers? Is the seller open to a 12% concession, seller financing, or rate buy-down credit?
- Why hasn't it sold? Are there any deal-killer items the seller is aware of (foundation, flood, title, zoning, code violations)?
- Is there a deadline driving the sale (1031 exchange, divorce, estate, relocation)? That informs how much negotiation room exists.
- What's the average days-on-market for RENTAL listings here right now (not sales)? A rising rental-DOM trend means longer vacancies and softer asking-rent achievability than the comps imply.
- What's the recent tenant-quality profile in this submarket — average credit score on applications, eviction rate, late-payment / NSF rate, and stable-employment percentage? A property-management company in the area should have these aggregated.
- How much new for-sale + rental construction is in the pipeline within 1–3 miles? Heavy new supply typically softens prices + rents 12–24 months out; constrained supply supports both.
Investment metrics
- 1% rule
- 1.34% ✓
- Cap rate
- 10.96%
- Cash-on-cash
- 16.66%
- DSCR
- 1.74
- GRM
- 6.2
CMA / ARV
- ARV (median comp)
- $86,419
- List price
- $89,500
- Delta
- 3.57%
- Verdict
- FAIR
- Comps
- 11 within 1.0 mi
Projected returns pro-forma
-3.0% appreciation · 3.0% rent growth · sell at horizon
- IRR
- 7.8%
- Equity multiple
- 1.31×
- Total profit
- $7,666
- Equity at exit
- $13,345
- IRR
- 17.1%
- Equity multiple
- 2.41×
- Total profit
- $35,240
- Equity at exit
- $7,738
Cash invested: $25,060 (down + closing). Projections, not guarantees.
Landlord ↔ Tenant lean methodology
- Overall (STATE)
- 62 Landlord-Friendly
- State Pennsylvania
- 62 Landlord-Friendly · EVEN
- County
- — inherits STATE
- City
- — inherits STATE
ZIP-level market 19344
- Home prices YoY
- -7.5%
- Active inventory
- 46
- Price-to-rent
- 6.2×
Monthly cashflow live
- Estimated rent
- $1,200 medium interval (Pro) →
- Mortgage (P&I)
- −$469
- Tax from tax record
- −$93 /mo · $1,121/yr
- Insurance
- −$37
- HOA
- −$0
- Vacancy / Maint / Mgmt
- −$252
- Net cashflow
- $348
Break-even live
Sensitivity live
| Price | -10% $399 | -5% $373 | +0% $348 | +5% $323 | +10% $297 |
|---|---|---|---|---|---|
| Rent | -10% $253 | -5% $301 | +0% $348 | +5% $395 | +10% $443 |
| Rate | -1.0pp $393 | -0.5pp $371 | base $348 | +0.5pp $325 | +1.0pp $301 |
UW: 25.0% down · 7.5% · 30yr · 1.5% tax · 5.0% vac · 8.0% maint · 8.0% mgmt
Financing live
Cash to close
- Down payment
- $22,375
- Closing costs
- $2,685
- Reserves months
- —
- Total cash needed
- —
Loan-product check · same deal, 3 products live
Conventional
25% down · 7.5% · 30yr
- Down + closing
- —
- Monthly P&I
- —
- Monthly cashflow
- —
- DSCR
- —
- Eligible?
- —
Personal DTI + credit; lowest rate.
DSCR
20% down · 8.5% · 30yr
- Down + closing
- —
- Monthly P&I
- —
- Monthly cashflow
- —
- DSCR
- —
- Eligible?
- —
No personal income docs; deal must DSCR.
Hard money
10% down · 12.0% · 12mo
- Down + closing
- —
- Monthly P&I
- —
- Monthly cashflow
- —
- DSCR
- —
- Eligible?
- —
Short-term bridge; refi at stabilization.
Rent comps 1 comps
| Address | Beds | Baths | Sqft | Rent | $/sqft | DOM | Units | Dist |
|---|---|---|---|---|---|---|---|---|
| 1 Mark Rd Honey Brook, PA | 2.0 | 2.0 | 880 | $1,200 | $1.36 | 2d | 1 | 0.13mi |
Listing history 4 events
-
2026-05-20status Pending 160-char remark
Show marketing remark (160 chars)
Must See!! Like-New 2021 3 bedroom, 2 bath mobile home with an open floor plan. Keystone Courts offeres community walking trails, playgrounds, and snow removal.
-
2026-03-25price $89,500 160-char remark
Show marketing remark (160 chars)
Must See!! Like-New 2021 3 bedroom, 2 bath mobile home with an open floor plan. Keystone Courts offeres community walking trails, playgrounds, and snow removal.
-
2026-01-30price $91,500 160-char remark
Show marketing remark (160 chars)
Must See!! Like-New 2021 3 bedroom, 2 bath mobile home with an open floor plan. Keystone Courts offeres community walking trails, playgrounds, and snow removal.
-
2026-01-12$99,500 Active 160-char remark
Show marketing remark (160 chars)
Must See!! Like-New 2021 3 bedroom, 2 bath mobile home with an open floor plan. Keystone Courts offeres community walking trails, playgrounds, and snow removal.
ⓘ Source: listings_history table (triggers on properties + properties_extension) + one-shot
backfill from property_details.listing_events for pre-trigger history.
Tax reassessment forecast PA · Partial reset (capped growth)
- Current annual tax
- $1,121 · $93/mo
- Projected year-2 tax
- $1,267 · $106/mo
- Expected delta
- +$147/yr (+$12/mo · 13.1%)
ⓘ Screening estimate from a state-policy table — verify with the county assessor before closing.
Climate risk First Street
- Flood 1/10 Low FEMA zone X (unshaded) · 0% chance over 30 yrs
- Wildfire 3/10 Moderate
- Heat 5/10 Major 7 d/yr ≥98°F today · 15 d/yr by 30 yrs out
- Wind 4/10 Moderate 23% chance of damaging wind over 30 yrs
- Air quality 2/10 Low 1 unhealthy d/yr today · 3 by 30 yrs out
Nearby sold comps map
Loading sold comps map…
Walkable amenities ~0.75 mi
Loading nearby amenities…
Taxation est. · year 1
- Rental income
- $14,400
- − Mortgage interest
- −$5,013
- − Property taxes
- −$1,121
- − Insurance
- −$448
- − Repairs & maintenance
- −$1,152
- − Management
- −$1,152
- − Depreciation
- −$2,604
- Taxable income
- $2,911
- Est. tax owed @ 24.0%
- −$699
- After-tax cash flow
- $3,477/yr
For passive investors: Depreciation is non-cash, so a rental often shows a tax loss while cash-flowing — sheltering income. Rental losses are passive: they offset passive income freely, and up to $25,000/yr can offset ordinary (W-2) income if you actively participate and your MAGI is under $100k (phasing out to $0 by $150k); unused losses carry forward. On sale, claimed depreciation is recaptured at up to 25%, and gains may owe capital-gains tax (a 1031 exchange can defer both). Figures are a year-1 estimate at your 24.0% rate — not tax advice; consult a CPA.
Condition & rehab AI · 1 photo
This 2021 manufactured home is in good condition with minimal maintenance required. A fresh coat of paint and some landscaping improvements would significantly enhance its curb appeal and value.
Value-add opportunities
- Both Paint exterior — Enhances curb appeal and can increase both resale and rental value
- Both Landscaping improvements — Improves curb appeal and can increase both resale and rental value
Renovation cost estimate screening
Value-add ROI direction
- Both Paint exterior — Enhances curb appeal and can increase both resale and rental value ↑
- Both Landscaping improvements — Improves curb appeal and can increase both resale and rental value ↑
ⓘ Cost ranges are severity-bucket heuristics (US national rule-of-thumb). Get contractor quotes + a written scope before underwriting a rehab budget.
Schools (NCES district)
- District
- Twin Valley SD
- NCES district ID
- 4224000
- Math proficiency
- 52% ▼ -6.00%
- Reading proficiency
- 65% ▼ -5.00%
- Median HH income
- $71,916
- Composite
- 51.88/100
- National rank
- #1655
- State rank
- #72 of 539 in PA
Livability — Glenmoore
No livability data for this city. (Only ~50 U.S. cities are tracked.)
Census & demographics
- Population (ZIP)
- 12,910
Population outlook (Chester County) Hauer SSP2
- Today (2025)
- 546,756 people
- By 2030
- 559,441 · +2.3%
- By 2040
- 576,377 · +5.4%
- By 2050
- 580,602 · +6.2%
- By 2075
- 581,575 · +6.4%
- By 2100
- 540,922 · -1.1%
Race, ethnicity, and origin ACS 2023
- Neighborhood character
- Predominantly White (93%)
- Race & ethnicity
- White 93% Hispanic / Latino 4% Two or more races 2% Black 2%
- Common ancestry
- Romanian 2% Polish 2% Iranian 2%
- Foreign-born
- 2% · Canada, South Korea
- Languages at home
- 80% English-only · German/W. Germanic 16% Spanish 2% Other Indo-European 1%
Political lean MEDSL · Chester
- 2024 margin
- D (+14.5) · D 56.7% · R 42.2% · Other 1.0%
- 2008→2024 swing
- +5.2pp toward D · 2008: 9.2pp · 2024: 14.5pp
- All cycles
- 2024: D+14.5 2020: D+17.0 2016: D+9.2 2012: R+0.4 2008: D+9.2
Not yet ingested
- Civics
- —
Market trends
- HPI YoY
- ▼ -22.79%
- Current HPI
- 281.2501
- Rent YoY
- —
- Metro
- —
- State GDP YoY
- ▲ 1.68%
- F500 in state
- 34
Industry mix (Fortune 500 HQ in PA)
| Industry | F500 HQs | Revenue |
|---|---|---|
| Healthcare | 2 | $309B |
|
||
| Insurance | 2 | $27B |
|
||
| Telecommunications / Media | 1 | $124B |
|
||
| Industrial Distribution | 1 | $22B |
|
||
| Financial Services | 1 | $20B |
|
||
| Chemicals / Materials | 1 | $18B |
|
||
Price history
-10.1% since first listed4 events — show timeline
- 2026-05-20 Pending — BRIGHT MLS
- 2026-03-25 Price Changed $89,500 BRIGHT MLS
- 2026-01-30 Price Changed $91,500 BRIGHT MLS
- 2026-01-12 Listed $99,500 BRIGHT MLS
Property tax history
+1.3%/yrLatest (2026): $1,121 · -1.5% YoY. Source: county tax records.
Cash-flow waterfall
monthlySold comps — $/sqft
last 12 mo · ≤1 miLoading sold comps…