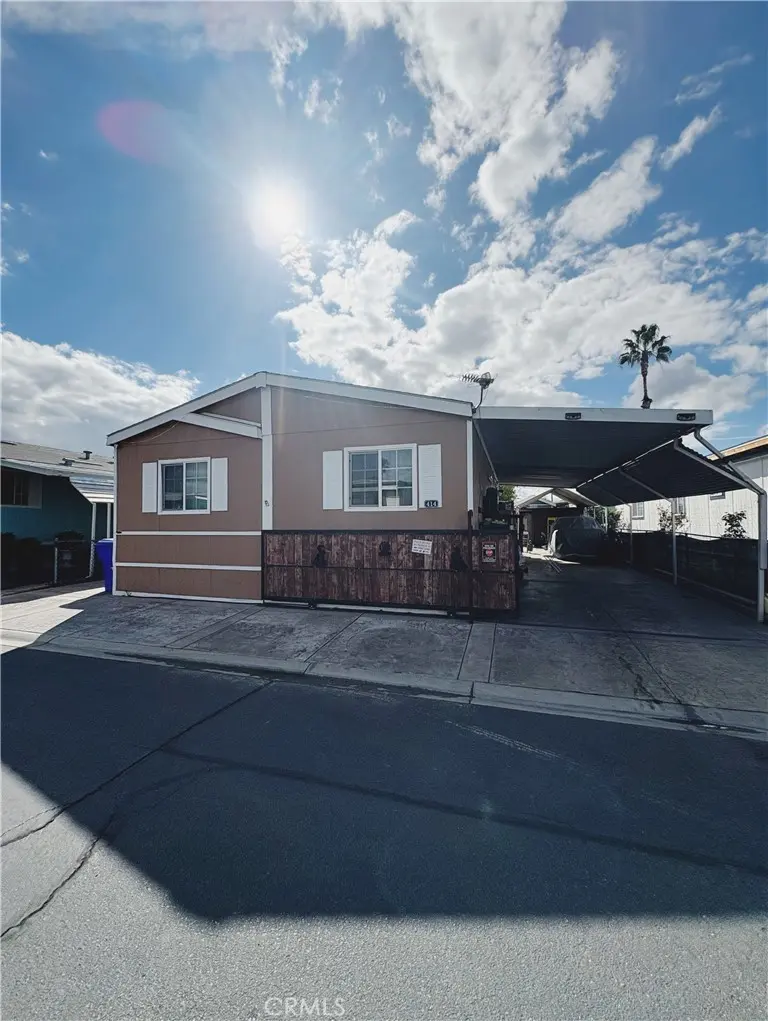
3825 Crestmore Rd #414 · Jurupa Valley, CA
Flood risk 6/10 · Moderate
- FEMA flood zone
- X
- Chance of flooding over 30 yrs
- 0.74%
- Est. flood insurance / yr
- $507 – $1,088
Fire risk 8/10 · Major
- Est. fire insurance / yr
- $659 – $1,223
Heat risk 8/10 · Major
- Hot days now (above 103°F)
- 7 days/yr
- Hot days in 30 yrs
- 20 days/yr
Wind risk 1/10 · Minimal
- Chance of severe wind over 30 yrs
- —
Air-quality risk 10/10 · Severe
- Unhealthy air days now
- 27 days/yr
- Unhealthy air days in 30 yrs
- 32 days/yr
Risk factors via First Street. Map © Google.
Why this score? — see what drove the B- grade
The composite is a weighted blend of 9 inputs, each scored 0–100. Each bar is that input's sub-score; the figure is the points it added to the 100-point composite (weight × sub-score).
- Cash flow +30.0/30.0
- 1% rule +10.0/10.0
- DSCR +10.0/10.0
- ARV discount +8.7/15.0
- Schools +3.1/10.0
- Rent growth +2.8/5.0
- Livability +2.5/5.0
- Condition / age +2.5/5.0
- Appreciation +0.0/10.0
$139,999
🖨 Deal sheet 📄 Offer letter ✓ Due diligence
Listing remarks MLS
Welcome to this charming 3-bedroom, 2-bath mobile home offering comfort, functionality, and great value. The spacious layout features an open-concept living area that flows seamlessly into the kitchen, perfect for both relaxing and entertaining. The primary bedroom includes a private bathroom for added convenience, while the additional bedrooms provide flexibility for family, guests, or a home office. Enjoy natural light throughout the home, along with ample storage and a practical floor plan designed for everyday living. Outside, you’ll find space to create your own outdoor retreat—ideal for morning coffee or evening gatherings. Whether you’re a first-time buyer, downsizing, or looking for an affordable investment, this home is a must-see!
Key facts
- Community pool
- Built 2000
- Listed 61 days
Neighborhood map
What this means for you Summary
Snapshot
- This is a 3-bed/2.0-bath manufactured listed at $140k.
Deal economics
- At list price, monthly cash flow is $1k ($13k/yr) — positive.
- The deal already cash-flows at list — no discount required.
- Meets the 1% rule at list price ($2k rent vs $140k).
- Recommended offer: $132k (6.0% below list) — sets the bar for market timing.
- Cap rate 15.7% vs local median 2.9% in Jurupa Valley — top-decile yield for the area; either an underpriced asset or a hidden risk that comps aren't pricing in. Stress-test before assuming the spread holds.
Location & tenants
- Location reads 49/100 on livability (#1,170 in CA) — a working-class tenant base; expect higher turnover. Strengths: housing A+, employment A-; Watch: schools F, amenities F, commute F.
- Jurupa Unified (suburban): math 25% / reading 38% proficiency, ranked #953 of 1,400 in CA (top 68%) — families likely to look elsewhere, expect single-tenant / working-renter base with shorter leases; 64% free/reduced lunch — lower-income household profile, screen leases tightly.
- Market conditions: Rents rising (+1.3%/yr); 202 active listings in the ZIP; 15 comparable units currently listed for rent nearby; rentals at typical pace (median 24d on market — plan ~3-4 weeks tenant-placement turnaround); 40% of comp listings sitting > 30 days — soft ceiling on asking rent; solid renter incomes; 9,195 units permitted in Riverside County in 2024 (1,512 in 5+ unit buildings).
- This rent runs 30% of the median local income ($95k/yr) — at the standard rent-burdened threshold; future hikes will face affordability resistance.
Forward outlook
- Local home prices are declining (-3.0%/yr); year-one equity from $968 of loan paydown is wiped out by about $4k of value loss. Plan a longer hold.
- Riverside County population projected at +22% by 2050 — long-run rental-demand tailwind backs the buy-and-hold thesis.
- At projected returns (-3.0% appreciation + 1.3% rent growth), your $39k cash investment doubles in ~4 years — after that, you're playing with house money.
Negotiation context
- It's been on market 61 days — a 6% lower offer ($132k) is reasonable based on typical stale-listing flexibility.
- 7 sale attempts since 19y ago; this cycle's ask has dropped $10k (7%) from the opening price — seller is motivated, your offer sets the floor, not the list.
Risks & watch-outs
- Climate carrying-cost: major flood risk; severe wildfire risk; extreme-heat days projected 7→20/yr by 2055 (HVAC capex compounding) — expect insurance premiums to compound above CPI over the hold.
Questions for the listing agent
- It's been on market 61 days. Have you received any prior offers? Is the seller open to a 6% concession, seller financing, or rate buy-down credit?
- Why hasn't it sold? Are there any deal-killer items the seller is aware of (foundation, flood, title, zoning, code violations)?
- Is there a deadline driving the sale (1031 exchange, divorce, estate, relocation)? That informs how much negotiation room exists.
- Schools are F-rated, which usually means shorter tenancies and higher turnover. Who's the typical renter profile here, and what's been the actual vacancy rate?
- What's the average days-on-market for RENTAL listings here right now (not sales)? A rising rental-DOM trend means longer vacancies and softer asking-rent achievability than the comps imply.
- What's the recent tenant-quality profile in this submarket — average credit score on applications, eviction rate, late-payment / NSF rate, and stable-employment percentage? A property-management company in the area should have these aggregated.
- How much new for-sale + rental construction is in the pipeline within 1–3 miles? Heavy new supply typically softens prices + rents 12–24 months out; constrained supply supports both.
Investment metrics
- 1% rule
- 1.73% ✓
- Cap rate
- 15.67%
- Cash-on-cash
- 33.49%
- DSCR
- 2.49
- GRM
- 4.8
CMA / ARV
- ARV (median comp)
- $143,928
- List price
- $139,999
- Delta
- -2.73%
- Verdict
- FAIR
- Comps
- 4 within 1.0 mi
Projected returns pro-forma
-3.0% appreciation · 1.31% rent growth · sell at horizon
- IRR
- 26.9%
- Equity multiple
- 2.09×
- Total profit
- $42,885
- Equity at exit
- $20,874
- IRR
- 33.5%
- Equity multiple
- 3.83×
- Total profit
- $110,774
- Equity at exit
- $12,105
Cash invested: $39,200 (down + closing). Projections, not guarantees.
Landlord ↔ Tenant lean methodology
- Overall (STATE)
- 18 Strongly Tenant-Friendly
- State California
- 18 Strongly Tenant-Friendly · D+13
- County
- — inherits STATE
- City
- — inherits STATE
ZIP-level market 92509
- Rents YoY
- 1.3%
- Active inventory
- 202
- Price-to-rent
- 4.8×
Monthly cashflow live
- Estimated rent
- $2,422 high interval (Pro) →
- Mortgage (P&I)
- −$734
- Tax from tax record
- −$27 /mo · $327/yr
- Insurance
- −$58
- HOA
- −$0
- Vacancy / Maint / Mgmt
- −$509
- Net cashflow
- $1,094
Break-even live
UW: 25.0% down · 7.5% · 30yr · 1.5% tax · 5.0% vac · 8.0% maint · 8.0% mgmt
Financing live
Cash to close
- Down payment
- $35,000
- Closing costs
- $4,200
- Reserves months
- —
- Total cash needed
- —
Loan-product check · same deal, 3 products live
Conventional
25% down · 7.5% · 30yr
- Down + closing
- —
- Monthly P&I
- —
- Monthly cashflow
- —
- DSCR
- —
- Eligible?
- —
Personal DTI + credit; lowest rate.
DSCR
20% down · 8.5% · 30yr
- Down + closing
- —
- Monthly P&I
- —
- Monthly cashflow
- —
- DSCR
- —
- Eligible?
- —
No personal income docs; deal must DSCR.
Hard money
10% down · 12.0% · 12mo
- Down + closing
- —
- Monthly P&I
- —
- Monthly cashflow
- —
- DSCR
- —
- Eligible?
- —
Short-term bridge; refi at stabilization.
Rent comps 15 comps
| Address | Beds | Baths | Sqft | Rent | $/sqft | DOM | Units | Dist |
|---|---|---|---|---|---|---|---|---|
| 5286 Odell St Unit C Riverside, CA | 2.0 | 1.0 | 1000 | $2,400 | $2.40 | 43d | 1 | 0.24mi |
| 3701 Mintern St Unit 3701 Riverside, CA | 2.0 | 1.0 | 875 | $1,995 | $2.28 | 43d | 1 | 0.50mi |
| 4581 Palm Ave Unit 4595 Riverside, CA | 2.0 | 2.0 | 950 | $2,350 | $2.47 | 16d | 1 | 1.02mi |
| 4555 Pine St Riverside, CA | 1.0–2.0 | 1.0–2.0 | 827 | $2,370 | $2.86 | 1d | 4 | 1.05mi |
| 4314 University Ave Unit 4 Riverside, CA | 2.0 | 1.0 | 800 | $1,895 | $2.37 | 43d | 1 | 1.06mi |
| 3980 Cedar St Riverside, CA | 2.0 | 1.0 | 640 | $1,895 | $2.96 | 24d | 1 | 1.08mi |
| 4192 Mission Inn Ave Apt D Riverside, CA | 2.0 | 1.0 | 1000 | $1,695 | $1.70 | 4d | 1 | 1.18mi |
| 4192 Mission Inn Ave Unit A Riverside, CA | 2.0 | 1.0 | 1000 | $1,695 | $1.70 | 10d | 1 | 1.18mi |
| 4800 Palm Ave Unit 209 Riverside, CA | 2.0 | 1.0 | 822 | $2,260 | $2.75 | 24d | 1 | 1.18mi |
| 4830 Palm Ave Riverside, CA | 1.0–3.0 | 1.0–2.0 | 985 | $2,750 | $2.79 | 14d | 1 | 1.18mi |
| 3909 5th St Riverside, CA | 2.0 | 1.0 | 950 | $1,700 | $1.79 | 43d | 1 | 1.42mi |
| 3909 5th St Unit 4 Riverside, CA | 2.0 | 1.0 | 950 | $1,700 | $1.79 | 17d | 1 | 1.42mi |
| 4330 Pacific Ave Jurupa Valley, CA | 3.0 | 2.0 | 910 | $3,300 | $3.63 | 43d | 1 | 1.42mi |
| 3448 Fairmount Blvd Riverside, CA | 2.0 | 1.5 | 584 | $2,250 | $3.85 | 43d | 1 | 1.45mi |
| 4359 Elmwood Ct Riverside, CA | 2.0 | 1.0 | 894 | $2,800 | $3.13 | 4d | 1 | 1.46mi |
Listing history 25 events
-
2026-06-18days on market $139,999 Active 61 DOM
-
2026-06-17days on market $139,999 Active 60 DOM
-
2026-06-16days on market $139,999 Active 59 DOM
-
2026-06-15days on market $139,999 Active 58 DOM
-
2026-06-13days on market $139,999 Active 56 DOM
-
2026-06-13days on market $139,999 Active 55 DOM
-
2026-06-09days on market $139,999 Active 52 DOM
-
2026-06-08days on market $139,999 Active 51 DOM
-
2026-06-07days on market $139,999 Active 50 DOM
-
2026-06-04days on market $139,999 Active 47 DOM
-
2026-06-03days on market $139,999 Active 46 DOM
-
2026-06-02pricedays on market $139,999 Active 45 DOM
-
2026-06-01days on market $149,999 Active 44 DOM
-
2026-05-31days on market $149,999 Active 43 DOM
-
2026-04-18$149,999 Active 768-char remark
Show marketing remark (768 chars)
Welcome to this charming 3-bedroom, 2-bath mobile home offering comfort, functionality, and great value. The spacious layout features an open-concept living area that flows seamlessly into the kitchen, perfect for both relaxing and entertaining. The primary bedroom includes a private bathroom for added convenience, while the additional bedrooms provide flexibility for family, guests, or a home office. Enjoy natural light throughout the home, along with ample storage and a practical floor plan designed for everyday living. Outside, you’ll find space to create your own outdoor retreat—ideal for morning coffee or evening gatherings. Whether you’re a first-time buyer, downsizing, or looking for an affordable investment, this home is a must-see!
-
2026-03-23status Active
-
2026-03-16status Active
-
2026-01-15status Active
-
2025-12-29status Pending Sale
-
2025-11-26$149,999 Active
-
2025-11-25historical
-
2007-10-18historical
-
2007-07-19$61,000
-
2007-03-31historical
-
2007-03-30$75,000
ⓘ Source: listings_history table (triggers on properties + properties_extension) + one-shot
backfill from property_details.listing_events for pre-trigger history.
Tax reassessment forecast CA · Resets to sale price
- Current annual tax
- $327 · $27/mo
- Projected year-2 tax
- $1,064 · $89/mo
- Expected delta
- +$737/yr (+$61/mo · 225.1%)
ⓘ Screening estimate from a state-policy table — verify with the county assessor before closing.
Climate risk First Street
- Flood 6/10 Major FEMA zone X · 74% chance over 30 yrs
- Wildfire 8/10 Severe
- Heat 8/10 Severe 7 d/yr ≥103°F today · 20 d/yr by 30 yrs out
- Wind 1/10 Low
- Air quality 10/10 Extreme 27 unhealthy d/yr today · 32 by 30 yrs out
Nearby sold comps map
Loading sold comps map…
Walkable amenities ~0.75 mi
Loading nearby amenities…
Taxation est. · year 1
- Rental income
- $29,070
- − Mortgage interest
- −$7,842
- − Property taxes
- −$327
- − Insurance
- −$700
- − Repairs & maintenance
- −$2,326
- − Management
- −$2,326
- − Depreciation
- −$4,073
- Taxable income
- $11,477
- Est. tax owed @ 24.0%
- −$2,754
- After-tax cash flow
- $10,373/yr
For passive investors: Depreciation is non-cash, so a rental often shows a tax loss while cash-flowing — sheltering income. Rental losses are passive: they offset passive income freely, and up to $25,000/yr can offset ordinary (W-2) income if you actively participate and your MAGI is under $100k (phasing out to $0 by $150k); unused losses carry forward. On sale, claimed depreciation is recaptured at up to 25%, and gains may owe capital-gains tax (a 1031 exchange can defer both). Figures are a year-1 estimate at your 24.0% rate — not tax advice; consult a CPA.
Schools (NCES district)
- District
- Jurupa Unified
- NCES district ID
- 0619260
- Math proficiency
- 25% ▲ 2.00%
- Reading proficiency
- 38% ▲ 2.00%
- Median HH income
- $58,100
- Composite
- 30.97/100
- National rank
- #11327
- State rank
- #953 of 1400 in CA
Livability — Jurupa Valley
- Score
- 49/100
- State rank
- #1170
- US rank
- #25915
Category grades
Schools grade is shown separately in the Schools card above.
Census & demographics
- Census place
- Jurupa Valley, CA
- County
- Riverside County · 2,287,001 people
- City population
- 119,165
- Metro
- Riverside-San Bernardino-Ontario, CA
- Population (ZIP)
- 81,182
- Household income
- $95,355
- Rent vs Own
- Severe rent burden
- 1694.0
Population outlook (Riverside County) Hauer SSP2
- Today (2025)
- 2,664,475 people
- By 2030
- 2,802,692 · +5.2%
- By 2040
- 3,050,904 · +14.5%
- By 2050
- 3,256,783 · +22.2%
- By 2075
- 3,655,058 · +37.2%
- By 2100
- 3,766,594 · +41.4%
Race, ethnicity, and origin ACS 2023
- Neighborhood character
- Predominantly Hispanic (74%)
- Race & ethnicity
- Hispanic / Latino 74% White 17% Two or more races 16% Black 4% Asian 4% Native American 1%
- Hispanic origin (detail)
- Mexican 67%
- Common ancestry
- Lithuanian 1%
- Foreign-born
- 28% · Canada, China, Vietnam
- Languages at home
- 42% English-only · Spanish 54% Other Indo-European 1% Tagalog/Filipino 1%
Political lean MEDSL · Riverside
- 2024 margin
- Toss-up / Even · D 48.0% · R 49.3% · Other 2.6%
- 2008→2024 swing
- -3.6pp toward R · 2008: 2.3pp · 2024: -1.3pp
- All cycles
- 2024: R+1.3 2020: D+8.0 2016: D+4.3 2012: R+0.4 2008: D+2.3
Not yet ingested
- Civics
- —
Market trends
- HPI YoY
- ▼ -374.91%
- Current HPI
- 464.8939
- Rent YoY
- ▲ 1.31%
- Metro
- Riverside-San Bernardino-Ontario, CA
- State GDP YoY
- ▲ 3.21%
- F500 in state
- 116
Industry mix (Fortune 500 HQ in CA)
| Industry | F500 HQs | Revenue |
|---|---|---|
| Technology | 27 | $1,492B |
|
||
| Financial Services | 3 | $174B |
|
||
| Retail | 3 | $44B |
|
||
| Insurance | 3 | $26B |
|
||
| Media / Entertainment | 2 | $115B |
|
||
| Pharmaceuticals / Biotech | 2 | $62B |
|
||
Price history
+100.0% since first listed11 events — show timeline
- 2026-04-18 Listed $149,999 CRMLS
- 2026-03-23 Relisted — CRMLS
- 2026-03-16 Relisted — CRMLS
- 2026-01-15 Relisted — CRMLS
- 2025-12-29 Pending — CRMLS
- 2025-11-26 Listed $149,999 CRMLS
- 2025-11-25 Coming Soon — CRMLS
- 2007-10-18 Listing Removed — CRMLS
- 2007-07-19 Listed $61,000 CRMLS
- 2007-03-31 Listing Removed — CRMLS
- 2007-03-30 Listed $75,000 CRMLS
Property tax history
-2.6%/yrLatest (2025): $327 · +5.4% YoY. Source: county tax records.
Cash-flow waterfall
monthlySold comps — $/sqft
last 12 mo · ≤1 miLoading sold comps…