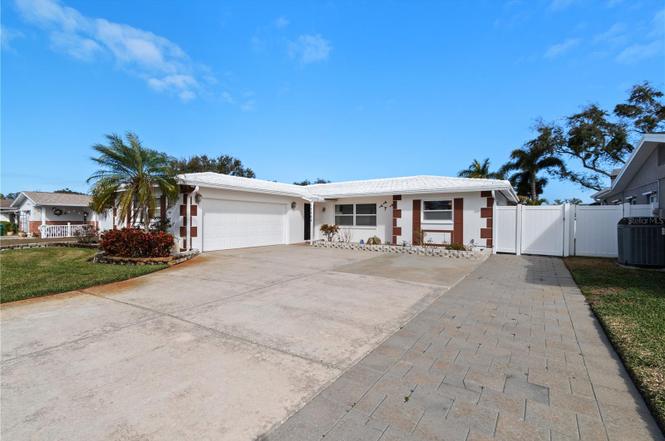
13565 86th Ave · Seminole, FL
Flood risk 1/10 · Minimal
- FEMA flood zone
- X (unshaded)
- Chance of flooding over 30 yrs
- 0.0%
- Est. flood insurance / yr
- $507 – $1,088
Fire risk 1/10 · Minimal
- Est. fire insurance / yr
- $947 – $1,759
Heat risk 10/10 · Severe
- Hot days now (above 107°F)
- 8 days/yr
- Hot days in 30 yrs
- 28 days/yr
Wind risk 10/10 · Severe
- Chance of severe wind over 30 yrs
- 99.0%
Air-quality risk 3/10 · Minor
- Unhealthy air days now
- 2 days/yr
- Unhealthy air days in 30 yrs
- 3 days/yr
Risk factors via First Street. Map © Google.
Why this score? — see what drove the D+ grade
The composite is a weighted blend of 9 inputs, each scored 0–100. Each bar is that input's sub-score; the figure is the points it added to the 100-point composite (weight × sub-score).
- ARV discount +15.0/15.0
- Cash flow +12.8/30.0
- Livability +4.4/5.0
- Schools +4.3/10.0
- DSCR +3.8/10.0
- 1% rule +2.8/10.0
- Rent growth +2.5/5.0
- Condition / age +2.5/5.0
- Appreciation +0.0/10.0
$485,000
🖨 Deal sheet 📄 Offer letter ✓ Due diligence
Listing remarks
Short Sale. This beautifully designed 3-bedroom, 2-bath residence offers a thoughtful layout that seamlessly blends functionality with character. Featuring separate living, family, and dining rooms, the home provides distinct yet connected spaces ideal for both everyday living and entertaining. Upon entry, you’re welcomed by an open-concept flow enhanced by sleek flooring throughout and abundant natural light, creating a warm and inviting ambiance. The family room is centered around a striking fireplace that can be enjoyed as either wood-burning or electric—serving as a stylish focal point that adds both warmth and visual appeal to the main living area. Both bathrooms are genero
Key facts
- Extra-long driveway
- Retractable awning
- Striking fireplace
Tags
Property features AI
Finance
- Other: Located on the right of 86th Ave N (directions provided)
- Financial info: No lease restrictions; Property is homestead exempt
- HOA & community: No association indicated
Exterior
- Parking: Attached garage with 2 garage spaces
- Utilities: Public water; Public sewer; Public utilities
- Home design: Single-family residence; One story; Faces northwest
- Construction: Block construction; Shingle roof; Block foundation; Built on a 0.16-acre lot (approx. 65 x 108)
- Exterior features: Storage
Interior
- Kitchen: Dishwasher; Range; Refrigerator
- Bedrooms: 3 bedrooms
- Flooring: Tile flooring
- Bathrooms: 2 full bathrooms
- Heating & cooling: Central heating; Central air conditioning
- Interior features: Ceiling fans; Split bedroom layout; Window treatments; Decorative electric and wood-burning free-standing fireplace in the living room
- Laundry & utility: Laundry area located in the garage
Neighborhood map
What this means for you Summary
Snapshot
- This is a 3-bed/2.0-bath single-family listed at $485k.
Deal economics
- At list price, monthly cash flow is $-49 ($-582/yr) — negative.
- To cash-flow at today's rent, offer at most $476k (1.8% below list).
- To meet the 1% rule (rent ≥ 1% of price), the offer needs to be $378k (22.0% below list).
- Recommended offer: $378k (22.0% below list) — sets the bar for 1% rule.
- Cap rate 6.2% vs local median 3.8% in Seminole — top-decile yield for the area; either an underpriced asset or a hidden risk that comps aren't pricing in. Stress-test before assuming the spread holds.
Location & tenants
- Location reads 88/100 on livability (#5 in FL, #174 nationally) — a professional / high-income tenant draw. Strengths: commute A+, housing A+, health & safety A+.
- Pinellas (suburban): math 51% / reading 51% proficiency, ranked #31 of 73 in FL (top 42%) — acceptable for families but not a draw, mixed tenant base, ~2y average lease.
- Market conditions: 146 active listings in the ZIP; 27 comparable units currently listed for rent nearby; rentals at typical pace (median 22d on market — plan ~3-4 weeks tenant-placement turnaround); 2,676 units permitted in Pinellas County in 2024 (1,422 in 5+ unit buildings).
Forward outlook
- Local home prices are declining (-3.0%/yr); year-one equity from $3k of loan paydown is wiped out by about $15k of value loss. Plan a longer hold.
- Pinellas County population projected at +14% by 2050 — modest demand growth; plan on rents tracking national, not racing it.
Negotiation context
- It's been on market 115 days — a 9% lower offer ($441k) is reasonable based on typical stale-listing flexibility.
- 3 sale attempts; this cycle's ask is 13757% above the opening price — seller raised mid-cycle; expect resistance to lowballs.
- Current owner paid $175k; list at $485k implies a 177% gain — meaningful room to come down on a strong offer.
Risks & watch-outs
- Climate carrying-cost: severe wind risk, 99% chance of damaging wind over 30y; extreme-heat days projected 8→28/yr by 2055 (HVAC capex compounding) — expect insurance premiums to compound above CPI over the hold.
Questions for the listing agent
- What do current leases actually rent for vs. the listed asking? Can we see a recent rent roll and the last 12 months of T-12 income?
- It's been on market 115 days. Have you received any prior offers? Is the seller open to a 22% concession, seller financing, or rate buy-down credit?
- Built in 1972 — when were the roof, HVAC, electrical panel, plumbing, and water heater last replaced?
- Why hasn't it sold? Are there any deal-killer items the seller is aware of (foundation, flood, title, zoning, code violations)?
- Is there a deadline driving the sale (1031 exchange, divorce, estate, relocation)? That informs how much negotiation room exists.
- Schools are B-rated — typically a magnet for longer-tenancy family renters. What's the average tenant stay here, and is there a school-zone premium baked into asking?
- The area grade is low — what's the realistic commute time and amenity access for the typical tenant pool here? Any planned neighborhood developments (good or bad) we should know about?
- What's the average days-on-market for RENTAL listings here right now (not sales)? A rising rental-DOM trend means longer vacancies and softer asking-rent achievability than the comps imply.
- What's the recent tenant-quality profile in this submarket — average credit score on applications, eviction rate, late-payment / NSF rate, and stable-employment percentage? A property-management company in the area should have these aggregated.
- How much new for-sale + rental construction is in the pipeline within 1–3 miles? Heavy new supply typically softens prices + rents 12–24 months out; constrained supply supports both.
Investment metrics
- 1% rule
- 0.78% ✗
- Cap rate
- 6.17%
- Cash-on-cash
- -0.43%
- DSCR
- 0.98
- GRM
- 10.7
CMA / ARV
- ARV (on-the-fly)
- $588,104
- Comps found
- 12
Show comp detail 12 sales within ~0.75 mi
| Address | Dist | Beds/Ba | Sqft | Sold | Price | $/sf | Match |
|---|---|---|---|---|---|---|---|
| 13625 86th Ave | 0.05mi | 3/2.0 | 1,789 (-1%) | 1mo | $600,000 | $335 | 96 |
| 13891 88th Ter | 0.32mi | 3/2.0 | 1,792 (-1%) | 0mo | $575,000 | $321 | 83 |
| 9078 134th Way | 0.31mi | 3/2.0 | 1,800 (-0%) | 3mo | $587,500 | $326 | 82 |
| 13397 86th Ave | 0.15mi | 4/2.0 (+1) | 1,916 (+6%) | 1mo | $725,000 | $378 | 77 |
| 13233 88th Ave | 0.32mi | 3/2.0 | 1,591 (-12%) | 3mo | $612,500 | $385 | 63 |
| 12947 88th Ave | 0.54mi | 3/2.0 | 1,985 (+10%) | 2mo | $600,000 | $302 | 56 |
| 13845 94th Ave | 0.56mi | 3/2.5 | 1,656 (-8%) | 2mo | $499,000 | $301 | 56 |
| 13826 Antigua Dr | 0.70mi | 3/3.0 | 1,867 (+4%) | 3mo | $515,000 | $276 | 55 |
| 13956 80th Ave | 0.55mi | 4/3.0 (+1) | 1,969 (+9%) | 2mo | $829,000 | $421 | 48 |
| 14128 87th Ave | 0.51mi | 2/2.0 (-1) | 1,576 (-13%) | 3mo | $424,000 | $269 | 48 |
| 7587 132nd Way | 0.70mi | 3/2.0 | 1,584 (-12%) | 0mo | $727,000 | $459 | 47 |
| 9760 136th St | 0.72mi | 3/2.0 | 2,055 (+14%) | 0mo | $600,000 | $292 | 43 |
Match score weights: distance 35% · size 25% · config 20% · recency 20%. Top-matched comps best support the ARV.
Projected returns pro-forma
-3.0% appreciation · 3.0% rent growth · sell at horizon
- IRR
- -17.0%
- Equity multiple
- 0.40×
- Total profit
- $-81,819
- Equity at exit
- $72,315
- IRR
- -9.0%
- Equity multiple
- 0.44×
- Total profit
- $-75,782
- Equity at exit
- $41,934
Cash invested: $135,800 (down + closing). Projections, not guarantees.
Landlord ↔ Tenant lean methodology
- Overall (STATE)
- 87 Strongly Landlord-Friendly
- State Florida
- 87 Strongly Landlord-Friendly · R+3
- County
- — inherits STATE
- City
- — inherits STATE
ZIP-level market 33776
- Active inventory
- 146
- Price-to-rent
- 10.7×
Monthly cashflow live
- Estimated rent
- $3,782 high interval (Pro) →
- Mortgage (P&I)
- −$2,543
- Tax from tax record
- −$291 /mo · $3,486/yr
- Insurance
- −$202
- HOA
- −$0
- Vacancy / Maint / Mgmt
- −$794
- Net cashflow
- $-49
Break-even live
UW: 25.0% down · 7.5% · 30yr · 1.5% tax · 5.0% vac · 8.0% maint · 8.0% mgmt
Financing live
Cash to close
- Down payment
- $121,250
- Closing costs
- $14,550
- Reserves months
- —
- Total cash needed
- —
Loan-product check · same deal, 3 products live
Conventional
25% down · 7.5% · 30yr
- Down + closing
- —
- Monthly P&I
- —
- Monthly cashflow
- —
- DSCR
- —
- Eligible?
- —
Personal DTI + credit; lowest rate.
DSCR
20% down · 8.5% · 30yr
- Down + closing
- —
- Monthly P&I
- —
- Monthly cashflow
- —
- DSCR
- —
- Eligible?
- —
No personal income docs; deal must DSCR.
Hard money
10% down · 12.0% · 12mo
- Down + closing
- —
- Monthly P&I
- —
- Monthly cashflow
- —
- DSCR
- —
- Eligible?
- —
Short-term bridge; refi at stabilization.
Rent comps 27 comps
| Address | Beds | Baths | Sqft | Rent | $/sqft | DOM | Units | Dist |
|---|---|---|---|---|---|---|---|---|
| 13788 84th Ter Seminole, FL | 3.0 | 2.0 | 1330 | $2,850 | $2.14 | 24d | 1 | 0.24mi |
| 12909 83rd Ave Seminole, FL | 4.0 | 2.0 | 1478 | $2,700 | $1.83 | 21d | 1 | 0.57mi |
| 9262 140th Ln Seminole, FL | 2.0 | 2.0 | 1402 | $4,500 | $3.21 | 4d | 1 | 0.64mi |
| 12731 82nd Ave Seminole, FL | 4.0 | 2.0 | 1594 | $3,395 | $2.13 | 24d | 1 | 0.70mi |
| 14414 91st Ave Seminole, FL | 3.0 | 2.5 | 2083 | $8,000 | $3.84 | 24d | 1 | 0.77mi |
| 12644 81st Ter Seminole, FL | 3.0 | 2.0 | 1426 | $2,590 | $1.82 | 24d | 1 | 0.82mi |
| 19111 Vista Bay Dr Indian Shores, FL | 2.0 | 2.0 | 1265 | $4,550 | $3.60 | 3d | 2 | 0.95mi |
| 19111 Vista Bay Dr Indian Shores, FL | 2.0 | 2.0 | 1310 | $4,200 | $3.21 | 24d | 3 | 0.95mi |
| 19111 Vista Bay Dr #612 Indian Shores, FL | 2.0 | 2.0 | 1265 | $6,000 | $4.74 | 2d | 1 | 0.95mi |
| 9652 Commodore Dr Seminole, FL | 3.0 | 2.0 | 1680 | $2,800 | $1.67 | 11d | 1 | 0.96mi |
| 13607 101st Ter Seminole, FL | 2.0 | 2.0 | 1503 | $3,850 | $2.56 | 4d | 1 | 0.99mi |
| 19138 Whispering Pines Dr Indian Shores, FL | 4.0 | 3.0 | 2424 | $8,000 | $3.30 | 24d | 1 | 1.04mi |
| 19505 Gulf Blvd #304 Indian Shores, FL | 4.0 | 2.5 | 2388 | $15,000 | $6.28 | 4d | 1 | 1.14mi |
| 9614 Tara Cay Ct Seminole, FL | 4.0 | 4.0 | 2100 | $2,850 | $1.36 | 20d | 1 | 1.16mi |
| 8873 Tami St Seminole, FL | 3.0 | 2.0 | 1898 | $2,595 | $1.37 | 7d | 1 | 1.18mi |
| 9794 Indian Key Trl Unit 90 Seminole, FL | 4.0 | 4.0 | 2174 | $3,650 | $1.68 | 24d | 1 | 1.19mi |
| 18111 1st St E Redington Shores, FL | 3.0 | 3.0 | 1556 | $2,800 | $1.80 | 4d | 1 | 1.29mi |
| 13964 106th Ave Largo, FL | 3.0 | 2.0 | 2281 | $3,500 | $1.53 | 24d | 1 | 1.33mi |
| 19646 Gulf Blvd #3 Indian Shores, FL | 4.0 | 2.0 | 1600 | $2,975 | $1.86 | 24d | 1 | 1.34mi |
| 12100 Park Blvd Seminole, FL | 1.0–3.0 | 1.0–2.5 | 921 | $2,192 | $2.38 | 2d | 40 | 1.38mi |
| 17980 Gulf Blvd Unit 1546267P Redington Shores, FL | 2.0 | 2.0 | 1399 | $7,517 | $5.37 | 20d | 1 | 1.40mi |
| 17920 Gulf Blvd #205 Redington Shores, FL | 2.0 | 2.0 | 1330 | $3,300 | $2.48 | 20d | 1 | 1.47mi |
| 17920 Gulf Blvd #1203 Redington Shores, FL | 2.0 | 2.0 | 1330 | $4,000 | $3.01 | 24d | 1 | 1.47mi |
| 17920 Gulf Blvd #1205 Redington Shores, FL | 2.0 | 2.0 | 1330 | $6,000 | $4.51 | 14d | 1 | 1.47mi |
| 17920 Gulf Blvd #1401 Redington Shores, FL | 2.0 | 2.0 | 1345 | $3,495 | $2.60 | 24d | 1 | 1.47mi |
| 11997 97th Ave Seminole, FL | 3.0 | 2.0 | 1635 | $2,700 | $1.65 | 24d | 1 | 1.49mi |
| 11997 97th Ave Seminole, FL | 3.0 | 2.0 | 1635 | $2,700 | $1.65 | 21d | 1 | 1.49mi |
Listing history 26 events
-
2026-06-18days on market $485,000 Active 115 DOM
-
2026-06-17days on market $485,000 Active 114 DOM
-
2026-06-16days on market $485,000 Active 113 DOM
-
2026-06-15days on market $485,000 Active 112 DOM
-
2026-06-13days on market $485,000 Active 110 DOM
-
2026-06-09days on market $485,000 Active 106 DOM
-
2026-06-08days on market $485,000 Active 105 DOM
-
2026-06-07days on market $485,000 Active 104 DOM
-
2026-06-04days on market $485,000 Active 101 DOM
-
2026-06-03days on market $485,000 Active 100 DOM
-
2026-06-01days on market $485,000 Active 98 DOM
-
2026-05-31days on market $485,000 Active 97 DOM
-
2026-05-11price $485,000
-
2026-05-07historical $3,500
-
2026-04-26price $510,000
-
2026-04-09price $530,000
-
2026-03-21price $575,000
-
2026-03-06$3,500
-
2026-02-23$580,000 Active
-
2026-01-14historical
-
2025-10-27price $595,000
-
2025-09-25price $599,990
-
2025-08-20price $614,990
-
2025-07-13$625,000 Active
-
2015-09-02soldstatus $175,000
-
1999-08-02soldstatus $115,000
ⓘ Source: listings_history table (triggers on properties + properties_extension) + one-shot
backfill from property_details.listing_events for pre-trigger history.
Tax reassessment forecast FL · Resets to sale price
- Current annual tax
- $3,486 · $291/mo
- Projected year-2 tax
- $4,026 · $335/mo
- Expected delta
- +$539/yr (+$45/mo · 15.5%)
ⓘ Screening estimate from a state-policy table — verify with the county assessor before closing.
Climate risk First Street
- Flood 1/10 Low FEMA zone X (unshaded) · 0% chance over 30 yrs
- Wildfire 1/10 Low
- Heat 10/10 Extreme 8 d/yr ≥107°F today · 28 d/yr by 30 yrs out
- Wind 10/10 Extreme 99% chance of damaging wind over 30 yrs
- Air quality 3/10 Moderate 2 unhealthy d/yr today · 3 by 30 yrs out
Nearby sold comps map
Loading sold comps map…
Walkable amenities ~0.75 mi
Loading nearby amenities…
Taxation est. · year 1
- Rental income
- $45,379
- − Mortgage interest
- −$27,168
- − Property taxes
- −$3,486
- − Insurance
- −$2,425
- − Repairs & maintenance
- −$3,630
- − Management
- −$3,630
- − Depreciation
- −$14,109
- Taxable loss
- −$9,069
- Est. tax savings @ 24.0%
- +$2,177
- After-tax cash flow
- $1,594/yr
For passive investors: Depreciation is non-cash, so a rental often shows a tax loss while cash-flowing — sheltering income. Rental losses are passive: they offset passive income freely, and up to $25,000/yr can offset ordinary (W-2) income if you actively participate and your MAGI is under $100k (phasing out to $0 by $150k); unused losses carry forward. On sale, claimed depreciation is recaptured at up to 25%, and gains may owe capital-gains tax (a 1031 exchange can defer both). Figures are a year-1 estimate at your 24.0% rate — not tax advice; consult a CPA.
Schools (NCES district)
- District
- Pinellas
- NCES district ID
- 1201560
- Math proficiency
- 51% ▼ -5.00%
- Reading proficiency
- 51% ▼ -3.00%
- Median HH income
- $46,270
- Composite
- 43.27/100
- National rank
- #3046
- State rank
- #31 of 73 in FL
Livability — Seminole
- Score
- 88/100
- State rank
- #5
- US rank
- #174
Category grades
Schools grade is shown separately in the Schools card above.
Census & demographics
- City population
- 42,315
- Population (ZIP)
- 12,711
Population outlook (Pinellas County) Hauer SSP2
- Today (2025)
- 1,027,532 people
- By 2030
- 1,063,586 · +3.5%
- By 2040
- 1,125,020 · +9.5%
- By 2050
- 1,168,637 · +13.7%
- By 2075
- 1,265,188 · +23.1%
- By 2100
- 1,260,357 · +22.7%
Race, ethnicity, and origin ACS 2023
- Neighborhood character
- Predominantly White (84%)
- Race & ethnicity
- White 84% Hispanic / Latino 7% Two or more races 7% Asian 2% Black 2%
- Hispanic origin (detail)
- Mexican 3%
- Common ancestry
- Romanian 7% Lithuanian 3% Slovak 1%
- Foreign-born
- 9% · Canada, Jamaica
- Languages at home
- 89% English-only · Other Indo-European 4% Russian/Polish/Slavic 3% Spanish 2%
Political lean MEDSL · Pinellas
- 2024 margin
- Lean R (+5.2) · D 46.9% · R 52.1%
- 2008→2024 swing
- -13.5pp toward R · 2008: 8.3pp · 2024: -5.2pp
- All cycles
- 2024: R+5.2 2020: D+0.2 2016: R+1.1 2012: D+5.6 2008: D+8.3
Not yet ingested
- Civics
- —
Market trends
- HPI YoY
- ▼ -455.42%
- Current HPI
- 337.3149
- Rent YoY
- —
- Metro
- —
- State GDP YoY
- ▲ 3.28%
- F500 in state
- 36
Industry mix (Fortune 500 HQ in FL)
| Industry | F500 HQs | Revenue |
|---|---|---|
| Industrial Technology | 2 | $29B |
|
||
| Insurance | 2 | $17B |
|
||
| Retail | 1 | $60B |
|
||
| Technology Distribution | 1 | $58B |
|
||
| Homebuilding | 1 | $35B |
|
||
| Technology Manufacturing | 1 | $35B |
|
||
Price history
+321.7% since first listed14 events — show timeline
- 2026-05-11 Price Changed $485,000 Stellar MLS as Distributed by MLS Grid
- 2026-05-07 Rental Removed $3,500 STELLARMLS
- 2026-04-26 Price Changed $510,000 Stellar MLS as Distributed by MLS Grid
- 2026-04-09 Price Changed $530,000 Stellar MLS as Distributed by MLS Grid
- 2026-03-21 Price Changed $575,000 Stellar MLS as Distributed by MLS Grid
- 2026-03-06 Listed for Rent $3,500 STELLARMLS
- 2026-02-23 Listed $580,000 Stellar MLS as Distributed by MLS Grid
- 2026-01-14 Listing Removed — Stellar MLS as Distributed by MLS Grid
- 2025-10-27 Price Changed $595,000 Stellar MLS as Distributed by MLS Grid
- 2025-09-25 Price Changed $599,990 Stellar MLS as Distributed by MLS Grid
- 2025-08-20 Price Changed $614,990 Stellar MLS as Distributed by MLS Grid
- 2025-07-13 Listed $625,000 Stellar MLS as Distributed by MLS Grid
- 2015-09-02 Sold (Public Records) $175,000 Public Records
- 1999-08-02 Sold (Public Records) $115,000 Public Records
Property tax history
+2.5%/yrLatest (2025): $3,486 · +7.4% YoY. Source: county tax records.
Cash-flow waterfall
monthlySold comps — $/sqft
last 12 mo · ≤1 miLoading sold comps…