105 D Constitution Blvd · Crestwood Village, NJ
Flood risk 6/10 · Moderate
- FEMA flood zone
- X (unshaded)
- Chance of flooding over 30 yrs
- 0.69%
- Est. flood insurance / yr
- $507 – $1,088
Fire risk 6/10 · Moderate
- Est. fire insurance / yr
- $526 – $976
Heat risk 6/10 · Moderate
- Hot days now (above 103°F)
- 7 days/yr
- Hot days in 30 yrs
- 14 days/yr
Wind risk 6/10 · Moderate
- Chance of severe wind over 30 yrs
- 64.0%
Air-quality risk 4/10 · Minor
- Unhealthy air days now
- 4 days/yr
- Unhealthy air days in 30 yrs
- 5 days/yr
Risk factors via First Street. Map © Google.
Why this score? — see what drove the B+ grade
The composite is a weighted blend of 9 inputs, each scored 0–100. Each bar is that input's sub-score; the figure is the points it added to the 100-point composite (weight × sub-score).
- Cash flow +30.0/30.0
- ARV discount +15.0/15.0
- 1% rule +10.0/10.0
- DSCR +10.0/10.0
- Condition / age +4.0/5.0
- Livability +3.2/5.0
- Schools +2.9/10.0
- Rent growth +2.5/5.0
- Appreciation +0.0/10.0
$60,000
🖨 Deal sheet 📄 Offer letter ✓ Due diligence
Listing remarks
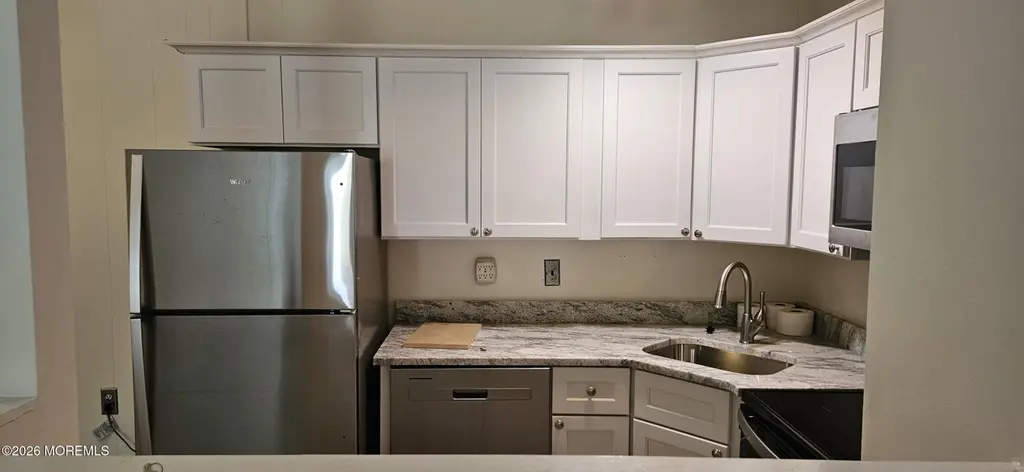
Welcome to Crestwood Village 2 Adult Community, where comfort meets tranquility. This beautifully remodeled 1 bed, 1 bath home offers a peaceful lifestyle in a quiet setting. Features include a spacious bedroom with walk-in closet and full bath. The updated kitchen boasts granite countertops, stainless steel appliances, quiet-close white cabinets, and a cozy eat-in area. Waterproof vinyl flooring flows throughout. Enjoy the private patio for relaxing outdoors. Renovated in 2026 with new floors, windows, and fresh paint--move-in ready!
Key facts
- Spacious bedroom
- Walk-in closet
- Updated kitchen
Tags
Property features AI
Finance
- HOA & community: HOA present (Crestwood 2); Monthly association fee; Clubhouse and landscaping; HOA covers trash, common area, lawn maintenance, and snow removal
Exterior
- Parking: No garage
- Utilities: Public sewer
- Home design: Attached property; Cooperative ownership
- Exterior features: Shingle roof
Interior
- Kitchen: Dishwasher; Microwave; Stove; Refrigerator; Counter top range
- Bedrooms: 1 bedroom (first level)
- Bathrooms: 1 full bathroom
- Heating & cooling: Electric heating; Baseboard heating; Electric cooling; Multiple cooling units
- Interior features: Ceiling fan(s); Counter top range; Electric cooking; No fireplaces
- Laundry & utility: Washer; Dryer; AC units
Neighborhood map
What this means for you Summary
Snapshot
- This is a 1-bed/1.0-bath single-family listed at $60k. Condition is rated good.
Deal economics
- At list price, monthly cash flow is $911 ($11k/yr) — positive.
- The deal already cash-flows at list — no discount required.
- Meets the 1% rule at list price ($2k rent vs $60k).
- Recommended offer: $58k (3.0% below list) — sets the bar for market timing.
- Cap rate 24.5% vs local median 5.6% in Crestwood Village — top-decile yield for the area; either an underpriced asset or a hidden risk that comps aren't pricing in. Stress-test before assuming the spread holds.
Location & tenants
- Location reads 63/100 on livability (#422 in NJ) — a middle-class / working-renter tenant base. Strengths: cost of living A, housing A, health & safety B+; Watch: schools F, amenities F, commute F.
- Manchester Township School District (suburban): math 25% / reading 44% proficiency, ranked #320 of 472 in NJ (top 68%) — families likely to look elsewhere, expect single-tenant / working-renter base with shorter leases.
- Market conditions: 648 active listings in the ZIP; 4 comparable units currently listed for rent nearby; rentals at typical pace (median 25d on market — plan ~3-4 weeks tenant-placement turnaround); 4,434 units permitted in Ocean County in 2024 (868 in 5+ unit buildings).
Forward outlook
- Local home prices are declining (-3.0%/yr); year-one equity from $415 of loan paydown is wiped out by about $2k of value loss. Plan a longer hold.
- Ocean County population projected to shrink 8% by 2050 — rents likely to lag national; underwrite the cash flow, not the appreciation.
- At projected returns (-3.0% appreciation + 3.0% rent growth), your $17k cash investment doubles in ~2 years — after that, you're playing with house money.
Negotiation context
- It's been on market 46 days — a 3% lower offer ($58k) is reasonable based on typical stale-listing flexibility.
Risks & watch-outs
- Climate carrying-cost: major flood risk; major wind risk, 64% chance of damaging wind over 30y; major wildfire risk; extreme-heat days projected 7→14/yr by 2055 (HVAC capex compounding) — expect insurance premiums to compound above CPI over the hold.
Questions for the listing agent
- It's been on market 46 days. Have you received any prior offers? Is the seller open to a 3% concession, seller financing, or rate buy-down credit?
- What does the HOA fee cover, when was the last increase, and are there any pending special assessments or reserve-fund shortfalls?
- Is there a deadline driving the sale (1031 exchange, divorce, estate, relocation)? That informs how much negotiation room exists.
- Schools are F-rated, which usually means shorter tenancies and higher turnover. Who's the typical renter profile here, and what's been the actual vacancy rate?
- What's the average days-on-market for RENTAL listings here right now (not sales)? A rising rental-DOM trend means longer vacancies and softer asking-rent achievability than the comps imply.
- What's the recent tenant-quality profile in this submarket — average credit score on applications, eviction rate, late-payment / NSF rate, and stable-employment percentage? A property-management company in the area should have these aggregated.
- How much new for-sale + rental construction is in the pipeline within 1–3 miles? Heavy new supply typically softens prices + rents 12–24 months out; constrained supply supports both.
Investment metrics
- 1% rule
- 3.40% ✓
- Cap rate
- 24.52%
- Cash-on-cash
- 65.09%
- DSCR
- 3.90
- GRM
- 2.5
CMA / ARV
- ARV (median comp)
- $99,103
- List price
- $60,000
- Delta
- -39.46%
- Verdict
- UNDERPRICED
- Comps
- 20 within 1.0 mi
Show comp detail 12 sales within ~0.75 mi
| Address | Dist | Beds/Ba | Sqft | Sold | Price | $/sf | Match |
|---|---|---|---|---|---|---|---|
| 105 E Constitution Blvd | 0.01mi | 1/1.0 | 850 (0%) | 1mo | $60,000 | $71 | 98 |
| 14 Betsy Ross Ln Unit A | 0.30mi | 2/1.0 (+1) | 900 (+6%) | 3mo | $74,000 | $82 | 68 |
| 197 Laurel Pl Unit A | 0.39mi | 1/1.0 | 900 (+6%) | 8mo | $61,000 | $68 | 66 |
| 6 Columbus Blvd Unit C | 0.42mi | 2/1.0 (+1) | 797 (-6%) | 2mo | $118,000 | $148 | 64 |
| 32 Columbus Blvd Unit A | 0.36mi | 1/1.0 | 782 (-8%) | 8mo | $75,000 | $96 | 63 |
| 21 A Homestead | 0.46mi | 2/1.0 (+1) | 912 (+7%) | 3mo | $93,500 | $103 | 59 |
| 6 Pembroke Ln Unit C | 0.60mi | 2/1.0 (+1) | 880 (+4%) | 3mo | $169,000 | $192 | 59 |
| 6 Wintergreen Ln Unit C | 0.69mi | 1/1.0 | 860 (+1%) | 8mo | $69,900 | $81 | 59 |
| 1D Bristol St | 0.68mi | 1/1.0 | 814 (-4%) | 3mo | $109,000 | $134 | 59 |
| 6C Verbena Ct | 0.74mi | 2/1.0 (+1) | 797 (-6%) | 2mo | $90,000 | $113 | 48 |
| 19B Medford Rd #61 | 0.68mi | 2/1.0 (+1) | 924 (+9%) | 1mo | $171,000 | $185 | 48 |
| 19B Medford Rd #61 | 0.68mi | 2/1.0 (+1) | 924 (+9%) | 7mo | $80,000 | $87 | 43 |
Match score weights: distance 35% · size 25% · config 20% · recency 20%. Top-matched comps best support the ARV.
Projected returns pro-forma
-3.0% appreciation · 3.0% rent growth · sell at horizon
- IRR
- 64.4%
- Equity multiple
- 3.89×
- Total profit
- $48,524
- Equity at exit
- $8,946
- IRR
- 68.8%
- Equity multiple
- 8.01×
- Total profit
- $117,825
- Equity at exit
- $5,188
Cash invested: $16,800 (down + closing). Projections, not guarantees.
Landlord ↔ Tenant lean methodology
- Overall (STATE)
- 21 Tenant-Leaning
- State New Jersey
- 21 Tenant-Leaning · D+6
- County
- — inherits STATE
- City
- — inherits STATE
ZIP-level market 08759
- Active inventory
- 648
- Price-to-rent
- 2.5×
Monthly cashflow live
- Estimated rent
- $2,038 medium interval (Pro) →
- Mortgage (P&I)
- −$315
- Tax est. 1.5%
- −$75 /mo · $900/yr
- Insurance
- −$25
- HOA
- −$284
- Vacancy / Maint / Mgmt
- −$428
- Net cashflow
- $911
Break-even live
UW: 25.0% down · 7.5% · 30yr · 1.5% tax · 5.0% vac · 8.0% maint · 8.0% mgmt
Financing live
Cash to close
- Down payment
- $15,000
- Closing costs
- $1,800
- Reserves months
- —
- Total cash needed
- —
Loan-product check · same deal, 3 products live
Conventional
25% down · 7.5% · 30yr
- Down + closing
- —
- Monthly P&I
- —
- Monthly cashflow
- —
- DSCR
- —
- Eligible?
- —
Personal DTI + credit; lowest rate.
DSCR
20% down · 8.5% · 30yr
- Down + closing
- —
- Monthly P&I
- —
- Monthly cashflow
- —
- DSCR
- —
- Eligible?
- —
No personal income docs; deal must DSCR.
Hard money
10% down · 12.0% · 12mo
- Down + closing
- —
- Monthly P&I
- —
- Monthly cashflow
- —
- DSCR
- —
- Eligible?
- —
Short-term bridge; refi at stabilization.
Rent comps 4 comps
| Address | Beds | Baths | Sqft | Rent | $/sqft | DOM | Units | Dist |
|---|---|---|---|---|---|---|---|---|
| 19B Maplewood Dr #52 Whiting, NJ | 2.0 | 1.5 | 1109 | $2,250 | $2.03 | 17d | 1 | 0.68mi |
| 57D Milford Ave Unit 53 Whiting, NJ | 2.0 | 1.0 | 880 | $1,800 | $2.05 | 24d | 1 | 0.74mi |
| 50 Westport Dr #71 Whiting, NJ | 2.0 | 1.0 | 1120 | $2,200 | $1.96 | 1d | 1 | 0.81mi |
| 9A Juniper Ln Unit 50 Whiting, NJ | 1.0 | 1.0 | 1009 | $1,950 | $1.93 | 43d | 1 | 0.92mi |
HOA detail
- Monthly dues
- $284 · $3,408/yr
- Likely covers
- water
Listing history 14 events
-
2026-06-18days on market $60,000 Active 46 DOM
-
2026-06-17days on market $60,000 Active 45 DOM
-
2026-06-16pricedays on market $60,000 Active 44 DOM
-
2026-06-15days on market $72,500 Active 43 DOM
-
2026-06-13days on market $72,500 Active 41 DOM
-
2026-06-09days on market $72,500 Active 37 DOM
-
2026-06-08days on market $72,500 Active 36 DOM
-
2026-06-07days on market $72,500 Active 35 DOM
-
2026-06-04days on market $72,500 Active 32 DOM
-
2026-06-03days on market $72,500 Active 31 DOM
-
2026-06-02days on market $72,500 Active 30 DOM
-
2026-06-01days on market $72,500 Active 29 DOM
-
2026-05-31days on market $72,500 Active 28 DOM
-
2026-05-04$80,000 Active 540-char remark
ⓘ Source: listings_history table (triggers on properties + properties_extension) + one-shot
backfill from property_details.listing_events for pre-trigger history.
Climate risk First Street
- Flood 6/10 Major FEMA zone X (unshaded) · 69% chance over 30 yrs
- Wildfire 6/10 Major
- Heat 6/10 Major 7 d/yr ≥103°F today · 14 d/yr by 30 yrs out
- Wind 6/10 Major 64% chance of damaging wind over 30 yrs
- Air quality 4/10 Moderate 4 unhealthy d/yr today · 5 by 30 yrs out
Nearby sold comps map
Loading sold comps map…
Walkable amenities ~0.75 mi
Loading nearby amenities…
Taxation est. · year 1
- Rental income
- $24,455
- − Mortgage interest
- −$3,361
- − Property taxes
- −$900
- − Insurance
- −$300
- − Repairs & maintenance
- −$1,956
- − Management
- −$1,956
- − HOA
- −$3,408
- − Depreciation
- −$1,745
- Taxable income
- $10,828
- Est. tax owed @ 24.0%
- −$2,599
- After-tax cash flow
- $8,337/yr
For passive investors: Depreciation is non-cash, so a rental often shows a tax loss while cash-flowing — sheltering income. Rental losses are passive: they offset passive income freely, and up to $25,000/yr can offset ordinary (W-2) income if you actively participate and your MAGI is under $100k (phasing out to $0 by $150k); unused losses carry forward. On sale, claimed depreciation is recaptured at up to 25%, and gains may owe capital-gains tax (a 1031 exchange can defer both). Figures are a year-1 estimate at your 24.0% rate — not tax advice; consult a CPA.
Condition & rehab AI · 10 photos
This move-in ready, remodeled home in Crestwood Village offers a spacious bedroom, updated kitchen, and new flooring and windows. The private patio and fresh paint enhance its curb appeal and overall value.
Value-add opportunities
- Both Landscaping — Improves curb appeal and enhances the home's aesthetic
- Both Painting — Fresh paint can make the home look more inviting and well-maintained
Renovation cost estimate screening
Value-add ROI direction
- Both Landscaping — Improves curb appeal and enhances the home's aesthetic ↑
- Both Painting — Fresh paint can make the home look more inviting and well-maintained ↑
ⓘ Cost ranges are severity-bucket heuristics (US national rule-of-thumb). Get contractor quotes + a written scope before underwriting a rehab budget.
Schools (NCES district)
- District
- Manchester Township School District
- NCES district ID
- 3409450
- Math proficiency
- 25% ▼ -17.00%
- Reading proficiency
- 44% ▼ -5.00%
- Median HH income
- $38,905
- Composite
- 28.8/100
- National rank
- #6662
- State rank
- #320 of 472 in NJ
Livability — Crestwood Village
- Score
- 63/100
- State rank
- #422
- US rank
- #15006
Category grades
Schools grade is shown separately in the Schools card above.
Census & demographics
- Census place
- Crestwood Village, NJ
- City population
- 34,290
- Population (ZIP)
- 34,290
Population outlook (Ocean County) Hauer SSP2
- Today (2025)
- 586,991 people
- By 2030
- 581,403 · -1.0%
- By 2040
- 564,913 · -3.8%
- By 2050
- 538,149 · -8.3%
- By 2075
- 468,845 · -20.1%
- By 2100
- 350,297 · -40.3%
Race, ethnicity, and origin ACS 2023
- Neighborhood character
- Predominantly White (87%)
- Race & ethnicity
- White 87% Hispanic / Latino 5% Black 4% Two or more races 4% Asian 2%
- Hispanic origin (detail)
- Puerto Rican 2%
- Common ancestry
- Romanian 8% Scotch-Irish 2% Lithuanian 2%
- Foreign-born
- 11% · Canada, China
- Languages at home
- 88% English-only · Spanish 3% Russian/Polish/Slavic 2% Other Indo-European 2%
Political lean MEDSL · Ocean
- 2024 margin
- Solid R (+36.0) · D 31.4% · R 67.4% · Other 1.2%
- 2008→2024 swing
- -17.6pp toward R · 2008: -18.4pp · 2024: -36.0pp
- All cycles
- 2024: R+36.0 2020: R+28.7 2016: R+34.0 2012: R+17.7 2008: R+18.4
Not yet ingested
- Civics
- —
Market trends
- HPI YoY
- ▼ -347.85%
- Current HPI
- 274.4679
- Rent YoY
- —
- Metro
- —
- State GDP YoY
- ▲ 2.05%
- F500 in state
- 34
Industry mix (Fortune 500 HQ in NJ)
| Industry | F500 HQs | Revenue |
|---|---|---|
| Consumer Goods | 3 | $31B |
|
||
| Pharmaceuticals | 2 | $153B |
|
||
| Technology | 2 | $21B |
|
||
| Insurance | 2 | $20B |
|
||
| Healthcare | 2 | $19B |
|
||
| Financial Services | 1 | $70B |
|
||
Price history
-25.0% since first listed3 events — show timeline
- 2026-06-16 Price Changed $60,000 MOMLS
- 2026-05-19 Price Changed $72,500 MOMLS
- 2026-05-04 Listed $80,000 MOMLS
Cash-flow waterfall
monthlySold comps — $/sqft
last 12 mo · ≤1 miLoading sold comps…