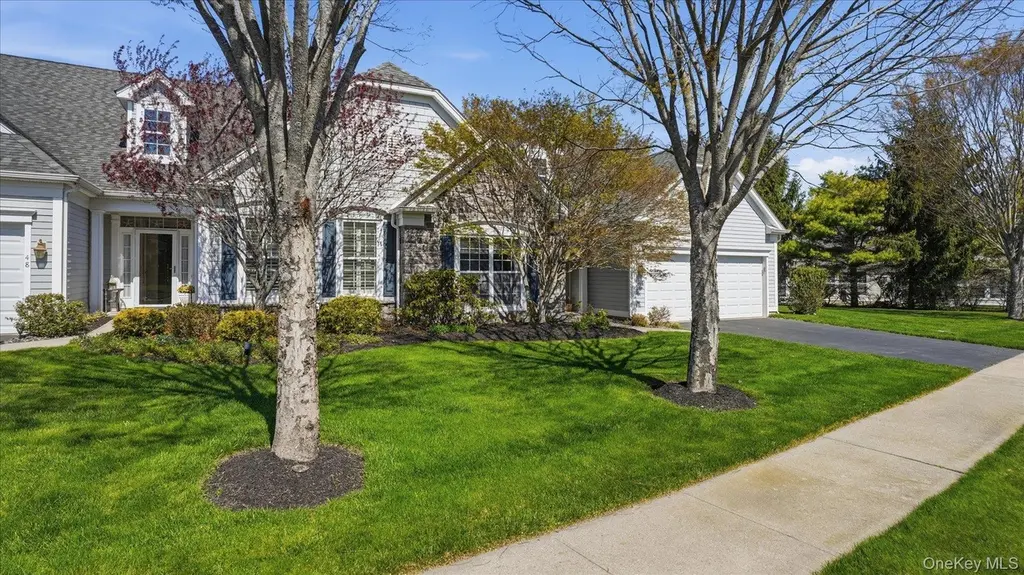
49 Samantha Cir #49 · Westhampton, NY
Flood risk 1/10 · Minimal
- FEMA flood zone
- X (unshaded)
- Chance of flooding over 30 yrs
- 0.0%
- Est. flood insurance / yr
- $507 – $1,088
Fire risk 3/10 · Minor
- Est. fire insurance / yr
- $691 – $1,283
Heat risk 5/10 · Moderate
- Hot days now (above 91°F)
- 7 days/yr
- Hot days in 30 yrs
- 20 days/yr
Wind risk 8/10 · Major
- Chance of severe wind over 30 yrs
- 80.0%
Air-quality risk 4/10 · Minor
- Unhealthy air days now
- 4 days/yr
- Unhealthy air days in 30 yrs
- 5 days/yr
Risk factors via First Street. Map © Google.
Why this score? — see what drove the A+ grade
The composite is a weighted blend of 9 inputs, each scored 0–100. Each bar is that input's sub-score; the figure is the points it added to the 100-point composite (weight × sub-score).
- Cash flow +30.0/30.0
- ARV discount +15.0/15.0
- 1% rule +10.0/10.0
- DSCR +10.0/10.0
- Appreciation +9.4/10.0
- Schools +6.6/10.0
- Condition / age +4.0/5.0
- Livability +3.0/5.0
- Rent growth +2.5/5.0
$989,000
🖨 Deal sheet 📄 Offer letter ✓ Due diligence
Listing remarks
Welcome to luxurious resort-style living in the highly desirable Westhampton Pines 55+ community. This beautifully maintained Bridghampton one-story model offers the perfect blend of luxury and low-maintenance living in the heart of the Hamptons. Filled with natural light, this spacious home features an open and inviting layout with a large living room with a gas fireplace and a formal dining area. A chef's eat-in-kitchen with granite countertops, stainless steel appliances, abundant cabinetry, and a sunny breakfast nook overlooking peaceful greenspace. The spacious primary suite features a spa-like ensuite bath with a jacuzzi tub, a separate shower, and an oversized walk-in closet. A gene
Key facts
- Sunny breakfast nook
- Eat in kitchen
- Gas fireplace
Tags
Property features AI
Finance
- Financial info: One-time 1% flip tax to buyer
- HOA & community: Westhampton Pines association; Monthly HOA fee; HOA amenities include clubhouse, fitness center, gated entry, landscaping and grounds maintenance, pool, recreation facilities, sauna, security, snow removal, spa/hot tub, tennis courts, and trash service; HOA covers common area and exterior maintenance, grounds care, pool service, sewer, snow removal, and trash
Exterior
- Parking: 6 total parking spaces (driveway and common parking); 2-car garage
- Security: Gated community with security gate
- Utilities: Shared sewer; Cable available; Electricity connected; Natural gas connected; Phone available; Sewer connected; Trash collection (private); Water connected
- Home design: Townhouse (condominium); One story; Entry at level 1; Public records living area
- Construction: Frame construction with HardiPlank-type siding; Slab foundation
- Exterior features: Community indoor and outdoor pool; Tennis courts; Lighting; Mailbox; Rain gutters; Back yard; Front yard; Landscaped grounds; No fencing
Interior
- Kitchen: Cooktop; Gas cooktop; Electric oven; Oven; Microwave; Dishwasher; Refrigerator; Stainless steel appliances; Granite counters; Pantry; Eat-in kitchen; Breakfast bar; Chef's kitchen; Walk-through layout
- Bedrooms: Master bedroom on main level; First-floor bedroom
- Flooring: Carpet; Laminate; Tile
- Bathrooms: 2 full bathrooms
- Heating & cooling: Central air; Forced air heating; Gas water heater
- Interior features: First-floor bedroom; First-floor full bath; Breakfast bar; Ceiling fans; Chandelier; Chef's kitchen; Crown molding; Dry bar; Eat-in kitchen; Entrance foyer; Formal dining; Granite counters; Pantry; Primary bathroom; Master bedroom on main level; Recessed lighting; Tray ceilings; Walk-through kitchen; Walk-in closets; Washer/dryer hookup; Blinds; Casement windows with screens; Patio; Porch; Pets allowed
- Laundry & utility: Washer; Dryer; Washer/dryer hookup; Inside laundry room; Gas water heater
Neighborhood map
What this means for you Summary
Snapshot
- This is a 2-bed/2.0-bath condo listed at $989k. Condition is rated good.
Deal economics
- At list price, monthly cash flow is $4k ($49k/yr) — positive.
- The deal already cash-flows at list — no discount required.
- Meets the 1% rule at list price ($15k rent vs $989k).
- Recommended offer: $959k (3.0% below list) — sets the bar for market timing.
- Cap rate 11.2% vs local median 9.1% in Westhampton — meaningfully above typical; check what's discounted (condition, days-on-market, listing class) to confirm the premium yield is real.
Location & tenants
- Location reads 60/100 on livability (#969 in NY) — a middle-class / working-renter tenant base. Strengths: crime A+, employment A+; Watch: housing C-, amenities F, commute F.
- Westhampton Beach Union Free School District (suburban): math 72% / reading 75% proficiency, ranked #81 of 590 in NY (top 14%) — strong family-tenant draw, lease renewals of 3-5y typical.
- Zoned schools: Westhampton Beach Elementary School (math 67% / reading 67%, grade B+, #525 of 2,108 statewide, top 27%, 356 students, 43% FRL); Westhampton Middle School (math 61% / reading 63%, grade B+, #136 of 729 statewide, top 20%, 434 students, 26% FRL); Westhampton Beach Senior High School (math 90% / reading 96%, grade A+, #147 of 1,100 statewide, top 14%, 964 students, 24% FRL).
- Market conditions: 63 active listings in the ZIP; 1 comparable units currently listed for rent nearby; high-income renter base; 1,366 units permitted in Suffolk County in 2024 (216 in 5+ unit buildings).
- At $15,174/mo this rent would consume 120% of the median local household income ($151k/yr) — very limited rent-growth headroom before tenants either downsize or default.
Forward outlook
- In year one you build about $94k of equity ($7k loan paydown + $87k appreciation (8.8% local appreciation)).
- Suffolk County population projected to shrink 5% by 2050 — rents likely to lag national; underwrite the cash flow, not the appreciation.
- At projected returns (8.8% appreciation + 3.0% rent growth), your $277k cash investment doubles in ~2 years — after that, you're playing with house money.
- By year 2, paydown + projected appreciation supports a ~$151k cash-out refi (75% LTV) — recoverable capital for the next deal without selling this one.
Negotiation context
- It's been on market 38 days — a 3% lower offer ($959k) is reasonable based on typical stale-listing flexibility.
Risks & watch-outs
- Climate carrying-cost: severe wind risk, 80% chance of damaging wind over 30y; extreme-heat days projected 7→20/yr by 2055 (HVAC capex compounding) — expect insurance premiums to compound above CPI over the hold.
Questions for the listing agent
- It's been on market 38 days. Have you received any prior offers? Is the seller open to a 3% concession, seller financing, or rate buy-down credit?
- What does the HOA fee cover, when was the last increase, and are there any pending special assessments or reserve-fund shortfalls?
- Any open or pending special assessments — roof, HVAC, plumbing, elevator, façade? What's the per-unit balance and payoff schedule, and is the seller paying it off at close or rolling it to the buyer?
- Is there a deadline driving the sale (1031 exchange, divorce, estate, relocation)? That informs how much negotiation room exists.
- Schools are D-rated, which usually means shorter tenancies and higher turnover. Who's the typical renter profile here, and what's been the actual vacancy rate?
- What's the average days-on-market for RENTAL listings here right now (not sales)? A rising rental-DOM trend means longer vacancies and softer asking-rent achievability than the comps imply.
- What's the recent tenant-quality profile in this submarket — average credit score on applications, eviction rate, late-payment / NSF rate, and stable-employment percentage? A property-management company in the area should have these aggregated.
- How much new apartment / multifamily construction is in the pipeline within 1–3 miles? Heavy new supply (>2% of stock underway) typically softens rents 12–24 months out; light construction supports rent growth.
Investment metrics
- 1% rule
- 1.53% ✓
- Cap rate
- 11.22%
- Cash-on-cash
- 17.60%
- DSCR
- 1.78
- GRM
- 5.4
CMA / ARV
- ARV (median comp)
- $1,301,981
- List price
- $989,000
- Delta
- -24.04%
- Verdict
- UNDERPRICED
- Comps
- 20 within 1.0 mi
Projected returns pro-forma
8.82% appreciation · 3.0% rent growth · sell at horizon
- IRR
- 35.3%
- Equity multiple
- 3.60×
- Total profit
- $719,908
- Equity at exit
- $807,594
- IRR
- 31.0%
- Equity multiple
- 7.87×
- Total profit
- $1,903,283
- Equity at exit
- $1,659,884
Cash invested: $276,920 (down + closing). Projections, not guarantees.
Landlord ↔ Tenant lean methodology
- Overall (STATE)
- 15 Strongly Tenant-Friendly
- State New York
- 15 Strongly Tenant-Friendly · D+10
- County
- — inherits STATE
- City
- — inherits STATE
ZIP-level market 11977
- Home prices YoY
- 2.3%
- Active inventory
- 63
- Price-to-rent
- 5.4×
Monthly cashflow live
- Estimated rent
- $15,174 medium interval (Pro) →
- Mortgage (P&I)
- −$5,186
- Tax est. 1.5%
- −$1,236 /mo · $14,835/yr
- Insurance
- −$412
- HOA
- −$1,090
- Vacancy / Maint / Mgmt
- −$3,187
- Net cashflow
- $4,063
Break-even live
UW: 25.0% down · 7.5% · 30yr · 1.5% tax · 5.0% vac · 8.0% maint · 8.0% mgmt
Financing live
Cash to close
- Down payment
- $247,250
- Closing costs
- $29,670
- Reserves months
- —
- Total cash needed
- —
Loan-product check · same deal, 3 products live
Conventional
25% down · 7.5% · 30yr
- Down + closing
- —
- Monthly P&I
- —
- Monthly cashflow
- —
- DSCR
- —
- Eligible?
- —
Personal DTI + credit; lowest rate.
DSCR
20% down · 8.5% · 30yr
- Down + closing
- —
- Monthly P&I
- —
- Monthly cashflow
- —
- DSCR
- —
- Eligible?
- —
No personal income docs; deal must DSCR.
Hard money
10% down · 12.0% · 12mo
- Down + closing
- —
- Monthly P&I
- —
- Monthly cashflow
- —
- DSCR
- —
- Eligible?
- —
Short-term bridge; refi at stabilization.
Rent comps 1 comps
| Address | Beds | Baths | Sqft | Rent | $/sqft | DOM | Units | Dist |
|---|---|---|---|---|---|---|---|---|
| 70 Jagger Ln Westhampton, NY | 3.0 | 2.0 | 1850 | $22,500 | $12.16 | 1d | 1 | 1.43mi |
HOA detail condo
- Monthly dues
- $1,090 · $13,080/yr
- Likely covers
- gas
- Assessments
- None detected in remarks — confirm with the listing agent.
Listing history 14 events
-
2026-06-18days on market $989,000 Active 38 DOM
-
2026-06-17days on market $989,000 Active 37 DOM
-
2026-06-16days on market $989,000 Active 36 DOM
-
2026-06-15days on market $989,000 Active 35 DOM
-
2026-06-13days on market $989,000 Active 33 DOM
-
2026-06-09days on market $989,000 Active 29 DOM
-
2026-06-08days on market $989,000 Active 28 DOM
-
2026-06-07days on market $989,000 Active 27 DOM
-
2026-06-04days on market $989,000 Active 24 DOM
-
2026-06-03days on market $989,000 Active 23 DOM
-
2026-06-02days on market $989,000 Active 22 DOM
-
2026-06-01days on market $989,000 Active 21 DOM
-
2026-05-31pricedays on market $989,000 Active 20 DOM
-
2026-05-11$999,000 Active 1470-char remark
ⓘ Source: listings_history table (triggers on properties + properties_extension) + one-shot
backfill from property_details.listing_events for pre-trigger history.
Climate risk First Street
- Flood 1/10 Low FEMA zone X (unshaded) · 0% chance over 30 yrs
- Wildfire 3/10 Moderate
- Heat 5/10 Major 7 d/yr ≥91°F today · 20 d/yr by 30 yrs out
- Wind 8/10 Severe 80% chance of damaging wind over 30 yrs
- Air quality 4/10 Moderate 4 unhealthy d/yr today · 5 by 30 yrs out
Nearby sold comps map
Loading sold comps map…
Walkable amenities ~0.75 mi
Loading nearby amenities…
Taxation est. · year 1
- Rental income
- $182,086
- − Mortgage interest
- −$55,399
- − Property taxes
- −$14,835
- − Insurance
- −$4,945
- − Repairs & maintenance
- −$14,567
- − Management
- −$14,567
- − HOA
- −$13,080
- − Depreciation
- −$28,771
- Taxable income
- $35,922
- Est. tax owed @ 24.0%
- −$8,621
- After-tax cash flow
- $40,129/yr
For passive investors: Depreciation is non-cash, so a rental often shows a tax loss while cash-flowing — sheltering income. Rental losses are passive: they offset passive income freely, and up to $25,000/yr can offset ordinary (W-2) income if you actively participate and your MAGI is under $100k (phasing out to $0 by $150k); unused losses carry forward. On sale, claimed depreciation is recaptured at up to 25%, and gains may owe capital-gains tax (a 1031 exchange can defer both). Figures are a year-1 estimate at your 24.0% rate — not tax advice; consult a CPA.
Condition & rehab AI · 24 photos
This well-maintained, low-maintenance home in a desirable community offers a luxurious resort-style living experience with ample natural light and open floor plan.
Value-add opportunities
- Resale Paint exterior siding — Enhances curb appeal and property value
- Rental Clean gutters — Keeps property in good condition and reduces maintenance costs
Renovation cost estimate screening
Value-add ROI direction
- Resale Paint exterior siding — Enhances curb appeal and property value ↑
- Rental Clean gutters — Keeps property in good condition and reduces maintenance costs ↑
ⓘ Cost ranges are severity-bucket heuristics (US national rule-of-thumb). Get contractor quotes + a written scope before underwriting a rehab budget.
Schools (NCES district)
- District
- Westhampton Beach Union Free School District
- NCES district ID
- 3631020
- Math proficiency
- 72% ▼ -5.00%
- Reading proficiency
- 75% ▲ 3.00%
- Median HH income
- $88,137
- Composite
- 65.91/100
- National rank
- #444
- State rank
- #81 of 590 in NY
Livability — Westhampton
- Score
- 60/100
- State rank
- #969
- US rank
- #18972
Category grades
Schools grade is shown separately in the Schools card above.
Census & demographics
- Census place
- Westhampton, NY
- County
- Suffolk County · 679,920 people
- City population
- 2,843
- Metro
- New York-Newark-Jersey City, NY-NJ-PA
- Population (ZIP)
- 2,843
- Household income
- $151,375
- Rent vs Own
- Severe rent burden
- 14.0
Population outlook (Suffolk County) Hauer SSP2
- Today (2025)
- 1,505,262 people
- By 2030
- 1,498,318 · -0.5%
- By 2040
- 1,471,101 · -2.3%
- By 2050
- 1,424,848 · -5.3%
- By 2075
- 1,337,157 · -11.2%
- By 2100
- 1,217,720 · -19.1%
Race, ethnicity, and origin ACS 2023
- Neighborhood character
- Predominantly White (89%)
- Race & ethnicity
- White 89% Hispanic / Latino 5% Asian 3% Two or more races 2%
- Hispanic origin (detail)
- Common ancestry
- Scotch-Irish 3% Romanian 3% Subsaharan African 1%
- Foreign-born
- 11% · Canada, South Korea
- Languages at home
- 89% English-only · Spanish 5% Other Indo-European 4% Korean 2%
Political lean MEDSL · Suffolk
- 2024 margin
- Lean R (+10.0) · D 45.0% · R 55.0%
- 2008→2024 swing
- -16.0pp toward R · 2008: 6.0pp · 2024: -10.0pp
- All cycles
- 2024: R+10.0 2020: R+0.0 2016: R+8.2 2012: D+2.9 2008: D+6.0
Not yet ingested
- Civics
- —
Market trends
- HPI YoY
- ▲ 8.82%
- Current HPI
- 391.8868
- Rent YoY
- —
- Metro
- New York-Newark-Jersey City, NY-NJ-PA
- State GDP YoY
- ▲ 2.60%
- F500 in state
- 92
Industry mix (Fortune 500 HQ in NY)
| Industry | F500 HQs | Revenue |
|---|---|---|
| Financial Services | 10 | $950B |
|
||
| Consumer Goods | 9 | $162B |
|
||
| Insurance | 4 | $225B |
|
||
| Telecommunications | 2 | $144B |
|
||
| Pharmaceuticals | 2 | $112B |
|
||
| Media / Entertainment | 2 | $69B |
|
||
Price history
-1.0% since first listed2 events — show timeline
- 2026-05-30 Price Changed $989,000 OneKey® MLS as Distributed by MLS Grid
- 2026-05-11 Listed $999,000 OneKey® MLS as Distributed by MLS Grid
Cash-flow waterfall
monthlySold comps — $/sqft
last 12 mo · ≤1 miLoading sold comps…