6255 Beechtree Dr · West Des Moines, IA
Flood risk 1/10 · Minimal
- FEMA flood zone
- X (unshaded)
- Chance of flooding over 30 yrs
- 0.0%
- Est. flood insurance / yr
- $507 – $1,088
Fire risk 1/10 · Minimal
- Est. fire insurance / yr
- $902 – $1,676
Heat risk 3/10 · Minor
- Hot days now (above 103°F)
- 7 days/yr
- Hot days in 30 yrs
- 15 days/yr
Wind risk 2/10 · Minimal
- Chance of severe wind over 30 yrs
- —
Air-quality risk 1/10 · Minimal
- Unhealthy air days now
- 0 days/yr
- Unhealthy air days in 30 yrs
- 0 days/yr
Risk factors via First Street. Map © Google.
Why this score? — see what drove the C grade
The composite is a weighted blend of 9 inputs, each scored 0–100. Each bar is that input's sub-score; the figure is the points it added to the 100-point composite (weight × sub-score).
- Cash flow +19.9/30.0
- ARV discount +7.5/15.0
- Schools +7.1/10.0
- DSCR +6.3/10.0
- 1% rule +5.3/10.0
- Livability +4.4/5.0
- Rent growth +3.0/5.0
- Condition / age +2.2/5.0
- Appreciation +0.0/10.0
$189,000
🖨 Deal sheet (PDF) 📄 Offer letter ✓ Due diligence
Listing remarks MLS
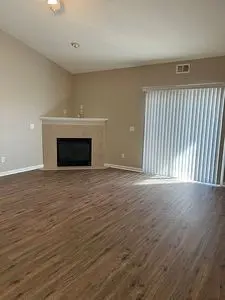
Great Bella Centro resale. Secured building. 1st floor condo end unit facing south. Convenient Jordan Creek location. This is a foreclosure, but it's in good condition, and priced right. 2 bedrooms, 2 full baths. Kitchen has stove, refrigerator, dishwasher and space saver microwave. Stackable washer and dryer also included. Condition of appliances is not warranted. Fireplace. Detached garage. Patio. Dues cover use of Swimming Pool on-site. Note that patio has severe cracking and is homeowner's responsibility.
Key facts
- Built 2004
Neighborhood map
What this means for you Summary
Snapshot
- This is a 3-bed/2.0-bath condo listed at $189k. Condition is rated fair.
Deal economics
- At list price, monthly cash flow is $228 ($3k/yr) — positive.
- The deal already cash-flows at list — no discount required.
- Meets the 1% rule at list price ($2k rent vs $189k).
- Cap rate 7.7% vs local median 2.5% in West Des Moines — top-decile yield for the area; either an underpriced asset or a hidden risk that comps aren't pricing in. Stress-test before assuming the spread holds.
Location & tenants
- Location reads 87/100 on livability (#11 in IA, #336 nationally) — a professional / high-income tenant draw. Strengths: schools A+, amenities A+, cost of living A+; Watch: commute F.
- Waukee Community School District (suburban): math 80% / reading 79% proficiency, ranked #14 of 289 in IA (top 5%) — strong family-tenant draw, lease renewals of 3-5y typical; only 11% free/reduced lunch — higher-income household profile.
- Market conditions: Rents rising (+1.9%/yr); 583 active listings in the ZIP; 22 comparable units currently listed for rent nearby; rentals at typical pace (median 15d on market — plan ~3-4 weeks tenant-placement turnaround); solid renter incomes; 1,503 units permitted in Dallas County in 2024 (630 in 5+ unit buildings).
Forward outlook
- Local home prices are declining (-3.0%/yr); year-one equity from $1k of loan paydown is wiped out by about $6k of value loss. Plan a longer hold.
- Dallas County population projected at +74% by 2050 — long-run rental-demand tailwind backs the buy-and-hold thesis.
Negotiation context
- Only 0 days on market — expect competitive offers; lowballing is unlikely to land.
- 7 sale attempts since 15y ago with the ask held roughly flat each time — persistent listings suggest the price (not the market) is what's stuck; bring a comps-based counter.
- Current owner paid $73k; list at $189k implies a 159% gain — meaningful room to come down on a strong offer.
Questions for the listing agent
- Have any recent inspections been done? Can we get a copy of the seller's disclosures and any deferred-maintenance estimates?
- Any open or pending special assessments — roof, HVAC, plumbing, elevator, façade? What's the per-unit balance and payoff schedule, and is the seller paying it off at close or rolling it to the buyer?
- Is there a deadline driving the sale (1031 exchange, divorce, estate, relocation)? That informs how much negotiation room exists.
- Schools are A-rated — typically a magnet for longer-tenancy family renters. What's the average tenant stay here, and is there a school-zone premium baked into asking?
- What's the average days-on-market for RENTAL listings here right now (not sales)? A rising rental-DOM trend means longer vacancies and softer asking-rent achievability than the comps imply.
- What's the recent tenant-quality profile in this submarket — average credit score on applications, eviction rate, late-payment / NSF rate, and stable-employment percentage? A property-management company in the area should have these aggregated.
- How much new apartment / multifamily construction is in the pipeline within 1–3 miles? Heavy new supply (>2% of stock underway) typically softens rents 12–24 months out; light construction supports rent growth.
Investment metrics
- 1% rule
- 1.03% ✓
- Cap rate
- 7.74%
- Cash-on-cash
- 5.16%
- DSCR
- 1.23
- GRM
- 8.1
CMA / ARV
No comps found within radius.
Projected returns pro-forma
-3.0% appreciation · 1.94% rent growth · sell at horizon
- IRR
- -9.5%
- Equity multiple
- 0.66×
- Total profit
- $-18,141
- Equity at exit
- $28,181
- IRR
- -1.5%
- Equity multiple
- 0.90×
- Total profit
- $-5,232
- Equity at exit
- $16,341
Cash invested: $52,920 (down + closing). Projections, not guarantees.
Landlord ↔ Tenant lean methodology
- Overall (STATE)
- 83 Strongly Landlord-Friendly
- State Iowa
- 83 Strongly Landlord-Friendly · R+6
- County
- — inherits STATE
- City
- — inherits STATE
ZIP-level market 50266
- Home prices YoY
- -17.5%
- Rents YoY
- 1.9%
- Active inventory
- 583
- Price-to-rent
- 8.1×
Monthly cashflow live
- Estimated rent
- $1,942 high interval (Pro) →
- Mortgage (P&I)
- −$991
- Tax est. 1.5%
- −$236 /mo · $2,835/yr
- Insurance
- −$79
- HOA
- −$0
- Vacancy / Maint / Mgmt
- −$408
- Net cashflow
- $228
Break-even live
Sensitivity live
| Price | -10% $358 | -5% $293 | +0% $228 | +5% $162 | +10% $97 |
|---|---|---|---|---|---|
| Rent | -10% $74 | -5% $151 | +0% $228 | +5% $304 | +10% $381 |
| Rate | -1.0pp $323 | -0.5pp $276 | base $228 | +0.5pp $179 | +1.0pp $129 |
UW: 25.0% down · 7.5% · 30yr · 1.5% tax · 5.0% vac · 8.0% maint · 8.0% mgmt
Financing live
Cash to close
- Down payment
- $47,250
- Closing costs
- $5,670
- Reserves months
- —
- Total cash needed
- —
Loan-product check · same deal, 3 products live
Conventional
25% down · 7.5% · 30yr
- Down + closing
- —
- Monthly P&I
- —
- Monthly cashflow
- —
- DSCR
- —
- Eligible?
- —
Personal DTI + credit; lowest rate.
DSCR
20% down · 8.5% · 30yr
- Down + closing
- —
- Monthly P&I
- —
- Monthly cashflow
- —
- DSCR
- —
- Eligible?
- —
No personal income docs; deal must DSCR.
Hard money
10% down · 12.0% · 12mo
- Down + closing
- —
- Monthly P&I
- —
- Monthly cashflow
- —
- DSCR
- —
- Eligible?
- —
Short-term bridge; refi at stabilization.
Rent comps 22 comps
| Address | Beds | Baths | Sqft | Rent | $/sqft | DOM | Units | Dist |
|---|---|---|---|---|---|---|---|---|
| 6565 Wistful Vista Dr West Des Moines, IA | 2.0 | 1.0–2.0 | 871 | $1,765 | $2.03 | 15d | 19 | 0.23mi |
| 204 S 64th St West Des Moines, IA | 1.0–3.0 | 1.0–2.5 | 1346 | $2,790 | $2.07 | 15d | 2 | 0.29mi |
| 6630 Cody Dr West Des Moines, IA | 2.0 | 2.5 | 1200 | $1,565 | $1.30 | 15d | 1 | 0.34mi |
| 6185 Village View Dr Unit 6245-201 West Des Moines, IA | 2.0 | 2.0 | 1165 | $2,000 | $1.72 | 15d | 1 | 0.53mi |
| 6375 Village View Dr West Des Moines, IA | 1.0–2.0 | 1.0–2.0 | 900 | $2,200 | $2.44 | 14d | 9 | 0.56mi |
| 6814 Meadow Ct West Des Moines, IA | 3.0 | 2.5 | 1462 | $2,495 | $1.71 | 21d | 1 | 0.64mi |
| 950 67th St #410 West Des Moines, IA | 2.0 | 2.0 | 999 | $1,295 | $1.30 | 24d | 1 | 0.80mi |
| 7425 Wistful Vista Dr #802 West Des Moines, IA | 2.0 | 1.5 | 1276 | $1,475 | $1.16 | 44d | 1 | 0.92mi |
| 7425 Wistful Vista Dr #304 West Des Moines, IA | 2.0 | 2.0 | 1268 | $1,875 | $1.48 | 15d | 1 | 0.92mi |
| 210 S Prairie View Dr West Des Moines, IA | 1.0–3.0 | 1.0–2.0 | 992 | $1,709 | $1.72 | 15d | 27 | 0.94mi |
| 360 Bridgewood Dr West Des Moines, IA | 2.0 | 1.0–2.0 | 795 | $1,855 | $2.33 | 15d | 21 | 1.00mi |
| 950 Jordan Creek Pkwy West Des Moines, IA | 1.0–2.0 | 1.0–2.0 | 1082 | $3,546 | $3.28 | 15d | 37 | 1.02mi |
| 7171 Woodland Ave West Des Moines, IA | 1.0–2.0 | 1.0–2.0 | 1085 | $1,825 | $1.68 | 15d | 1 | 1.08mi |
| 811 Burr Oaks Dr #1206 West Des Moines, IA | 2.0 | 2.5 | 1279 | $1,700 | $1.33 | 24d | 1 | 1.09mi |
| 6455 Galleria Dr West Des Moines, IA | 1.0–3.0 | 1.0–2.0 | 1048 | $1,831 | $1.75 | 14d | 22 | 1.10mi |
| 716 Knolls Ct West Des Moines, IA | 3.0 | 2.5 | 1448 | $2,095 | $1.45 | 44d | 1 | 1.12mi |
| 5101 Hawthorne Dr West Des Moines, IA | 2.0–3.0 | 2.0 | 1201 | $1,539 | $1.28 | 14d | 4 | 1.27mi |
| 5901 Vista Dr West Des Moines, IA | 3.0 | 2.0 | 830 | $1,476 | $1.78 | 15d | 130 | 1.29mi |
| 5699 Vista Dr West Des Moines, IA | 3.0 | 2.5 | 1870 | $1,872 | $1.00 | 15d | 6 | 1.36mi |
| 8350 Ep True Pkwy #3105 West Des Moines, IA | 2.0 | 2.0 | 1100 | $1,450 | $1.32 | 19d | 1 | 1.41mi |
| 6950 Stagecoach Dr West Des Moines, IA | 2.0–3.0 | 2.5–3.5 | 1785 | $2,585 | $1.45 | 14d | 20 | 1.41mi |
| 4700 Ep True Pkwy West Des Moines, IA | 1.0–2.0 | 1.0–2.0 | 852 | $1,707 | $2.00 | 15d | 25 | 1.44mi |
HOA detail condo
- Monthly dues
- $0 · $0/yr
- Likely covers
- pool
- Assessments
- None detected in remarks — confirm with the listing agent.
Listing history 2 events
-
2026-06-10remarks 659-char remark
-
2026-06-10$189,000 Under Contract
ⓘ Source: listings_history table (triggers on properties + properties_extension) + one-shot
backfill from property_details.listing_events for pre-trigger history.
Climate risk First Street
- Flood 1/10 Low FEMA zone X (unshaded) · 0% chance over 30 yrs
- Wildfire 1/10 Low
- Heat 3/10 Moderate 7 d/yr ≥103°F today · 15 d/yr by 30 yrs out
- Wind 2/10 Low
- Air quality 1/10 Low 0 unhealthy d/yr today · 0 by 30 yrs out
Nearby sold comps map
Loading sold comps map…
Walkable amenities ~0.75 mi
Loading nearby amenities…
Taxation est. · year 1
- Rental income
- $23,299
- − Mortgage interest
- −$10,587
- − Property taxes
- −$2,835
- − Insurance
- −$945
- − Repairs & maintenance
- −$1,864
- − Management
- −$1,864
- − Depreciation
- −$5,498
- Taxable loss
- −$294
- Est. tax savings @ 24.0%
- +$70
- After-tax cash flow
- $2,803/yr
For passive investors: Depreciation is non-cash, so a rental often shows a tax loss while cash-flowing — sheltering income. Rental losses are passive: they offset passive income freely, and up to $25,000/yr can offset ordinary (W-2) income if you actively participate and your MAGI is under $100k (phasing out to $0 by $150k); unused losses carry forward. On sale, claimed depreciation is recaptured at up to 25%, and gains may owe capital-gains tax (a 1031 exchange can defer both). Figures are a year-1 estimate at your 24.0% rate — not tax advice; consult a CPA.
Condition & rehab AI · 2 photos
This move-in ready condo is in good condition with fresh paint and new flooring, but a fresh coat of paint and landscaping improvements could further enhance its value.
Value-add opportunities
- Both Painting the exterior and interior walls — Fresh paint enhances curb appeal and interior aesthetics
- Both Landscaping improvements — A well-maintained lawn and landscaping can increase both resale and rental value
Renovation cost estimate screening
Value-add ROI direction
- Both Painting the exterior and interior walls — Fresh paint enhances curb appeal and interior aesthetics ↑
- Both Landscaping improvements — A well-maintained lawn and landscaping can increase both resale and rental value ↑
ⓘ Cost ranges are severity-bucket heuristics (US national rule-of-thumb). Get contractor quotes + a written scope before underwriting a rehab budget.
Schools (NCES district)
- District
- Waukee Community School District
- NCES district ID
- 1930510
- Math proficiency
- 80% ▼ -6.00%
- Reading proficiency
- 79% ▼ -5.00%
- Median HH income
- $88,580
- Composite
- 70.94/100
- National rank
- #245
- State rank
- #14 of 289 in IA
Livability — West Des Moines
- Score
- 87/100
- State rank
- #11
- US rank
- #336
Category grades
Schools grade is shown separately in the Schools card above.
Census & demographics
- Census place
- West Des Moines, IA
- County
- Dallas County · 77,082 people
- City population
- 71,011
- Metro
- Des Moines-West Des Moines, IA
- Population (ZIP)
- 37,523
- Household income
- $87,025
- Rent vs Own
- Severe rent burden
- 1561.0
Population outlook (Dallas County) Hauer SSP2
- Today (2025)
- 111,904 people
- By 2030
- 127,807 · +14.2%
- By 2040
- 160,576 · +43.5%
- By 2050
- 194,154 · +73.5%
- By 2075
- 271,895 · +143.0%
- By 2100
- 326,525 · +191.8%
Race, ethnicity, and origin ACS 2023
- Neighborhood character
- Predominantly White (80%)
- Race & ethnicity
- White 80% Asian 8% Two or more races 6% Hispanic / Latino 5% Black 3%
- Hispanic origin (detail)
- Mexican 3%
- Common ancestry
- Portuguese 5% Italian 3% Iranian 2%
- Foreign-born
- 12% · Canada, South Korea, Vietnam
- Languages at home
- 86% English-only · Spanish 4% Other Asian/Pacific 3% Other Indo-European 2%
Political lean MEDSL · Dallas
- 2024 margin
- Toss-up / Even · D 46.9% · R 51.7% · Other 1.4%
- 2008→2024 swing
- +0.8pp no change · 2008: -5.5pp · 2024: -4.8pp
- All cycles
- 2024: R+4.8 2020: R+2.0 2016: R+9.6 2012: R+11.8 2008: R+5.5
Not yet ingested
- Civics
- —
Market trends
- HPI YoY
- ▼ -43.24%
- Current HPI
- 203.6979
- Rent YoY
- ▲ 1.94%
- Metro
- Des Moines-West Des Moines, IA
- State GDP YoY
- ▲ 2.48%
- F500 in state
- 4
Industry mix (Fortune 500 HQ in IA)
| Industry | F500 HQs | Revenue |
|---|---|---|
| Financial Services | 1 | $16B |
|
||
| Retail / Convenience | 1 | $15B |
|
||
Price history
+89.0% since first listed13 events — show timeline
- 2026-06-10 Listed $189,000 FSBO.com
- 2024-10-04 Rental Removed $1,600 APPFOLIO
- 2024-09-25 Listed for Rent $1,600 APPFOLIO
- 2024-07-31 Rental Removed $1,275 RENT.
- 2024-05-31 Listed for Rent $1,275 RENT.
- 2024-01-14 Rental Removed $1,250 RENT.
- 2023-11-14 Listed for Rent $1,250 RENT.
- 2015-08-10 Listing Removed — DMMLS
- 2015-07-01 Listed $114,900 DMMLS
- 2013-08-28 Sold (MLS) $73,050 DMMLS
- 2013-07-03 Listed $78,000 DMMLS
- 2011-07-26 Sold (MLS) $100,500 DMMLS
- 2011-06-01 Listed $100,000 DMMLS
Cash-flow waterfall
monthlySold comps — $/sqft
last 12 mo · ≤1 miLoading sold comps…