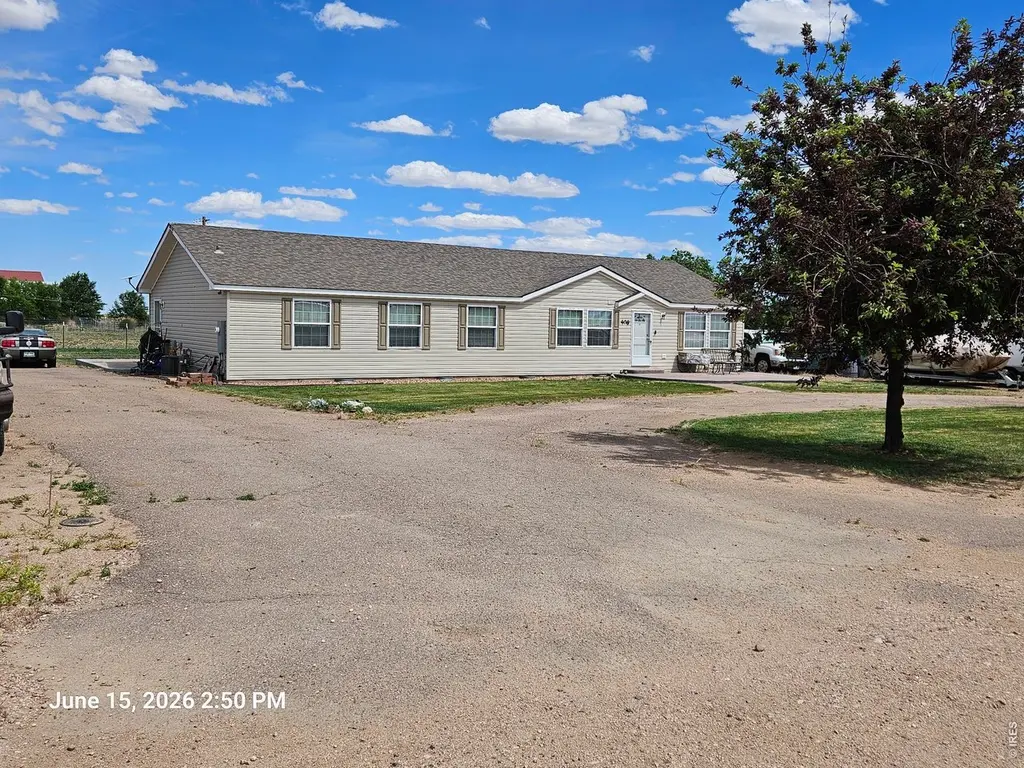
408 Garfield Ave · Nunn, CO
Flood risk 4/10 · Minor
- FEMA flood zone
- X (unshaded)
- Chance of flooding over 30 yrs
- 0.22%
- Est. flood insurance / yr
- $507 – $1,088
Fire risk 7/10 · Major
- Est. fire insurance / yr
- $939 – $1,743
Heat risk 3/10 · Minor
- Hot days now (above 93°F)
- 7 days/yr
- Hot days in 30 yrs
- 17 days/yr
Wind risk 2/10 · Minimal
- Chance of severe wind over 30 yrs
- —
Air-quality risk 3/10 · Minor
- Unhealthy air days now
- 2 days/yr
- Unhealthy air days in 30 yrs
- 2 days/yr
Risk factors via First Street. Map © Google.
Why this score? — see what drove the B+ grade
The composite is a weighted blend of 9 inputs, each scored 0–100. Each bar is that input's sub-score; the figure is the points it added to the 100-point composite (weight × sub-score).
- Cash flow +25.6/30.0
- ARV discount +15.0/15.0
- Appreciation +10.0/10.0
- DSCR +8.5/10.0
- 1% rule +6.1/10.0
- Schools +2.8/10.0
- Livability +2.6/5.0
- Rent growth +2.5/5.0
- Condition / age +2.5/5.0
$234,000
🖨 Deal sheet 📄 Offer letter ✓ Due diligence
Listing remarks MLS
The property is being sold occupied/sight--unseen/no access. DO NOT DISTURB THE OCCUPANTS. NO SHOWINGS and NO PROPERTY ACCESS for inspections or otherwise. NO TRESPASSING. The Listing Agent does not have access to the property, has never been inside the property, and can not speak to the condition of the property, mechanicals, appliances, or any other contents. The occupants do not pay rent. This is not an income property sale. Buyer assumes the property in its current, unknown, as-is condition with the occupants in place. Buyer will be responsible for obtaining possession of the property upon closing. All other information in this listing is based on public records and a previous expired MLS listing - the information has not been verified and may not be accurate. All offers must be submitted by the buyer's agent using the online offer management system.
Key facts
- 0.48 acre lot
- Built 2004
Neighborhood map
What this means for you Summary
Snapshot
- This is a 3-bed/2.0-bath manufactured listed at $234k.
Deal economics
- At list price, monthly cash flow is $553 ($7k/yr) — positive.
- The deal already cash-flows at list — no discount required.
- Meets the 1% rule at list price ($3k rent vs $234k).
Location & tenants
- Location reads 52/100 on livability (#381 in CO) — a working-class tenant base; expect higher turnover. Strengths: housing A+; Watch: schools F, crime F, amenities F.
- Weld County School District No. Re-9 (rural): math 25% / reading 30% proficiency, ranked #117 of 176 in CO (top 66%) — low school quality limits family demand, transient renter base, plan for 1-2y turnover.
- Market conditions: 39 active listings in the ZIP; 1 comparable units currently listed for rent nearby; 3,170 units permitted in Weld County in 2024 (278 in 5+ unit buildings).
Forward outlook
- In year one you build about $25k of equity ($2k loan paydown + $23k appreciation (10.0% local appreciation)).
- Weld County population projected at +46% by 2050 — long-run rental-demand tailwind backs the buy-and-hold thesis.
- At projected returns (10.0% appreciation + 3.0% rent growth), your $66k cash investment doubles in ~2 years — after that, you're playing with house money.
- By year 2, paydown + projected appreciation supports a ~$40k cash-out refi (75% LTV) — recoverable capital for the next deal without selling this one.
Negotiation context
- Only 1 days on market — expect competitive offers; lowballing is unlikely to land.
- 4 sale attempts since 22y ago with the ask held roughly flat each time — persistent listings suggest the price (not the market) is what's stuck; bring a comps-based counter.
Risks & watch-outs
- Climate carrying-cost: major wildfire risk — expect insurance premiums to compound above CPI over the hold.
Questions for the listing agent
- Is there a deadline driving the sale (1031 exchange, divorce, estate, relocation)? That informs how much negotiation room exists.
- Schools are F-rated, which usually means shorter tenancies and higher turnover. Who's the typical renter profile here, and what's been the actual vacancy rate?
- Crime grade is F in this area — have there been break-ins, vandalism, or insurance claims at this property in the last 3 years? What carrier currently insures it and at what premium?
- What's the average days-on-market for RENTAL listings here right now (not sales)? A rising rental-DOM trend means longer vacancies and softer asking-rent achievability than the comps imply.
- What's the recent tenant-quality profile in this submarket — average credit score on applications, eviction rate, late-payment / NSF rate, and stable-employment percentage? A property-management company in the area should have these aggregated.
- How much new for-sale + rental construction is in the pipeline within 1–3 miles? Heavy new supply typically softens prices + rents 12–24 months out; constrained supply supports both.
Investment metrics
- 1% rule
- 1.11% ✓
- Cap rate
- 9.13%
- Cash-on-cash
- 10.13%
- DSCR
- 1.45
- GRM
- 7.5
CMA / ARV
- ARV (on-the-fly)
- $432,480
- Comps found
- 1
Show comp detail 1 sale within ~0.75 mi
| Address | Dist | Beds/Ba | Sqft | Sold | Price | $/sf | Match |
|---|---|---|---|---|---|---|---|
| 420 Lincoln Ave | 0.32mi | 4/3.0 (+1) | 2,025 (-1%) | 22mo | $430,000 | $212 | 57 |
Match score weights: distance 35% · size 25% · config 20% · recency 20%. Top-matched comps best support the ARV.
Projected returns pro-forma
10.0% appreciation · 3.0% rent growth · sell at horizon
- IRR
- 31.7%
- Equity multiple
- 3.48×
- Total profit
- $162,649
- Equity at exit
- $210,806
- IRR
- 27.4%
- Equity multiple
- 7.89×
- Total profit
- $451,192
- Equity at exit
- $454,611
Cash invested: $65,520 (down + closing). Projections, not guarantees.
Landlord ↔ Tenant lean methodology
- Overall (STATE)
- 38 Tenant-Leaning
- State Colorado
- 38 Tenant-Leaning · D+4
- County
- — inherits STATE
- City
- — inherits STATE
ZIP-level market 80648
- Home prices YoY
- 24.0%
- Active inventory
- 39
- Price-to-rent
- 7.5×
Monthly cashflow live
- Estimated rent
- $2,595 medium interval (Pro) →
- Mortgage (P&I)
- −$1,227
- Tax from tax record
- −$172 /mo · $2,065/yr
- Insurance
- −$98
- HOA
- −$0
- Vacancy / Maint / Mgmt
- −$545
- Net cashflow
- $553
Break-even live
UW: 25.0% down · 7.5% · 30yr · 1.5% tax · 5.0% vac · 8.0% maint · 8.0% mgmt
Financing live
Cash to close
- Down payment
- $58,500
- Closing costs
- $7,020
- Reserves months
- —
- Total cash needed
- —
Loan-product check · same deal, 3 products live
Conventional
25% down · 7.5% · 30yr
- Down + closing
- —
- Monthly P&I
- —
- Monthly cashflow
- —
- DSCR
- —
- Eligible?
- —
Personal DTI + credit; lowest rate.
DSCR
20% down · 8.5% · 30yr
- Down + closing
- —
- Monthly P&I
- —
- Monthly cashflow
- —
- DSCR
- —
- Eligible?
- —
No personal income docs; deal must DSCR.
Hard money
10% down · 12.0% · 12mo
- Down + closing
- —
- Monthly P&I
- —
- Monthly cashflow
- —
- DSCR
- —
- Eligible?
- —
Short-term bridge; refi at stabilization.
Rent comps 1 comps
| Address | Beds | Baths | Sqft | Rent | $/sqft | DOM | Units | Dist |
|---|---|---|---|---|---|---|---|---|
| 16172 County Road 98 Nunn, CO | 3.0 | 2.0 | 2048 | $2,595 | $1.27 | 21d | 1 | 1.43mi |
Listing history 2 events
-
2026-06-18remarks 699-char remark
-
2026-06-18$234,000 Active 1 DOM
ⓘ Source: listings_history table (triggers on properties + properties_extension) + one-shot
backfill from property_details.listing_events for pre-trigger history.
Tax reassessment forecast CO · Resets to sale price
- Current annual tax
- $2,065 · $172/mo
- Projected year-2 tax
- $2,065 · $172/mo
- Expected delta
- $0/yr ($0/mo · 0.0%)
ⓘ Screening estimate from a state-policy table — verify with the county assessor before closing.
Climate risk First Street
- Flood 4/10 Moderate FEMA zone X (unshaded) · 22% chance over 30 yrs
- Wildfire 7/10 Severe
- Heat 3/10 Moderate 7 d/yr ≥93°F today · 17 d/yr by 30 yrs out
- Wind 2/10 Low
- Air quality 3/10 Moderate 2 unhealthy d/yr today · 2 by 30 yrs out
Nearby sold comps map
Loading sold comps map…
Walkable amenities ~0.75 mi
Loading nearby amenities…
Taxation est. · year 1
- Rental income
- $31,140
- − Mortgage interest
- −$13,108
- − Property taxes
- −$2,065
- − Insurance
- −$1,170
- − Repairs & maintenance
- −$2,491
- − Management
- −$2,491
- − Depreciation
- −$6,807
- Taxable income
- $3,007
- Est. tax owed @ 24.0%
- −$722
- After-tax cash flow
- $5,918/yr
For passive investors: Depreciation is non-cash, so a rental often shows a tax loss while cash-flowing — sheltering income. Rental losses are passive: they offset passive income freely, and up to $25,000/yr can offset ordinary (W-2) income if you actively participate and your MAGI is under $100k (phasing out to $0 by $150k); unused losses carry forward. On sale, claimed depreciation is recaptured at up to 25%, and gains may owe capital-gains tax (a 1031 exchange can defer both). Figures are a year-1 estimate at your 24.0% rate — not tax advice; consult a CPA.
Schools (NCES district)
- District
- Weld County School District No. Re-9
- NCES district ID
- 0802310
- Math proficiency
- 25% ▲ 5.00%
- Reading proficiency
- 30% ▲ 5.00%
- Median HH income
- $55,080
- Composite
- 27.54/100
- National rank
- #12358
- State rank
- #117 of 176 in CO
Livability — Nunn
- Score
- 52/100
- State rank
- #381
- US rank
- #24796
Category grades
Schools grade is shown separately in the Schools card above.
Census & demographics
- Census place
- Nunn, CO
- Population (ZIP)
- 1,423
Population outlook (Weld County) Hauer SSP2
- Today (2025)
- 351,957 people
- By 2030
- 385,304 · +9.5%
- By 2040
- 451,818 · +28.4%
- By 2050
- 514,478 · +46.2%
- By 2075
- 648,733 · +84.3%
- By 2100
- 720,400 · +104.7%
Race, ethnicity, and origin ACS 2023
- Neighborhood character
- Predominantly White (67%)
- Race & ethnicity
- White 67% Hispanic / Latino 30% Two or more races 24%
- Hispanic origin (detail)
- Mexican 3%
- Common ancestry
- Iranian 7% Lithuanian 5% Serbian 2%
- Languages at home
- 95% English-only · Spanish 5%
Political lean MEDSL · Weld
- 2024 margin
- Strong R (+21.0) · D 38.2% · R 59.2% · Other 2.6%
- 2008→2024 swing
- -12.2pp toward R · 2008: -8.7pp · 2024: -21.0pp
- All cycles
- 2024: R+21.0 2020: R+18.0 2016: R+22.4 2012: R+13.2 2008: R+8.7
Not yet ingested
- Civics
- —
Market trends
- HPI YoY
- ▲ 83.67%
- Current HPI
- 432.8963
- Rent YoY
- —
- Metro
- —
- State GDP YoY
- ▲ 1.95%
- F500 in state
- 14
Industry mix (Fortune 500 HQ in CO)
| Industry | F500 HQs | Revenue |
|---|---|---|
| Technology Distribution | 1 | $31B |
|
||
| Food / Agriculture | 1 | $18B |
|
||
| Packaging | 1 | $14B |
|
||
| Healthcare | 1 | $13B |
|
||
| Energy | 1 | $10B |
|
||
| Technology | 1 | $4B |
|
||
Price history
+38.9% since first listed7 events — show timeline
- 2026-06-17 Listed $234,000 IRES
- 2025-02-10 Listing Removed — IRES
- 2025-01-24 Listed $234,000 IRES
- 2005-06-15 Listing Removed — IRES
- 2004-12-07 Listed $159,000 IRES
- 2004-10-08 Listing Removed — IRES
- 2004-06-08 Listed $168,500 IRES
Property tax history
+6.3%/yrLatest (2025): $2,065 · +48.8% YoY. Source: county tax records.
Cash-flow waterfall
monthlySold comps — $/sqft
last 12 mo · ≤1 miLoading sold comps…