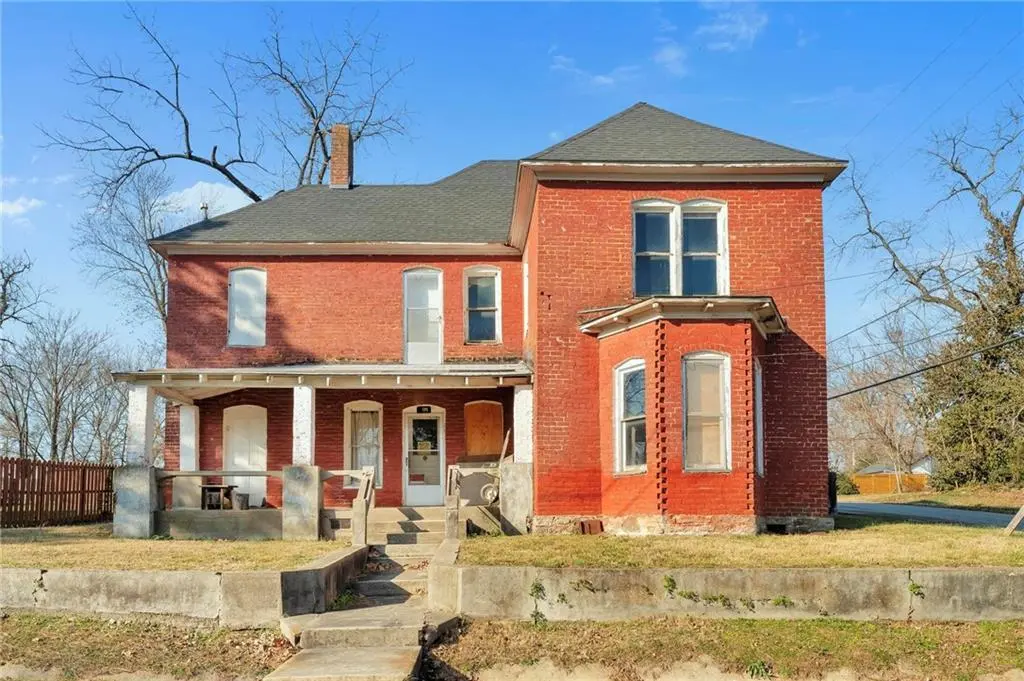
195 N A St · Centerton, AR
Flood risk 1/10 · Minimal
- FEMA flood zone
- X (unshaded)
- Chance of flooding over 30 yrs
- 0.0%
- Est. flood insurance / yr
- $507 – $1,088
Fire risk 5/10 · Moderate
- Est. fire insurance / yr
- $1,499 – $2,785
Heat risk 5/10 · Moderate
- Hot days now (above 105°F)
- 7 days/yr
- Hot days in 30 yrs
- 21 days/yr
Wind risk 2/10 · Minimal
- Chance of severe wind over 30 yrs
- 2.0%
Air-quality risk 2/10 · Minimal
- Unhealthy air days now
- 0 days/yr
- Unhealthy air days in 30 yrs
- 1 days/yr
Risk factors via First Street. Map © Google.
Why this score? — see what drove the B grade
The composite is a weighted blend of 9 inputs, each scored 0–100. Each bar is that input's sub-score; the figure is the points it added to the 100-point composite (weight × sub-score).
- Cash flow +28.7/30.0
- DSCR +10.0/10.0
- ARV discount +7.5/15.0
- 1% rule +6.9/10.0
- Schools +5.2/10.0
- Appreciation +4.6/10.0
- Livability +3.9/5.0
- Rent growth +2.7/5.0
- Condition / age +2.5/5.0
$199,500
🖨 Deal sheet (PDF) 📄 Offer letter ✓ Due diligence
Listing remarks MLS
Built in 1905, this gem of a historic home offers a rare opportunity for those with a passion for preservation to restore a piece of Centerton’s past. This property is listed on the Arkansas Historical Homes Registry and is a cornerstone of old Centerton, where neighbors would walk by to share the news of the day. Located in the heart of Old Town Downtown Centerton, the property sits within a designated zoning area poised for revitalization in the coming years, making it an exceptional investment. The property has been unoccupied for several years and will require extensive repairs, ideal for a skilled renovator or investor to reimagine its original charm. Within one block you will discover the historic McKissick Springs, Marrs Mercantile, The Ravington, and City Park, making this property perfectly positioned in one of Centerton’s most evolving areas. Additionally, an incoming Walmart Supercenter will be minutes away. A rare chance to restore, reimagine, and contribute to the next chapter of Old Town Centerton.
Key facts
- 0.25 acre lot
- Built 1905
- Listed 14 days
Property features AI
Finance
- Other: Lot size approximately 0.25 acres
- Financial info: Annual tax amount available but omitted
- HOA & community: Association fees billed monthly
Exterior
- Parking: No parking details provided
- Security: No security features listed
- Utilities: Electricity available; Natural gas available; Public water; Public sewer
- Home design: 2-story home; Brick construction; Crawlspace foundation; Asphalt shingle roof; Built 25+ years ago
- Construction: Brick construction; Asphalt shingle roof; Crawlspace foundation; Approximately 25+ years old
- Exterior features: Gravel driveway; Lot is cleared and level; Located in a central business district; Public road frontage
Interior
- Kitchen: No kitchen appliance details provided
- Bedrooms: Bedroom count not specified
- Flooring: Concrete
- Bathrooms: 2 full bathrooms
- Heating & cooling: No heating or cooling details provided
- Interior features: Concrete flooring; No additional interior features specified
- Laundry & utility: No hot water (appliance note)
Neighborhood map
What this means for you Summary
Snapshot
- This is a 5-bed/2.0-bath single-family listed at $200k.
Deal economics
- At list price, monthly cash flow is $664 ($8k/yr) — positive.
- The deal already cash-flows at list — no discount required.
- Meets the 1% rule at list price ($2k rent vs $200k).
- Cap rate 10.3% vs local median 2.9% in Centerton — top-decile yield for the area; either an underpriced asset or a hidden risk that comps aren't pricing in. Stress-test before assuming the spread holds.
Location & tenants
- Location reads 77/100 on livability (#11 in AR, #3,194 nationally) — a middle-class / working-renter tenant base. Strengths: crime A+, employment A+, cost of living A+; Watch: amenities F, commute F.
- Bentonville School District (urban): math 59% / reading 59% proficiency, ranked #3 of 238 in AR (top 1%) — acceptable for families but not a draw, mixed tenant base, ~2y average lease.
- Market conditions: Rents flat; 458 active listings in the ZIP; 9 comparable units currently listed for rent nearby; rentals at typical pace (median 25d on market — plan ~3-4 weeks tenant-placement turnaround); high-income renter base; 4,359 units permitted in Benton County in 2024 (402 in 5+ unit buildings).
Forward outlook
- Local home prices are declining (-0.9%/yr); year-one equity from $1k of loan paydown is wiped out by about $2k of value loss. Plan a longer hold.
- Benton County population projected at +56% by 2050 — long-run rental-demand tailwind backs the buy-and-hold thesis.
- At projected returns (-0.9% appreciation + 0.6% rent growth), your $56k cash investment doubles in ~7 years — after that, you're playing with house money.
Negotiation context
- Only 14 days on market — expect competitive offers; lowballing is unlikely to land.
- 4 sale attempts with the ask held roughly flat each time — persistent listings suggest the price (not the market) is what's stuck; bring a comps-based counter.
- Current owner paid $160k; 25% above their basis — modest negotiation headroom, anchor on the comps not their cost.
Risks & watch-outs
- Watch-outs: built in 1905 — expect roof / HVAC / electrical / plumbing capex.
- Climate carrying-cost: moderate wildfire risk; extreme-heat days projected 7→21/yr by 2055 (HVAC capex compounding) — expect insurance premiums to compound above CPI over the hold.
Questions for the listing agent
- Built in 1905 — when were the roof, HVAC, electrical panel, plumbing, and water heater last replaced?
- Is there a deadline driving the sale (1031 exchange, divorce, estate, relocation)? That informs how much negotiation room exists.
- Schools are B-rated — typically a magnet for longer-tenancy family renters. What's the average tenant stay here, and is there a school-zone premium baked into asking?
- What's the average days-on-market for RENTAL listings here right now (not sales)? A rising rental-DOM trend means longer vacancies and softer asking-rent achievability than the comps imply.
- What's the recent tenant-quality profile in this submarket — average credit score on applications, eviction rate, late-payment / NSF rate, and stable-employment percentage? A property-management company in the area should have these aggregated.
- How much new for-sale + rental construction is in the pipeline within 1–3 miles? Heavy new supply typically softens prices + rents 12–24 months out; constrained supply supports both.
Investment metrics
- 1% rule
- 1.19% ✓
- Cap rate
- 10.29%
- Cash-on-cash
- 14.27%
- DSCR
- 1.64
- GRM
- 7.0
CMA / ARV
- ARV (on-the-fly)
- $481,745
- Comps found
- 12
Show comp detail 12 sales within ~0.75 mi
| Address | Dist | Beds/Ba | Sqft | Sold | Price | $/sf | Match |
|---|---|---|---|---|---|---|---|
| 116 Birch St | 0.59mi | 4/2.0 (-1) | 2,257 (-2%) | 3mo | $375,000 | $166 | 62 |
| 570 Bonanza St | 0.67mi | 4/3.5 (-1) | 2,239 (-3%) | 2mo | $385,000 | $172 | 51 |
| 1080 Garrett Ln | 0.69mi | 4/2.0 (-1) | 2,150 (-7%) | 3mo | $446,189 | $208 | 49 |
| 1091 Garrett Ln | 0.69mi | 4/3.0 (-1) | 2,410 (+5%) | 3mo | $505,680 | $210 | 48 |
| 1121 Garrett Ln | 0.73mi | 4/3.0 (-1) | 2,413 (+5%) | 1mo | $519,570 | $215 | 48 |
| 1120 Garrett Ln | 0.73mi | 4/2.0 (-1) | 2,150 (-7%) | 3mo | $449,463 | $209 | 47 |
| 210 Kristen Ln | 0.60mi | 5/3.0 | 2,575 (+12%) | 3mo | $542,364 | $211 | 46 |
| 1101 Garrett Ln | 0.71mi | 5/3.0 | 2,575 (+12%) | 2mo | $514,532 | $200 | 41 |
| 1081 Garrett Ln | 0.68mi | 5/3.0 | 2,575 (+12%) | 4mo | $551,426 | $214 | 41 |
| 1111 Garrett Ln | 0.72mi | 5/3.0 | 2,575 (+12%) | 3mo | $546,049 | $212 | 41 |
| 1071 Garrett Ln | 0.67mi | 4/2.0 (-1) | 1,962 (-15%) | 4mo | $410,689 | $209 | 36 |
| 241 Ryker Rdg | 0.68mi | 4/2.0 (-1) | 1,962 (-15%) | 3mo | $405,702 | $207 | 36 |
Match score weights: distance 35% · size 25% · config 20% · recency 20%. Top-matched comps best support the ARV.
Projected returns pro-forma
-0.87% appreciation · 0.64% rent growth · sell at horizon
- IRR
- 9.2%
- Equity multiple
- 1.41×
- Total profit
- $22,886
- Equity at exit
- $49,404
- IRR
- 13.5%
- Equity multiple
- 2.25×
- Total profit
- $70,029
- Equity at exit
- $52,948
Cash invested: $55,860 (down + closing). Projections, not guarantees.
Landlord ↔ Tenant lean methodology
- Overall (STATE)
- 92 Strongly Landlord-Friendly
- State Arkansas
- 92 Strongly Landlord-Friendly · R+14
- County
- — inherits STATE
- City
- — inherits STATE
ZIP-level market 72719
- Home prices YoY
- -0.3%
- Rents YoY
- 0.6%
- Active inventory
- 458
- Price-to-rent
- 7.0×
Monthly cashflow live
- Estimated rent
- $2,378 high interval (Pro) →
- Mortgage (P&I)
- −$1,046
- Tax from tax record
- −$85 /mo · $1,016/yr
- Insurance
- −$83
- HOA
- −$0
- Vacancy / Maint / Mgmt
- −$499
- Net cashflow
- $664
Break-even live
Sensitivity live
| Price | -10% $777 | -5% $721 | +0% $664 | +5% $608 | +10% $551 |
|---|---|---|---|---|---|
| Rent | -10% $477 | -5% $570 | +0% $664 | +5% $758 | +10% $852 |
| Rate | -1.0pp $765 | -0.5pp $715 | base $664 | +0.5pp $613 | +1.0pp $560 |
UW: 25.0% down · 7.5% · 30yr · 1.5% tax · 5.0% vac · 8.0% maint · 8.0% mgmt
Financing live
Cash to close
- Down payment
- $49,875
- Closing costs
- $5,985
- Reserves months
- —
- Total cash needed
- —
Loan-product check · same deal, 3 products live
Conventional
25% down · 7.5% · 30yr
- Down + closing
- —
- Monthly P&I
- —
- Monthly cashflow
- —
- DSCR
- —
- Eligible?
- —
Personal DTI + credit; lowest rate.
DSCR
20% down · 8.5% · 30yr
- Down + closing
- —
- Monthly P&I
- —
- Monthly cashflow
- —
- DSCR
- —
- Eligible?
- —
No personal income docs; deal must DSCR.
Hard money
10% down · 12.0% · 12mo
- Down + closing
- —
- Monthly P&I
- —
- Monthly cashflow
- —
- DSCR
- —
- Eligible?
- —
Short-term bridge; refi at stabilization.
Rent comps 9 comps
| Address | Beds | Baths | Sqft | Rent | $/sqft | DOM | Units | Dist |
|---|---|---|---|---|---|---|---|---|
| 320 Beasley Dr Centerton, AR | 4.0 | 2.0 | 1707 | $1,850 | $1.08 | 24d | 1 | 0.45mi |
| 301 Cisterna Dr Centerton, AR | 4.0 | 2.5 | 2162 | $2,400 | $1.11 | 24d | 1 | 0.64mi |
| 800 Venice St Centerton, AR | 4.0 | 3.0 | 1803 | $1,995 | $1.11 | 24d | 1 | 0.66mi |
| 1053 Tarah Knolls Cir Centerton, AR | 4.0 | 2.0 | 1880 | $2,090 | $1.11 | 24d | 1 | 0.89mi |
| 905 SW Loudon Dr Bentonville, AR | 4.0 | 2.0 | 1680 | $1,850 | $1.10 | 24d | 1 | 0.95mi |
| 441 Willow Dr Centerton, AR | 4.0 | 2.0 | 1903 | $2,395 | $1.26 | 24d | 1 | 1.24mi |
| 751 Bob Glen Cir Centerton, AR | 4.0 | 2.5 | 2232 | $2,400 | $1.08 | 22d | 1 | 1.24mi |
| 1041 Whistler St Bentonville, AR | 4.0 | 4.0 | 2900 | $2,900 | $1.00 | 15d | 1 | 1.25mi |
| 3401 SW Endearment St Bentonville, AR | 4.0 | 2.5 | 2065 | $2,000 | $0.97 | 24d | 1 | 1.44mi |
Listing history 12 events
-
2026-06-18days on market $199,500 Active 14 DOM
-
2026-06-17days on market $199,500 Active 13 DOM
-
2026-06-16days on market $199,500 Active 12 DOM
-
2026-06-15days on market $199,500 Active 11 DOM
-
2026-06-14days on market $199,500 Active 9 DOM
-
2026-06-10days on market $199,500 Active 6 DOM
-
2026-06-09days on market $199,500 Active 5 DOM
-
2026-06-08days on market $199,500 Active 4 DOM
-
2026-06-07remarks 394-char remark
-
2026-06-07days on market $199,500 Active 3 DOM
-
2026-06-05remarks 244-char remark
-
2026-06-05$199,500 Active 1 DOM
ⓘ Source: listings_history table (triggers on properties + properties_extension) + one-shot
backfill from property_details.listing_events for pre-trigger history.
Tax reassessment forecast AR · Resets to sale price
- Current annual tax
- $1,016 · $85/mo
- Projected year-2 tax
- $1,277 · $106/mo
- Expected delta
- +$260/yr (+$22/mo · 25.6%)
ⓘ Screening estimate from a state-policy table — verify with the county assessor before closing.
Climate risk First Street
- Flood 1/10 Low FEMA zone X (unshaded) · 0% chance over 30 yrs
- Wildfire 5/10 Major
- Heat 5/10 Major 7 d/yr ≥105°F today · 21 d/yr by 30 yrs out
- Wind 2/10 Low 2% chance of damaging wind over 30 yrs
- Air quality 2/10 Low 0 unhealthy d/yr today · 1 by 30 yrs out
Nearby sold comps map
Loading sold comps map…
Walkable amenities ~0.75 mi
Loading nearby amenities…
Taxation est. · year 1
- Rental income
- $28,533
- − Mortgage interest
- −$11,175
- − Property taxes
- −$1,016
- − Insurance
- −$998
- − Repairs & maintenance
- −$2,283
- − Management
- −$2,283
- − Depreciation
- −$5,804
- Taxable income
- $4,975
- Est. tax owed @ 24.0%
- −$1,194
- After-tax cash flow
- $6,779/yr
For passive investors: Depreciation is non-cash, so a rental often shows a tax loss while cash-flowing — sheltering income. Rental losses are passive: they offset passive income freely, and up to $25,000/yr can offset ordinary (W-2) income if you actively participate and your MAGI is under $100k (phasing out to $0 by $150k); unused losses carry forward. On sale, claimed depreciation is recaptured at up to 25%, and gains may owe capital-gains tax (a 1031 exchange can defer both). Figures are a year-1 estimate at your 24.0% rate — not tax advice; consult a CPA.
Schools (NCES district)
- District
- Bentonville School District
- NCES district ID
- 0503060
- Math proficiency
- 59% ▼ -8.00%
- Reading proficiency
- 59% ▼ -6.00%
- Median HH income
- $66,721
- Composite
- 51.85/100
- National rank
- #1661
- State rank
- #3 of 238 in AR
Livability — Centerton
- Score
- 77/100
- State rank
- #11
- US rank
- #3194
Category grades
Schools grade is shown separately in the Schools card above.
Census & demographics
- Census place
- Centerton, AR
- County
- Benton County · 259,241 people
- City population
- 19,701
- Metro
- Fayetteville-Springdale-Rogers, AR
- Population (ZIP)
- 19,701
- Household income
- $113,542
- Rent vs Own
- Severe rent burden
- 374.0
Population outlook (Benton County) Hauer SSP2
- Today (2025)
- 318,683 people
- By 2030
- 353,481 · +10.9%
- By 2040
- 425,280 · +33.4%
- By 2050
- 497,239 · +56.0%
- By 2075
- 662,114 · +107.8%
- By 2100
- 776,431 · +143.6%
Race, ethnicity, and origin ACS 2023
- Neighborhood character
- Diverse neighborhood (Simpson 0.64)
- Race & ethnicity
- White 58% Two or more races 25% Hispanic / Latino 14% Black 6% Asian 5%
- Hispanic origin (detail)
- Mexican 8% Cuban 2%
- Common ancestry
- Slovak 2% Italian 1% Lithuanian 1%
- Foreign-born
- 10% · Canada, Vietnam
- Languages at home
- 89% English-only · Spanish 9% Vietnamese 1% Other Asian/Pacific 1%
Political lean MEDSL · Benton
- 2024 margin
- Strong R (+27.0) · D 35.2% · R 62.1% · Other 2.7%
- 2008→2024 swing
- +9.6pp toward D · 2008: -36.5pp · 2024: -27.0pp
- All cycles
- 2024: R+27.0 2020: R+26.4 2016: R+34.9 2012: R+40.4 2008: R+36.5
Not yet ingested
- Civics
- —
Market trends
- HPI YoY
- ▼ -0.87%
- Current HPI
- 320.376
- Rent YoY
- ▲ 0.64%
- Metro
- Fayetteville-Springdale-Rogers, AR
- State GDP YoY
- ▲ 3.80%
- F500 in state
- 10
Industry mix (Fortune 500 HQ in AR)
| Industry | F500 HQs | Revenue |
|---|---|---|
| Retail | 1 | $681B |
|
||
| Food / Agriculture | 1 | $53B |
|
||
| Retail / Energy | 1 | $22B |
|
||
| Transportation / Logistics | 1 | $12B |
|
||
| Energy | 1 | $4B |
|
||
Price history
-0.2% since first listed10 events — show timeline
- 2026-06-04 Listed $199,500 NWARMLS
- 2026-04-23 Sold (Public Records) $160,000 Public Records
- 2026-04-21 Sold (MLS) $160,000 NWARMLS
- 2026-04-12 Pending — NWARMLS
- 2026-03-18 Relisted — NWARMLS
- 2026-03-18 Price Changed $190,000 NWARMLS
- 2026-03-08 Pending — NWARMLS
- 2026-02-18 Relisted — NWARMLS
- 2025-12-30 Pending — NWARMLS
- 2025-12-19 Listed $200,000 NWARMLS
Property tax history
+4.2%/yrLatest (2025): $1,016 · +10.6% YoY. Source: county tax records.
Cash-flow waterfall
monthlySold comps — $/sqft
last 12 mo · ≤1 miLoading sold comps…