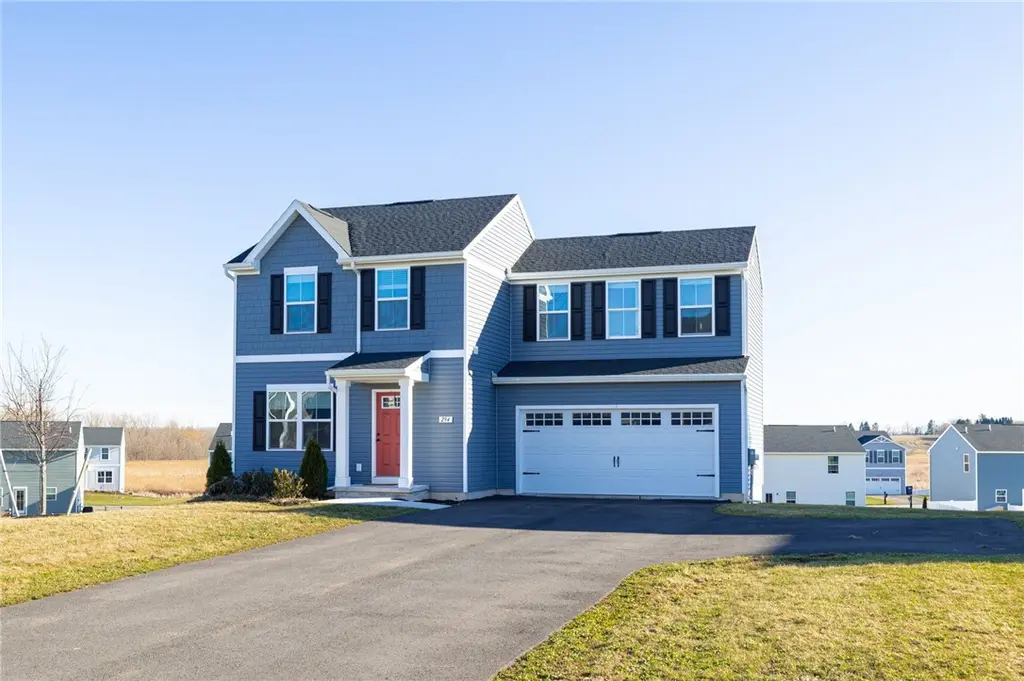
294 Mildahn Rd · Gananda, NY
Flood risk 1/10 · Minimal
- FEMA flood zone
- —
- Chance of flooding over 30 yrs
- 0.0%
- Est. flood insurance / yr
- —
Fire risk 3/10 · Minor
- Est. fire insurance / yr
- $691 – $1,283
Heat risk 2/10 · Minimal
- Hot days now (above 95°F)
- 7 days/yr
- Hot days in 30 yrs
- 16 days/yr
Wind risk 1/10 · Minimal
- Chance of severe wind over 30 yrs
- —
Air-quality risk 2/10 · Minimal
- Unhealthy air days now
- 1 days/yr
- Unhealthy air days in 30 yrs
- 1 days/yr
Risk factors via First Street. Map © Google.
Why this score? — see what drove the D+ grade
The composite is a weighted blend of 9 inputs, each scored 0–100. Each bar is that input's sub-score; the figure is the points it added to the 100-point composite (weight × sub-score).
- Cash flow +12.6/30.0
- ARV discount +10.9/15.0
- Schools +6.8/10.0
- Condition / age +4.0/5.0
- DSCR +3.8/10.0
- 1% rule +3.6/10.0
- Rent growth +2.5/5.0
- Livability +2.5/5.0
- Appreciation +0.0/10.0
$349,000
🖨 Deal sheet (PDF) 📄 Offer letter ✓ Due diligence
Listing remarks
Looking for a NEW build with less wait and less cost?! This 1.5 year old home in the PENFIELD school district offers 1,440 sq. ft. (sq footage per building plans) of pristine, move-in-ready living space. The sun-drenched main level features an open-concept great room that flows effortlessly into a modern kitchen and dining area boasting sleek white cabinetry, stainless steel appliances, and durable luxury vinyl flooring. Retreat upstairs to find three generous bedrooms, including a primary suite with a private en-suite bath and a spacious walk-in closet, plus the ultimate convenience of a dedicated second-floor laundry room. Situated on a 0.31-acre lot, the exterior features a blacktop turn
Key facts
- 0.31 acre lot
- 2 garage spots
- Built 2024
Property features AI
Exterior
- Parking: Attached garage; 2 garage spaces
- Utilities: Public water connected; Sewer connected
- Home design: Two-story existing home
- Construction: Frame construction with vinyl and wood siding; Asphalt roof; Block foundation; Full basement with walk-out access and sump pump
- Exterior features: Blacktop driveway; Rectangular residential lot (approx. 0.31 acres; 83 x 178); City street frontage
Interior
- Kitchen: Dishwasher; Electric oven; Electric range; Microwave; Refrigerator
- Bedrooms: Bedrooms located on upper level
- Flooring: Carpet; Luxury vinyl; Varied flooring types
- Bathrooms: 2 full bathrooms; 1 half bathroom; One main-level bathroom
- Heating & cooling: Gas forced-air heating; Programmable thermostat
- Interior features: Separate formal living room; Kitchen open to family room; Sliding glass doors; Bath in primary bedroom; Programmable thermostat
- Laundry & utility: Laundry on upper level; Gas water heater
Neighborhood map
What this means for you Summary
Snapshot
- This is a 3-bed/2.5-bath single-family listed at $349k. Condition is rated good.
Deal economics
- At list price, monthly cash flow is $-42 ($-502/yr) — negative.
- To cash-flow at today's rent, offer at most $343k (1.7% below list).
- To meet the 1% rule (rent ≥ 1% of price), the offer needs to be $300k (14.0% below list).
- Recommended offer: $300k (14.0% below list) — sets the bar for 1% rule.
- Cap rate 6.1% vs local median 3.2% in Gananda — top-decile yield for the area; either an underpriced asset or a hidden risk that comps aren't pricing in. Stress-test before assuming the spread holds.
Location & tenants
- Location reads: area grade D — affects rentability + tenant quality, not the cash-flow math above.
- Penfield Central School District (suburban): math 77% / reading 79% proficiency, ranked #67 of 590 in NY (top 11%) — strong family-tenant draw, lease renewals of 3-5y typical; only 11% free/reduced lunch — higher-income household profile.
- Zoned schools: Harris Hill Elementary School (math 87% / reading 87%, grade A+, #69 of 2,108 statewide, top 4%, 427 students, 16% FRL); Bay Trail Middle School (math 59% / reading 78%, grade A, #94 of 729 statewide, top 13%, 1,113 students, 23% FRL); Penfield Senior High School (math 98% / reading 72%, grade A, #369 of 1,100 statewide, top 34%, 1,424 students, 25% FRL).
- Market conditions: 49 active listings in the ZIP; 1 comparable units currently listed for rent nearby; 259 units permitted in Wayne County in 2024 (90 in 5+ unit buildings).
Forward outlook
- Local home prices are declining (-3.0%/yr); year-one equity from $2k of loan paydown is wiped out by about $10k of value loss. Plan a longer hold.
- Wayne County population projected at -24% by 2050 — secular population decline; favor cash flow + early exit over multi-decade hold.
Negotiation context
- It's been on market 35 days — a 3% lower offer ($339k) is reasonable based on typical stale-listing flexibility.
- 2 sale attempts with the ask held roughly flat each time — persistent listings suggest the price (not the market) is what's stuck; bring a comps-based counter.
Questions for the listing agent
- What do current leases actually rent for vs. the listed asking? Can we see a recent rent roll and the last 12 months of T-12 income?
- It's been on market 35 days. Have you received any prior offers? Is the seller open to a 14% concession, seller financing, or rate buy-down credit?
- Is there a deadline driving the sale (1031 exchange, divorce, estate, relocation)? That informs how much negotiation room exists.
- The area grade is low — what's the realistic commute time and amenity access for the typical tenant pool here? Any planned neighborhood developments (good or bad) we should know about?
- What's the average days-on-market for RENTAL listings here right now (not sales)? A rising rental-DOM trend means longer vacancies and softer asking-rent achievability than the comps imply.
- What's the recent tenant-quality profile in this submarket — average credit score on applications, eviction rate, late-payment / NSF rate, and stable-employment percentage? A property-management company in the area should have these aggregated.
- How much new for-sale + rental construction is in the pipeline within 1–3 miles? Heavy new supply typically softens prices + rents 12–24 months out; constrained supply supports both.
Investment metrics
- 1% rule
- 0.86% ✗
- Cap rate
- 6.15%
- Cash-on-cash
- -0.51%
- DSCR
- 0.98
- GRM
- 9.7
CMA / ARV
- ARV (median comp)
- $377,726
- List price
- $349,000
- Delta
- -7.60%
- Verdict
- FAIR
- Comps
- 20 within 1.0 mi
Show comp detail 11 sales within ~0.75 mi
| Address | Dist | Beds/Ba | Sqft | Sold | Price | $/sf | Match |
|---|---|---|---|---|---|---|---|
| 294 Mildahn Rd | 0.00mi | 3/2.5 | 1,440 (0%) | 1mo | $3,000 | $2 | 99 |
| 201 Plumegrass Run | 0.08mi | 3/2.5 | 1,463 (+2%) | 12mo | $340,000 | $232 | 83 |
| 441 Parkside Trl | 0.49mi | 3/2.5 | 1,556 (+8%) | 1mo | $412,500 | $265 | 63 |
| 365 Highfield Dr | 0.38mi | 3/1.5 | 1,476 (+2%) | 23mo | $271,500 | $184 | 55 |
| 562 Crows Nest Ln | 0.56mi | 3/1.0 | 1,560 (+8%) | 1mo | $338,000 | $217 | 53 |
| 3504 Scenic Way | 0.53mi | 3/3.5 | 1,578 (+10%) | 4mo | $355,000 | $225 | 52 |
| 361 Rt-441 | 0.56mi | 3/1.0 | 1,421 (-1%) | 18mo | $213,000 | $150 | 50 |
| 573 Beaver Creek Rd | 0.74mi | 3/1.5 | 1,560 (+8%) | 8mo | $302,000 | $194 | 41 |
| 447 Walworth Penfield Rd | 0.69mi | 3/1.5 | 1,364 (-5%) | 21mo | $250,000 | $183 | 38 |
| 605 Smugglers Cv | 0.73mi | 4/3.0 (+1) | 1,467 (+2%) | 23mo | $300,000 | $204 | 37 |
| 3693 Stalker Rd | 0.70mi | 3/2.5 | 1,640 (+14%) | 9mo | $299,900 | $183 | 36 |
Match score weights: distance 35% · size 25% · config 20% · recency 20%. Top-matched comps best support the ARV.
Projected returns pro-forma
-3.0% appreciation · 3.0% rent growth · sell at horizon
- IRR
- -17.1%
- Equity multiple
- 0.39×
- Total profit
- $-59,174
- Equity at exit
- $52,037
- IRR
- -9.0%
- Equity multiple
- 0.44×
- Total profit
- $-54,777
- Equity at exit
- $30,175
Cash invested: $97,720 (down + closing). Projections, not guarantees.
Landlord ↔ Tenant lean methodology
- Overall (STATE)
- 15 Strongly Tenant-Friendly
- State New York
- 15 Strongly Tenant-Friendly · D+10
- County
- — inherits STATE
- City
- — inherits STATE
ZIP-level market 14502
- Home prices YoY
- -26.0%
- Active inventory
- 49
- Price-to-rent
- 9.7×
Monthly cashflow live
- Estimated rent
- $3,000 medium interval (Pro) →
- Mortgage (P&I)
- −$1,830
- Tax est. 1.5%
- −$436 /mo · $5,235/yr
- Insurance
- −$145
- HOA
- −$0
- Vacancy / Maint / Mgmt
- −$630
- Net cashflow
- $-42
Break-even live
Sensitivity live
| Price | -10% $199 | -5% $79 | +0% $-42 | +5% $-162 | +10% $-283 |
|---|---|---|---|---|---|
| Rent | -10% $-279 | -5% $-160 | +0% $-42 | +5% $77 | +10% $195 |
| Rate | -1.0pp $134 | -0.5pp $47 | base $-42 | +0.5pp $-132 | +1.0pp $-224 |
UW: 25.0% down · 7.5% · 30yr · 1.5% tax · 5.0% vac · 8.0% maint · 8.0% mgmt
Financing live
Cash to close
- Down payment
- $87,250
- Closing costs
- $10,470
- Reserves months
- —
- Total cash needed
- —
Loan-product check · same deal, 3 products live
Conventional
25% down · 7.5% · 30yr
- Down + closing
- —
- Monthly P&I
- —
- Monthly cashflow
- —
- DSCR
- —
- Eligible?
- —
Personal DTI + credit; lowest rate.
DSCR
20% down · 8.5% · 30yr
- Down + closing
- —
- Monthly P&I
- —
- Monthly cashflow
- —
- DSCR
- —
- Eligible?
- —
No personal income docs; deal must DSCR.
Hard money
10% down · 12.0% · 12mo
- Down + closing
- —
- Monthly P&I
- —
- Monthly cashflow
- —
- DSCR
- —
- Eligible?
- —
Short-term bridge; refi at stabilization.
Rent comps 1 comps
| Address | Beds | Baths | Sqft | Rent | $/sqft | DOM | Units | Dist |
|---|---|---|---|---|---|---|---|---|
| 294 Mildahn Rd Walworth, NY | 3.0 | 2.5 | 1440 | $3,000 | $2.08 | 20d | 1 | 0.01mi |
Listing history 10 events
-
2026-06-03days on market $349,000 Active 35 DOM
-
2026-06-03days on market $349,000 Active 34 DOM
-
2026-06-01days on market $349,000 Active 33 DOM
-
2026-05-31days on market $349,000 Active 32 DOM
-
2026-04-29$349,900 Active 997-char remark
-
2026-04-01historical
-
2026-03-29historical
-
2026-03-29historical
-
2026-03-18price $369,500
-
2026-03-09$369,900 Active
ⓘ Source: listings_history table (triggers on properties + properties_extension) + one-shot
backfill from property_details.listing_events for pre-trigger history.
Climate risk First Street
- Flood 1/10 Low 0% chance over 30 yrs
- Wildfire 3/10 Moderate
- Heat 2/10 Low 7 d/yr ≥95°F today · 16 d/yr by 30 yrs out
- Wind 1/10 Low
- Air quality 2/10 Low 1 unhealthy d/yr today · 1 by 30 yrs out
Nearby sold comps map
Loading sold comps map…
Walkable amenities ~0.75 mi
Loading nearby amenities…
Taxation est. · year 1
- Rental income
- $36,000
- − Mortgage interest
- −$19,549
- − Property taxes
- −$5,235
- − Insurance
- −$1,745
- − Repairs & maintenance
- −$2,880
- − Management
- −$2,880
- − Depreciation
- −$10,153
- Taxable loss
- −$6,442
- Est. tax savings @ 24.0%
- +$1,546
- After-tax cash flow
- $1,044/yr
For passive investors: Depreciation is non-cash, so a rental often shows a tax loss while cash-flowing — sheltering income. Rental losses are passive: they offset passive income freely, and up to $25,000/yr can offset ordinary (W-2) income if you actively participate and your MAGI is under $100k (phasing out to $0 by $150k); unused losses carry forward. On sale, claimed depreciation is recaptured at up to 25%, and gains may owe capital-gains tax (a 1031 exchange can defer both). Figures are a year-1 estimate at your 24.0% rate — not tax advice; consult a CPA.
Condition & rehab AI · 1 photo
This 1.5-year-old home in the Penfield school district is move-in ready with good condition and minimal maintenance required. It offers a good ROI with updates focusing on curb appeal and interior aesthetics.
Value-add opportunities
- Both Painting exterior and interior — Fresh paint enhances curb appeal and interior aesthetics
- Both Landscaping improvements — Enhances curb appeal and adds value
- Resale Kitchen appliances maintenance — Keeps appliances in top condition for potential buyers
Renovation cost estimate screening
Value-add ROI direction
- Both Painting exterior and interior — Fresh paint enhances curb appeal and interior aesthetics ↑
- Both Landscaping improvements — Enhances curb appeal and adds value ↑
- Resale Kitchen appliances maintenance — Keeps appliances in top condition for potential buyers ↑
ⓘ Cost ranges are severity-bucket heuristics (US national rule-of-thumb). Get contractor quotes + a written scope before underwriting a rehab budget.
Schools (NCES district)
- District
- Penfield Central School District
- NCES district ID
- 3622710
- Math proficiency
- 77% ▼ -3.00%
- Reading proficiency
- 79% ▲ 10.00%
- Median HH income
- $74,802
- Composite
- 68.37/100
- National rank
- #347
- State rank
- #67 of 590 in NY
Livability — Gananda
No livability data for this city. (Only ~50 U.S. cities are tracked.)
Census & demographics
- Census place
- Gananda, NY
- Population (ZIP)
- 10,515
Population outlook (Wayne County) Hauer SSP2
- Today (2025)
- 85,662 people
- By 2030
- 81,945 · -4.3%
- By 2040
- 73,735 · -13.9%
- By 2050
- 65,029 · -24.1%
- By 2075
- 47,451 · -44.6%
- By 2100
- 31,574 · -63.1%
Race, ethnicity, and origin ACS 2023
- Neighborhood character
- Predominantly White (88%)
- Race & ethnicity
- White 88% Two or more races 6% Asian 3% Black 1% Hispanic / Latino 1%
- Common ancestry
- Iranian 8% Romanian 7% Lithuanian 3%
- Foreign-born
- 4% · China, South Korea
- Languages at home
- 94% English-only · Russian/Polish/Slavic 2% Other Indo-European 2% Chinese 1%
Political lean MEDSL · Wayne
- 2024 margin
- Strong R (+23.1) · D 38.5% · R 61.5%
- 2008→2024 swing
- -13.2pp toward R · 2008: -9.9pp · 2024: -23.1pp
- All cycles
- 2024: R+23.1 2020: R+19.6 2016: R+26.1 2012: R+9.3 2008: R+9.9
Not yet ingested
- Civics
- —
Market trends
- HPI YoY
- ▼ -85.25%
- Current HPI
- 242.5682
- Rent YoY
- —
- Metro
- —
- State GDP YoY
- ▲ 2.60%
- F500 in state
- 92
Industry mix (Fortune 500 HQ in NY)
| Industry | F500 HQs | Revenue |
|---|---|---|
| Financial Services | 10 | $950B |
|
||
| Consumer Goods | 9 | $162B |
|
||
| Insurance | 4 | $225B |
|
||
| Telecommunications | 2 | $144B |
|
||
| Pharmaceuticals | 2 | $112B |
|
||
| Media / Entertainment | 2 | $69B |
|
||
Price history
-5.7% since first listed7 events — show timeline
- 2026-05-24 Price Changed $349,000 UNYREIS
- 2026-04-29 Listed $349,900 UNYREIS
- 2026-04-01 Listing Removed — UNYREIS
- 2026-03-29 Listing Removed — UNYREIS
- 2026-03-29 Listing Removed — UNYREIS
- 2026-03-18 Price Changed $369,500 UNYREIS
- 2026-03-09 Listed $369,900 UNYREIS
Cash-flow waterfall
monthlySold comps — $/sqft
last 12 mo · ≤1 miLoading sold comps…