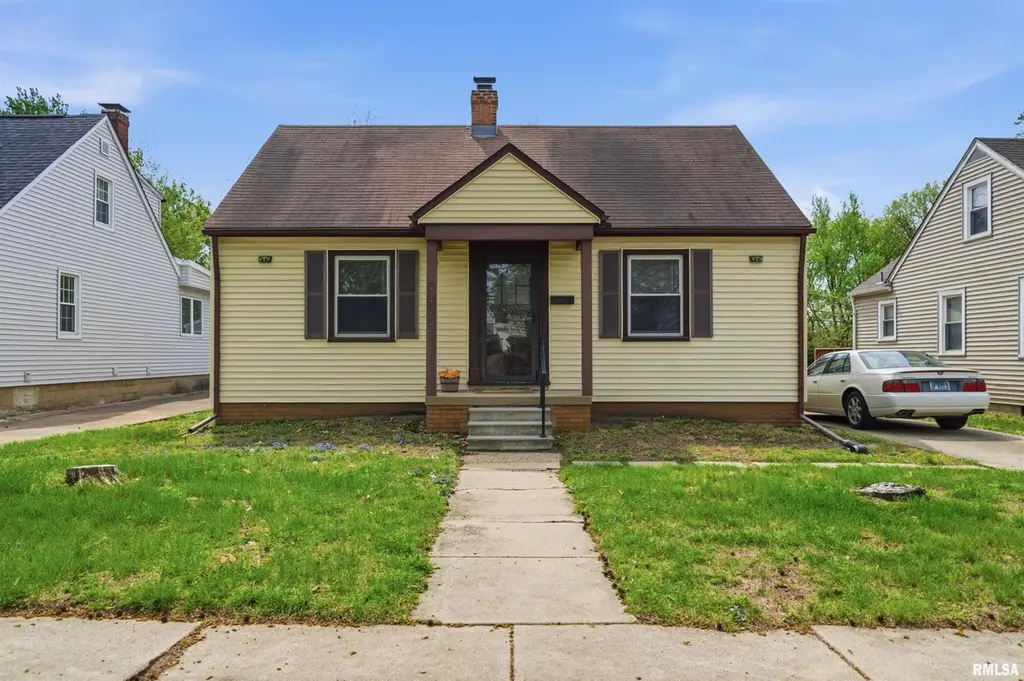
1514 W Margaret Ave · Peoria, IL
Flood risk 1/10 · Minimal
- FEMA flood zone
- X
- Chance of flooding over 30 yrs
- 0.0%
- Est. flood insurance / yr
- $473 – $860
Fire risk 1/10 · Minimal
- Est. fire insurance / yr
- $804 – $1,492
Heat risk 3/10 · Minor
- Hot days now (above 105°F)
- 7 days/yr
- Hot days in 30 yrs
- 18 days/yr
Wind risk 2/10 · Minimal
- Chance of severe wind over 30 yrs
- 1.0%
Air-quality risk 3/10 · Minor
- Unhealthy air days now
- 1 days/yr
- Unhealthy air days in 30 yrs
- 3 days/yr
Risk factors via First Street. Map © Google.
Why this score? — see what drove the C- grade
The composite is a weighted blend of 9 inputs, each scored 0–100. Each bar is that input's sub-score; the figure is the points it added to the 100-point composite (weight × sub-score).
- Cash flow +21.9/30.0
- ARV discount +7.5/15.0
- DSCR +7.0/10.0
- 1% rule +5.0/10.0
- Livability +3.7/5.0
- Rent growth +3.1/5.0
- Condition / age +2.5/5.0
- Schools +1.1/10.0
- Appreciation +0.0/10.0
$110,000
🖨 Deal sheet (PDF) 📄 Offer letter ✓ Due diligence
Listing remarks MLS
Wonderfully maintained 2 bedroom bungalow. Beautiful hardwood flooring, crown molding, & neutral decor throughout. Basement features a family room, den/office area, laundry room, & lots of storage. Relax in spacious fenced private backyard with nice patio. Centrally located for shopping, colleges, restaurants and hospitals. Appliances stay as-is, no warranty. 24 hour notice for all showings.
Key facts
- 0.25 acre lot
- Garage
- Built 1941
Neighborhood map
What this means for you Summary
Snapshot
- This is a 2-bed/1.0-bath single-family listed at $110k.
Deal economics
- At list price, monthly cash flow is $173 ($2k/yr) — positive.
- The deal already cash-flows at list — no discount required.
- To meet the 1% rule (rent ≥ 1% of price), the offer needs to be $110k (0.4% below list).
- Recommended offer: $110k (0.4% below list) — sets the bar for 1% rule.
- Cap rate 8.2% vs local median 5.5% in Peoria — top-decile yield for the area; either an underpriced asset or a hidden risk that comps aren't pricing in. Stress-test before assuming the spread holds.
Location & tenants
- Location reads 73/100 on livability (#270 in IL) — a middle-class / working-renter tenant base. Strengths: commute A+, cost of living A+, housing A+; Watch: employment D+, crime F.
- Peoria SD 150 (urban): math 11% / reading 14% proficiency, ranked #554 of 620 in IL (top 89%) — low school quality limits family demand, transient renter base, plan for 1-2y turnover; 70% free/reduced lunch — lower-income household profile, screen leases tightly.
- Zoned schools: Valeska Hinton Early Ch Ed Ctr (495 students, 0% FRL); Sterling Middle School (math 0% / reading 4%, grade F, #664 of 665 statewide, top 100%, 385 students, 0% FRL); Peoria High School (math 4% / reading 7%, grade F, #609 of 693 statewide, top 88%, 1,447 students, 0% FRL) — zoned schools average 0% FRL vs 70% district-wide (70 pts lower); this property's tenant base skews higher-income than the district average.
- Market conditions: Rents rising (+2.3%/yr); 181 active listings in the ZIP; 21 comparable units currently listed for rent nearby; rentals at typical pace (median 24d on market — plan ~3-4 weeks tenant-placement turnaround); 73 units permitted in Peoria County in 2024 (0 in 5+ unit buildings).
Forward outlook
- Local home prices are declining (-3.0%/yr); year-one equity from $761 of loan paydown is wiped out by about $3k of value loss. Plan a longer hold.
- Peoria County population projected at -11% by 2050 — secular population decline; favor cash flow + early exit over multi-decade hold.
Negotiation context
- Only 1 days on market — expect competitive offers; lowballing is unlikely to land.
- 3 sale attempts since 21y ago with the ask held roughly flat each time — persistent listings suggest the price (not the market) is what's stuck; bring a comps-based counter.
- Current owner paid $80k; 38% above their basis — modest negotiation headroom, anchor on the comps not their cost.
Risks & watch-outs
- Watch-outs: built in 1941 — expect roof / HVAC / electrical / plumbing capex.
Questions for the listing agent
- Built in 1941 — when were the roof, HVAC, electrical panel, plumbing, and water heater last replaced?
- Is there a deadline driving the sale (1031 exchange, divorce, estate, relocation)? That informs how much negotiation room exists.
- Schools are F-rated, which usually means shorter tenancies and higher turnover. Who's the typical renter profile here, and what's been the actual vacancy rate?
- Crime grade is F in this area — have there been break-ins, vandalism, or insurance claims at this property in the last 3 years? What carrier currently insures it and at what premium?
- What's the average days-on-market for RENTAL listings here right now (not sales)? A rising rental-DOM trend means longer vacancies and softer asking-rent achievability than the comps imply.
- What's the recent tenant-quality profile in this submarket — average credit score on applications, eviction rate, late-payment / NSF rate, and stable-employment percentage? A property-management company in the area should have these aggregated.
- How much new for-sale + rental construction is in the pipeline within 1–3 miles? Heavy new supply typically softens prices + rents 12–24 months out; constrained supply supports both.
Investment metrics
- 1% rule
- 1.00% ✗
- Cap rate
- 8.17%
- Cash-on-cash
- 6.72%
- DSCR
- 1.30
- GRM
- 8.4
CMA / ARV
- ARV (on-the-fly)
- $68,160
- Comps found
- 12
Show comp detail 12 sales within ~0.75 mi
| Address | Dist | Beds/Ba | Sqft | Sold | Price | $/sf | Match |
|---|---|---|---|---|---|---|---|
| 1419 W Margaret Ave | 0.08mi | 2/1.0 | 936 (+10%) | 1mo | $113,000 | $121 | 79 |
| 1126 W Gilbert Ave | 0.31mi | 2/1.0 | 878 (+3%) | 2mo | $89,900 | $102 | 79 |
| 1017 W Gilbert Ave | 0.42mi | 2/1.0 | 816 (-4%) | 2mo | $20,000 | $25 | 72 |
| 2212 W Dennis Ct | 0.58mi | 2/1.0 | 864 (+1%) | 0mo | $47,000 | $54 | 70 |
| 1214 W Brons Ave | 0.72mi | 2/1.0 | 864 (+1%) | 2mo | $34,900 | $40 | 63 |
| 1131 W Nowland Ave | 0.59mi | 1/1.0 (-1) | 880 (+3%) | 1mo | $53,500 | $61 | 61 |
| 1417 W Mcclure Ave | 0.38mi | 2/1.0 | 947 (+11%) | 3mo | $119,075 | $126 | 61 |
| 3023 N Golf Dr | 0.57mi | 2/1.0 | 954 (+12%) | 4mo | $79,000 | $83 | 50 |
| 910 W Virginia Ave | 0.61mi | 2/1.0 | 748 (-12%) | 3mo | $60,000 | $80 | 49 |
| 1126 Thrush Ave | 0.67mi | 2/1.0 | 952 (+12%) | 1mo | $62,500 | $66 | 48 |
| 804 W Maywood Ave | 0.62mi | 3/1.0 (+1) | 973 (+14%) | 1mo | $134,000 | $138 | 42 |
| 1022 W Thrush Ave | 0.72mi | 3/1.0 (+1) | 946 (+11%) | 4mo | $72,000 | $76 | 40 |
Match score weights: distance 35% · size 25% · config 20% · recency 20%. Top-matched comps best support the ARV.
Projected returns pro-forma
-3.0% appreciation · 2.3% rent growth · sell at horizon
- IRR
- -6.7%
- Equity multiple
- 0.75×
- Total profit
- $-7,629
- Equity at exit
- $16,401
- IRR
- 2.0%
- Equity multiple
- 1.14×
- Total profit
- $4,303
- Equity at exit
- $9,511
Cash invested: $30,800 (down + closing). Projections, not guarantees.
Landlord ↔ Tenant lean methodology
- Overall (STATE)
- 43 Moderately Tenant-Leaning
- State Illinois
- 43 Moderately Tenant-Leaning · D+7
- County
- — inherits STATE
- City
- — inherits STATE
ZIP-level market 61604
- Home prices YoY
- -24.6%
- Rents YoY
- 2.3%
- Active inventory
- 181
- Price-to-rent
- 8.4×
Monthly cashflow live
- Estimated rent
- $1,096 high interval (Pro) →
- Mortgage (P&I)
- −$577
- Tax from tax record
- −$71 /mo · $847/yr
- Insurance
- −$46
- HOA
- −$0
- Lot rent
- −$0
- Vacancy / Maint / Mgmt
- −$230
- Net cashflow
- $173
Break-even live
Sensitivity live
| Price | -10% $235 | -5% $204 | +0% $173 | +5% $141 | +10% $110 |
|---|---|---|---|---|---|
| Rent | -10% $86 | -5% $129 | +0% $173 | +5% $216 | +10% $259 |
| Rate | -1.0pp $228 | -0.5pp $200 | base $173 | +0.5pp $144 | +1.0pp $115 |
UW: 25.0% down · 7.5% · 30yr · 1.5% tax · 5.0% vac · 8.0% maint · 8.0% mgmt
Financing live
Cash to close
- Down payment
- $27,500
- Closing costs
- $3,300
- Reserves months
- —
- Total cash needed
- —
Loan-product check · same deal, 3 products live
Conventional
25% down · 7.5% · 30yr
- Down + closing
- —
- Monthly P&I
- —
- Monthly cashflow
- —
- DSCR
- —
- Eligible?
- —
Personal DTI + credit; lowest rate.
DSCR
20% down · 8.5% · 30yr
- Down + closing
- —
- Monthly P&I
- —
- Monthly cashflow
- —
- DSCR
- —
- Eligible?
- —
No personal income docs; deal must DSCR.
Hard money
10% down · 12.0% · 12mo
- Down + closing
- —
- Monthly P&I
- —
- Monthly cashflow
- —
- DSCR
- —
- Eligible?
- —
Short-term bridge; refi at stabilization.
Rent comps 21 comps
| Address | Beds | Baths | Sqft | Rent | $/sqft | DOM | Units | Dist |
|---|---|---|---|---|---|---|---|---|
| 3108 N Parish Ave Peoria, IL | 3.0 | 1.5 | 967 | $1,750 | $1.81 | 46d | 1 | 0.41mi |
| 2214 N Linsley St Peoria, IL | 2.0 | 1.0 | 575 | $550 | $0.96 | 46d | 1 | 0.74mi |
| 3629 N Leroy Ave Unit A Peoria, IL | 2.0 | 1.0 | 1000 | $1,150 | $1.15 | 46d | 1 | 0.77mi |
| 812 W Macqueen Ave Peoria, IL | 2.0 | 1.0 | 822 | $795 | $0.97 | 46d | 1 | 0.78mi |
| 2610 N Renwood Ave Peoria, IL | 2.0 | 1.0 | 904 | $1,300 | $1.44 | 16d | 1 | 0.78mi |
| 905 W Thrush Ave Peoria, IL | 2.0 | 1.0 | 750 | $950 | $1.27 | 23d | 1 | 0.80mi |
| 2920 N Rockwood Dr Apt B Peoria, IL | 2.0 | 1.0 | 800 | $895 | $1.12 | 16d | 1 | 0.81mi |
| 2511 W Wardcliffe Dr Unit H Peoria, IL | 2.0 | 1.0 | 800 | $875 | $1.09 | 46d | 1 | 0.83mi |
| 2023 N Underhill St Peoria, IL | 3.0 | 1.0 | 1050 | $1,200 | $1.14 | 16d | 1 | 0.83mi |
| 903 W Brons Ave Peoria, IL | 3.0 | 1.0 | 971 | $995 | $1.02 | 46d | 1 | 0.85mi |
| 4010 N Brandywine Dr Peoria, IL | 1.0–2.0 | 1.0–2.0 | 797 | $1,082 | $1.36 | 16d | 17 | 0.86mi |
| 2700 W Forrest Hill Ave Peoria, IL | 2.0 | 1.0 | 850 | $850 | $1.00 | 46d | 1 | 0.96mi |
| 4020 N Bryer Pl Peoria, IL | 2.0 | 1.0 | 720 | $1,250 | $1.74 | 23d | 1 | 1.00mi |
| 2207 N Ellis St Peoria, IL | 2.0 | 1.0 | 864 | $999 | $1.16 | 16d | 1 | 1.00mi |
| W Crestwood Dr Peoria, IL | 1.0–2.0 | 1.0 | 800 | $975 | $1.22 | 16d | 4 | 1.02mi |
| 811 W Purtscher Dr Peoria, IL | 3.0 | 1.0 | 864 | $1,100 | $1.27 | 46d | 1 | 1.07mi |
| 1703 N Valley Ave Peoria, IL | 2.0 | 1.0 | 676 | $1,200 | $1.78 | 16d | 1 | 1.13mi |
| 2805 W Larchmont Ln Peoria, IL | 1.0–2.0 | 1.0 | 695 | $1,060 | $1.53 | 16d | 3 | 1.33mi |
| 3601 N Kingston Dr Peoria, IL | 2.0 | 2.0 | 1030 | $1,420 | $1.38 | 16d | 3 | 1.37mi |
| 1801 N Gentry Ln West Peoria, IL | 3.0 | 1.0 | 1000 | $1,650 | $1.65 | 16d | 1 | 1.44mi |
| 1308 W Covington Ct Peoria, IL | 2.0 | 1.5 | 975 | $1,170 | $1.20 | 23d | 1 | 1.49mi |
Listing history 10 events
-
2026-04-23status Pending
-
2026-04-22$110,000 Active
-
2026-04-20historical $110,000
-
2020-05-14soldstatus $79,500
-
2020-05-08soldstatus $79,500 406-char remark
Show marketing remark (406 chars)
Wonderfully maintained 2 bedroom bungalow. Beautiful hardwood flooring, crown molding, & neutral decor throughout. Basement features a family room, den/office area, laundry room, & lots of storage. Relax in spacious fenced private backyard with nice patio. Centrally located for shopping, colleges, restaurants and hospitals. Appliances stay as-is, no warranty. 24 hour notice for all showings.
-
2019-05-28$81,900 406-char remark
Show marketing remark (406 chars)
Wonderfully maintained 2 bedroom bungalow. Beautiful hardwood flooring, crown molding, & neutral decor throughout. Basement features a family room, den/office area, laundry room, & lots of storage. Relax in spacious fenced private backyard with nice patio. Centrally located for shopping, colleges, restaurants and hospitals. Appliances stay as-is, no warranty. 24 hour notice for all showings.
-
2005-06-22soldstatus $76,000
-
2005-06-17soldstatus $75,900 66-char remark
Show marketing remark (66 chars)
CUTE AS A BUTTON. WELL MAINTAINED CONVENIENTLY LOCATED. MUST SEE!!
-
2005-05-17$79,900 66-char remark
Show marketing remark (66 chars)
CUTE AS A BUTTON. WELL MAINTAINED CONVENIENTLY LOCATED. MUST SEE!!
-
2005-04-20soldstatus $86,500
ⓘ Source: listings_history table (triggers on properties + properties_extension) + one-shot
backfill from property_details.listing_events for pre-trigger history.
Tax reassessment forecast IL · Partial reset (capped growth)
- Current annual tax
- $847 · $71/mo
- Projected year-2 tax
- $1,672 · $139/mo
- Expected delta
- +$825/yr (+$69/mo · 97.5%)
ⓘ Screening estimate from a state-policy table — verify with the county assessor before closing.
Climate risk First Street
- Flood 1/10 Low FEMA zone X · 0% chance over 30 yrs
- Wildfire 1/10 Low
- Heat 3/10 Moderate 7 d/yr ≥105°F today · 18 d/yr by 30 yrs out
- Wind 2/10 Low 100% chance of damaging wind over 30 yrs
- Air quality 3/10 Moderate 1 unhealthy d/yr today · 3 by 30 yrs out
Nearby sold comps map
Loading sold comps map…
Walkable amenities ~0.75 mi
Loading nearby amenities…
Taxation est. · year 1
- Rental income
- $13,151
- − Mortgage interest
- −$6,162
- − Property taxes
- −$847
- − Insurance
- −$550
- − Repairs & maintenance
- −$1,052
- − Management
- −$1,052
- − Depreciation
- −$3,200
- Taxable income
- $288
- Est. tax owed @ 24.0%
- −$69
- After-tax cash flow
- $2,001/yr
For passive investors: Depreciation is non-cash, so a rental often shows a tax loss while cash-flowing — sheltering income. Rental losses are passive: they offset passive income freely, and up to $25,000/yr can offset ordinary (W-2) income if you actively participate and your MAGI is under $100k (phasing out to $0 by $150k); unused losses carry forward. On sale, claimed depreciation is recaptured at up to 25%, and gains may owe capital-gains tax (a 1031 exchange can defer both). Figures are a year-1 estimate at your 24.0% rate — not tax advice; consult a CPA.
Schools (NCES district)
- District
- Peoria SD 150
- NCES district ID
- 1731230
- Math proficiency
- 11% ▼ -5.00%
- Reading proficiency
- 14% ▼ -4.00%
- Median HH income
- $41,951
- Composite
- 10.92/100
- National rank
- #9751
- State rank
- #554 of 620 in IL
Livability — Peoria
- Score
- 73/100
- State rank
- #270
- US rank
- #5096
Category grades
Schools grade is shown separately in the Schools card above.
Census & demographics
- Census place
- Peoria, IL
- County
- Peoria County · 120,495 people
- City population
- 114,670
- Metro
- Peoria, IL
- Population (ZIP)
- 28,313
- Household income
- $52,414
- Rent vs Own
- Severe rent burden
- 815.0
Population outlook (Peoria County) Hauer SSP2
- Today (2025)
- 183,007 people
- By 2030
- 179,643 · -1.8%
- By 2040
- 171,782 · -6.1%
- By 2050
- 163,508 · -10.7%
- By 2075
- 140,178 · -23.4%
- By 2100
- 114,493 · -37.4%
Race, ethnicity, and origin ACS 2023
- Neighborhood character
- Diverse neighborhood (Simpson 0.61)
- Race & ethnicity
- White 55% Black 29% Two or more races 10% Hispanic / Latino 7% Asian 2%
- Hispanic origin (detail)
- Mexican 5%
- Common ancestry
- Italian 2% Slovak 1% Iranian 1%
- Foreign-born
- 6% · Canada, China
- Languages at home
- 92% English-only · Spanish 4% Chinese 1% French/Haitian/Cajun 1%
Political lean MEDSL · Peoria
- 2024 margin
- Toss-up / Even · D 51.5% · R 46.9% · Other 1.6%
- 2008→2024 swing
- -9.2pp toward R · 2008: 13.9pp · 2024: 4.7pp
- All cycles
- 2024: D+4.7 2020: D+6.3 2016: D+2.8 2012: D+4.4 2008: D+13.9
Not yet ingested
- Civics
- —
Market trends
- HPI YoY
- ▼ -54.15%
- Current HPI
- 165.8838
- Rent YoY
- ▲ 2.30%
- Metro
- Peoria, IL
- State GDP YoY
- ▲ 1.59%
- F500 in state
- 60
Industry mix (Fortune 500 HQ in IL)
| Industry | F500 HQs | Revenue |
|---|---|---|
| Insurance | 4 | $201B |
|
||
| Consumer Goods | 4 | $87B |
|
||
| Industrial Machinery | 3 | $64B |
|
||
| Healthcare | 2 | $55B |
|
||
| Retail / Pharmacy | 1 | $148B |
|
||
| Agriculture / Food | 1 | $86B |
|
||
Price history
+27.2% since first listed10 events — show timeline
- 2026-04-23 Pending — RMLSA as Distributed by MLS Grid
- 2026-04-22 Listed $110,000 RMLSA as Distributed by MLS Grid
- 2026-04-20 Coming Soon $110,000 RMLSA as Distributed by MLS Grid
- 2020-05-14 Sold (Public Records) $79,500 Public Records
- 2020-05-08 Sold (MLS) $79,500 RMLSA as Distributed by MLS Grid
- 2019-05-28 Listed $81,900 RMLSA as Distributed by MLS Grid
- 2005-06-22 Sold (Public Records) $76,000 Public Records
- 2005-06-17 Sold (MLS) $75,900 RMLSA as Distributed by MLS Grid
- 2005-05-17 Listed $79,900 RMLSA as Distributed by MLS Grid
- 2005-04-20 Sold (Public Records) $86,500 Public Records
Property tax history
-5.9%/yrLatest (2024): $847 · -3.9% YoY. Source: county tax records.
Cash-flow waterfall
monthlySold comps — $/sqft
last 12 mo · ≤1 miLoading sold comps…