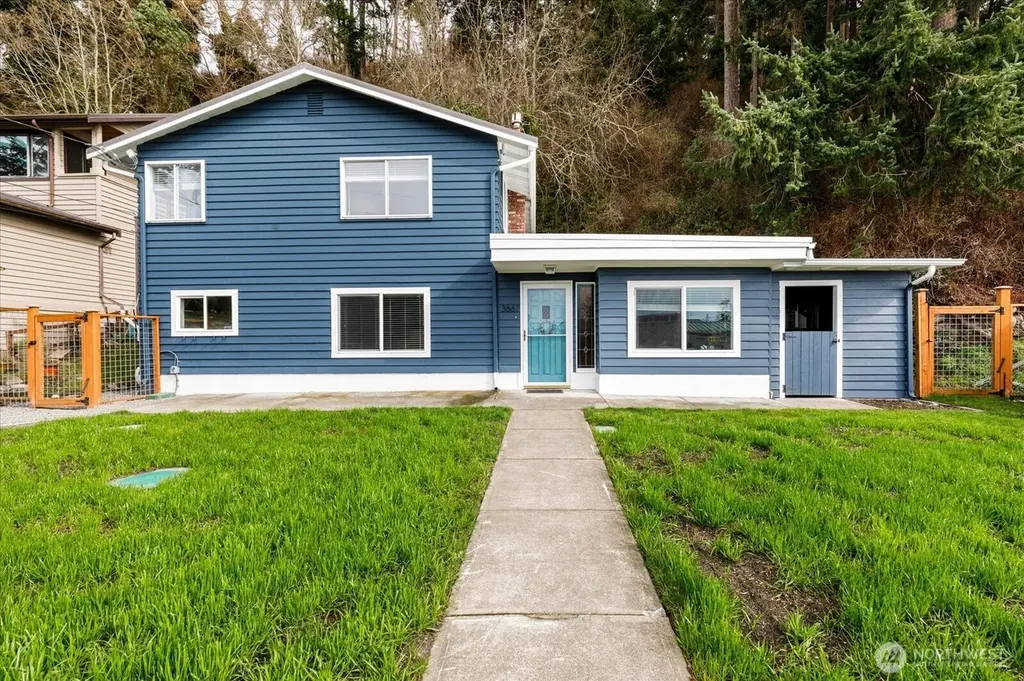
3661 Shorewood Ave · Freeland, WA
Flood risk 9/10 · Severe
- FEMA flood zone
- X (unshaded)
- Chance of flooding over 30 yrs
- 0.99%
- Est. flood insurance / yr
- $507 – $1,088
Fire risk 3/10 · Minor
- Est. fire insurance / yr
- $604 – $1,122
Heat risk 2/10 · Minimal
- Hot days now (above 82°F)
- 8 days/yr
- Hot days in 30 yrs
- 19 days/yr
Wind risk 1/10 · Minimal
- Chance of severe wind over 30 yrs
- —
Air-quality risk 6/10 · Moderate
- Unhealthy air days now
- 8 days/yr
- Unhealthy air days in 30 yrs
- 9 days/yr
Risk factors via First Street. Map © Google.
Why this score? — see what drove the C- grade
The composite is a weighted blend of 9 inputs, each scored 0–100. Each bar is that input's sub-score; the figure is the points it added to the 100-point composite (weight × sub-score).
- ARV discount +15.0/15.0
- Cash flow +9.7/30.0
- Appreciation +6.8/10.0
- Schools +5.6/10.0
- Livability +3.2/5.0
- DSCR +2.8/10.0
- Rent growth +2.5/5.0
- Condition / age +2.5/5.0
- 1% rule +2.2/10.0
$555,000
🖨 Deal sheet (PDF) 📄 Offer letter ✓ Due diligence
Listing remarks
Imagine… coastal living on Whidbey Island in the Lagoon Point community. Perfectly positioned to enjoy the best of island living, this charming home offers immediate access to community beach amenities, a private boat launch, and the expansive shoreline of Whidbey’s westside. Set near one of the region’s most renowned salmon fishing areas, this location embodies the essence of Pacific Northwest coastal living. Thoughtfully updated, the home features new kitchen appliances, updated flooring, and fresh interior paint—creating a turnkey experience with a clean, modern feel. The primary bedroom offers a subtle peek-a-boo view of the water and mountains, adding to the ho
Key facts
- Private boat launch
- Updated flooring
- Expansive shoreline
Tags
Neighborhood map
What this means for you Summary
Snapshot
- This is a 3-bed/2.0-bath single-family listed at $555k.
Deal economics
- At list price, monthly cash flow is $-428 ($-5k/yr) — negative.
- To cash-flow at today's rent, offer at most $479k (13.6% below list).
- To meet the 1% rule (rent ≥ 1% of price), the offer needs to be $402k (27.5% below list).
- Recommended offer: $402k (27.5% below list) — sets the bar for 1% rule.
- Cap rate 5.5% vs local median 1.9% in Freeland — top-decile yield for the area; either an underpriced asset or a hidden risk that comps aren't pricing in. Stress-test before assuming the spread holds.
Location & tenants
- Location reads 64/100 on livability (#367 in WA) — a middle-class / working-renter tenant base. Strengths: crime A+, employment A+, housing A; Watch: health & safety C-, schools F, amenities F.
- Coupeville School District (rural): math 54% / reading 73% proficiency, ranked #40 of 291 in WA (top 14%) — acceptable for families but not a draw, mixed tenant base, ~2y average lease.
- Market conditions: 37 active listings in the ZIP; 402 units permitted in Island County in 2024 (54 in 5+ unit buildings).
Forward outlook
- In year one you build about $24k of equity ($4k loan paydown + $20k appreciation (3.6% local appreciation)).
- Island County population projected to shrink 6% by 2050 — rents likely to lag national; underwrite the cash flow, not the appreciation.
- By year 2, paydown + projected appreciation supports a ~$38k cash-out refi (75% LTV) — recoverable capital for the next deal without selling this one.
Negotiation context
- It's been on market 96 days — a 9% lower offer ($505k) is reasonable based on typical stale-listing flexibility.
- 4 sale attempts since 16y ago; this cycle's ask has dropped $44k (7%) from the opening price — seller is motivated, your offer sets the floor, not the list.
- Current owner paid $389k; 43% above their basis — modest negotiation headroom, anchor on the comps not their cost.
Risks & watch-outs
- Watch-outs: flood insurance adds $66/mo.
- Climate carrying-cost: severe flood risk — expect insurance premiums to compound above CPI over the hold.
Questions for the listing agent
- What do current leases actually rent for vs. the listed asking? Can we see a recent rent roll and the last 12 months of T-12 income?
- It's been on market 96 days. Have you received any prior offers? Is the seller open to a 28% concession, seller financing, or rate buy-down credit?
- Built in 1962 — when were the roof, HVAC, electrical panel, plumbing, and water heater last replaced?
- What's the actual annual flood-insurance premium (NFIP or private), and is the property in a SFHA with mandatory coverage?
- What does the HOA fee cover, when was the last increase, and are there any pending special assessments or reserve-fund shortfalls?
- Why hasn't it sold? Are there any deal-killer items the seller is aware of (foundation, flood, title, zoning, code violations)?
- Is there a deadline driving the sale (1031 exchange, divorce, estate, relocation)? That informs how much negotiation room exists.
- Schools are F-rated, which usually means shorter tenancies and higher turnover. Who's the typical renter profile here, and what's been the actual vacancy rate?
- What's the average days-on-market for RENTAL listings here right now (not sales)? A rising rental-DOM trend means longer vacancies and softer asking-rent achievability than the comps imply.
- What's the recent tenant-quality profile in this submarket — average credit score on applications, eviction rate, late-payment / NSF rate, and stable-employment percentage? A property-management company in the area should have these aggregated.
- How much new for-sale + rental construction is in the pipeline within 1–3 miles? Heavy new supply typically softens prices + rents 12–24 months out; constrained supply supports both.
Investment metrics
- 1% rule
- 0.72% ✗
- Cap rate
- 5.51%
- Cash-on-cash
- -2.79%
- DSCR
- 0.88
- GRM
- 11.5
CMA / ARV
- ARV (median comp)
- $822,613
- List price
- $555,000
- Delta
- -32.53%
- Verdict
- UNDERPRICED
- Comps
- 20 within 1.0 mi
Show comp detail 3 sales within ~0.75 mi
| Address | Dist | Beds/Ba | Sqft | Sold | Price | $/sf | Match |
|---|---|---|---|---|---|---|---|
| 3675 Steelhead Dr | 0.09mi | 2/2.0 (-1) | 1,573 (+1%) | 10mo | $825,000 | $524 | 81 |
| 3642 Shorewood Ave | 0.06mi | 2/2.0 (-1) | 1,481 (-5%) | 22mo | $938,888 | $634 | 66 |
| 3720 Shorewood Ave | 0.17mi | 3/2.0 | 1,440 (-8%) | 22mo | $869,000 | $603 | 61 |
Match score weights: distance 35% · size 25% · config 20% · recency 20%. Top-matched comps best support the ARV.
Projected returns pro-forma
3.59% appreciation · 3.0% rent growth · sell at horizon
- IRR
- 6.2%
- Equity multiple
- 1.37×
- Total profit
- $57,050
- Equity at exit
- $268,176
- IRR
- 8.8%
- Equity multiple
- 2.42×
- Total profit
- $220,090
- Equity at exit
- $428,394
Cash invested: $155,400 (down + closing). Projections, not guarantees.
Landlord ↔ Tenant lean methodology
- Overall (STATE)
- 28 Tenant-Leaning
- State Washington
- 28 Tenant-Leaning · D+8
- County
- — inherits STATE
- City
- — inherits STATE
ZIP-level market 98253
- Home prices YoY
- 1.6%
- Active inventory
- 37
- Price-to-rent
- 11.5×
Monthly cashflow live
- Estimated rent
- $4,023 medium interval (Pro) →
- Mortgage (P&I)
- −$2,910
- Tax from tax record
- −$368 /mo · $4,421/yr
- Insurance
- −$231
- Flood insurance flood zone
- −$66 /mo · $798/yr
- HOA
- −$29
- Vacancy / Maint / Mgmt
- −$845
- Net cashflow
- $-428
Break-even live
Sensitivity live
| Price | -10% $-113 | -5% $-271 | +0% $-428 | +5% $-585 | +10% $-742 |
|---|---|---|---|---|---|
| Rent | -10% $-745 | -5% $-587 | +0% $-428 | +5% $-269 | +10% $-110 |
| Rate | -1.0pp $-148 | -0.5pp $-286 | base $-428 | +0.5pp $-571 | +1.0pp $-718 |
UW: 25.0% down · 7.5% · 30yr · 1.5% tax · 5.0% vac · 8.0% maint · 8.0% mgmt
Financing live
Cash to close
- Down payment
- $138,750
- Closing costs
- $16,650
- Reserves months
- —
- Total cash needed
- —
Loan-product check · same deal, 3 products live
Conventional
25% down · 7.5% · 30yr
- Down + closing
- —
- Monthly P&I
- —
- Monthly cashflow
- —
- DSCR
- —
- Eligible?
- —
Personal DTI + credit; lowest rate.
DSCR
20% down · 8.5% · 30yr
- Down + closing
- —
- Monthly P&I
- —
- Monthly cashflow
- —
- DSCR
- —
- Eligible?
- —
No personal income docs; deal must DSCR.
Hard money
10% down · 12.0% · 12mo
- Down + closing
- —
- Monthly P&I
- —
- Monthly cashflow
- —
- DSCR
- —
- Eligible?
- —
Short-term bridge; refi at stabilization.
HOA detail
- Monthly dues
- $29 · $348/yr
- Likely covers
- water
Listing history 39 events
-
2026-06-21days on market $555,000 Active 96 DOM
-
2026-06-19days on market $555,000 Active 94 DOM
-
2026-06-18days on market $555,000 Active 93 DOM
-
2026-06-17days on market $555,000 Active 92 DOM
-
2026-06-16days on market $555,000 Active 91 DOM
-
2026-06-15days on market $555,000 Active 90 DOM
-
2026-06-14days on market $555,000 Active 88 DOM
-
2026-06-13pricedays on market $555,000 Active 87 DOM
-
2026-06-10days on market $575,000 Active 85 DOM
-
2026-06-09days on market $575,000 Active 84 DOM
-
2026-06-08days on market $575,000 Active 83 DOM
-
2026-06-07days on market $575,000 Active 82 DOM
-
2026-06-05days on market $575,000 Active 79 DOM
-
2026-06-03days on market $575,000 Active 78 DOM
-
2026-06-02days on market $575,000 Active 77 DOM
-
2026-06-01days on market $575,000 Active 76 DOM
-
2026-05-31days on market $575,000 Active 75 DOM
-
2026-05-30days on market $575,000 Active 74 DOM
-
2026-03-17$599,000 Active
-
2019-05-31soldstatus $389,000 Sold
-
2019-05-31soldstatus $389,000
-
2019-04-23status Pending
-
2019-04-15status Pending Inspection
-
2019-04-08$389,000 Active
-
2016-08-04soldstatus $330,000 Sold
-
2016-08-04soldstatus $330,000
-
2016-07-05status Pending
-
2016-06-24status Pending Inspection
-
2016-06-10price $347,000
-
2016-05-04$349,000 Active
-
2010-10-07soldstatus $135,000 Sold
-
2010-10-07soldstatus $135,000
-
2010-09-26status Pending
-
2010-09-14status Pending Inspection
-
2010-08-24price $150,000
-
2010-08-12price $196,000
-
2010-06-09price $201,000
-
2010-04-28$259,900 Active
-
1978-10-01soldstatus $47,700
ⓘ Source: listings_history table (triggers on properties + properties_extension) + one-shot
backfill from property_details.listing_events for pre-trigger history.
Tax reassessment forecast WA · Resets to sale price
- Current annual tax
- $4,421 · $368/mo
- Projected year-2 tax
- $5,439 · $453/mo
- Expected delta
- +$1,018/yr (+$85/mo · 23.0%)
ⓘ Screening estimate from a state-policy table — verify with the county assessor before closing.
Climate risk First Street
- Flood 9/10 Extreme FEMA zone X (unshaded) · 99% chance over 30 yrs
- Wildfire 3/10 Moderate
- Heat 2/10 Low 8 d/yr ≥82°F today · 19 d/yr by 30 yrs out
- Wind 1/10 Low
- Air quality 6/10 Major 8 unhealthy d/yr today · 9 by 30 yrs out
Nearby sold comps map
Loading sold comps map…
Walkable amenities ~0.75 mi
Loading nearby amenities…
Taxation est. · year 1
- Rental income
- $48,273
- − Mortgage interest
- −$31,089
- − Property taxes
- −$4,421
- − Insurance
- −$3,572
- − Repairs & maintenance
- −$3,862
- − Management
- −$3,862
- − HOA
- −$348
- − Depreciation
- −$16,145
- Taxable loss
- −$15,026
- Est. tax savings @ 24.0%
- +$3,606
- After-tax cash flow
- $-1,525/yr
For passive investors: Depreciation is non-cash, so a rental often shows a tax loss while cash-flowing — sheltering income. Rental losses are passive: they offset passive income freely, and up to $25,000/yr can offset ordinary (W-2) income if you actively participate and your MAGI is under $100k (phasing out to $0 by $150k); unused losses carry forward. On sale, claimed depreciation is recaptured at up to 25%, and gains may owe capital-gains tax (a 1031 exchange can defer both). Figures are a year-1 estimate at your 24.0% rate — not tax advice; consult a CPA.
Schools (NCES district)
- District
- Coupeville School District
- NCES district ID
- 5301800
- Math proficiency
- 54% ▲ 4.00%
- Reading proficiency
- 73% ▲ 1.00%
- Median HH income
- $57,404
- Composite
- 56.12/100
- National rank
- #2536
- State rank
- #40 of 291 in WA
Livability — Freeland
- Score
- 64/100
- State rank
- #367
- US rank
- #13986
Category grades
Schools grade is shown separately in the Schools card above.
Census & demographics
- City population
- 4,531
- Population (ZIP)
- 2,141
Population outlook (Island County) Hauer SSP2
- Today (2025)
- 82,019 people
- By 2030
- 81,329 · -0.8%
- By 2040
- 78,552 · -4.2%
- By 2050
- 77,042 · -6.1%
- By 2075
- 80,799 · -1.5%
- By 2100
- 84,451 · +3.0%
Race, ethnicity, and origin ACS 2023
- Neighborhood character
- Predominantly White (87%)
- Race & ethnicity
- White 87% Two or more races 10% Hispanic / Latino 5%
- Hispanic origin (detail)
- Mexican 4%
- Common ancestry
- Portuguese 5% Slovak 4% Italian 4%
- Foreign-born
- 6% · Canada
- Languages at home
- 97% English-only · German/W. Germanic 1% Other Asian/Pacific 1%
Political lean MEDSL · Island
- 2024 margin
- D (+16.6) · D 56.8% · R 40.3% · Other 2.9%
- 2008→2024 swing
- +10.3pp toward D · 2008: 6.2pp · 2024: 16.6pp
- All cycles
- 2024: D+16.6 2020: D+12.0 2016: D+5.9 2012: D+4.4 2008: D+6.2
Not yet ingested
- Civics
- —
Market trends
- HPI YoY
- ▲ 3.59%
- Current HPI
- 227.7902
- Rent YoY
- —
- Metro
- —
- State GDP YoY
- ▲ 4.65%
- F500 in state
- 22
Industry mix (Fortune 500 HQ in WA)
| Industry | F500 HQs | Revenue |
|---|---|---|
| Retail | 2 | $269B |
|
||
| Technology / Retail | 1 | $638B |
|
||
| Technology | 1 | $245B |
|
||
| Telecommunications | 1 | $38B |
|
||
| Food / Beverage | 1 | $36B |
|
||
| Automotive / Trucks | 1 | $34B |
|
||
Price history
+1155.8% since first listed21 events — show timeline
- 2026-03-17 Listed $599,000 NWMLS as Distributed by MLS Grid
- 2019-05-31 Sold (Public Records) $389,000 Public Records
- 2019-05-31 Sold (MLS) $389,000 NWMLS as Distributed by MLS Grid
- 2019-04-23 Pending — NWMLS as Distributed by MLS Grid
- 2019-04-15 Pending — NWMLS as Distributed by MLS Grid
- 2019-04-08 Listed $389,000 NWMLS as Distributed by MLS Grid
- 2016-08-04 Sold (Public Records) $330,000 Public Records
- 2016-08-04 Sold (MLS) $330,000 NWMLS as Distributed by MLS Grid
- 2016-07-05 Pending — NWMLS as Distributed by MLS Grid
- 2016-06-24 Pending — NWMLS as Distributed by MLS Grid
- 2016-06-10 Price Changed $347,000 NWMLS as Distributed by MLS Grid
- 2016-05-04 Listed $349,000 NWMLS as Distributed by MLS Grid
- 2010-10-07 Sold (Public Records) $135,000 Public Records
- 2010-10-07 Sold (MLS) $135,000 NWMLS as Distributed by MLS Grid
- 2010-09-26 Pending — NWMLS as Distributed by MLS Grid
- 2010-09-14 Pending — NWMLS as Distributed by MLS Grid
- 2010-08-24 Price Changed $150,000 NWMLS as Distributed by MLS Grid
- 2010-08-12 Price Changed $196,000 NWMLS as Distributed by MLS Grid
- 2010-06-09 Price Changed $201,000 NWMLS as Distributed by MLS Grid
- 2010-04-28 Listed $259,900 NWMLS as Distributed by MLS Grid
- 1978-10-01 Sold (Public Records) $47,700 Public Records
Property tax history
+19.5%/yrLatest (2026): $4,421 · -0.3% YoY. Source: county tax records.
Cash-flow waterfall
monthlySold comps — $/sqft
last 12 mo · ≤1 miLoading sold comps…