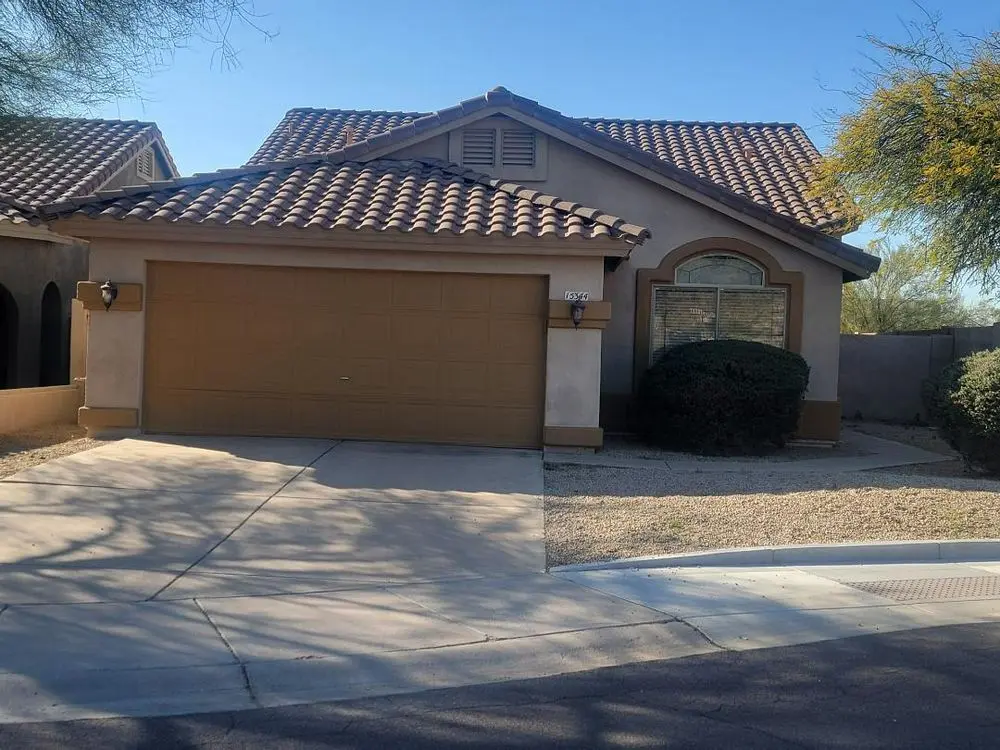
15344 N 102nd St · Scottsdale, AZ
Flood risk 1/10 · Minimal
- FEMA flood zone
- X (shaded)
- Chance of flooding over 30 yrs
- 0.0%
- Est. flood insurance / yr
- $507 – $1,088
Fire risk 5/10 · Moderate
- Est. fire insurance / yr
- $610 – $1,132
Heat risk 8/10 · Major
- Hot days now (above 111°F)
- 7 days/yr
- Hot days in 30 yrs
- 19 days/yr
Wind risk 1/10 · Minimal
- Chance of severe wind over 30 yrs
- —
Air-quality risk 3/10 · Minor
- Unhealthy air days now
- 3 days/yr
- Unhealthy air days in 30 yrs
- 4 days/yr
Risk factors via First Street. Map © Google.
Why this score? — see what drove the D- grade
The composite is a weighted blend of 9 inputs, each scored 0–100. Each bar is that input's sub-score; the figure is the points it added to the 100-point composite (weight × sub-score).
- ARV discount +8.7/15.0
- Appreciation +7.8/10.0
- Cash flow +6.6/30.0
- Schools +4.8/10.0
- Livability +4.0/5.0
- Rent growth +3.6/5.0
- Condition / age +2.5/5.0
- DSCR +0.9/10.0
- 1% rule +0.5/10.0
$699,000
🖨 Deal sheet 📄 Offer letter ✓ Due diligence
Listing remarks MLS
Location Location Location. .. .. Mcdowell Mountain Ranch Neighborhood Nicely Updated ALL New Wood Laminate Flooring in all the Rooms, Entire House throughout! One Level Home Master Bedroom on opposite Side of the House Great Privacy! Scenic Private Fenced in Back yard. Very Clean Inside, Cabinets Re-finished all Fleshly painted Inside Large Great Room/Kitchen combo Brand New Walk-in Master Shower and Walk-in Closet. Call owner for more Information. .. . Owner is Flexible on Time :)
Key facts
- Re-finished cabinets
- Walk-in closet
- 5,350 sq ft lot
Tags
Neighborhood map
What this means for you Summary
Snapshot
- This is a 3-bed/3.0-bath single-family listed at $699k.
Deal economics
- At list price, monthly cash flow is $-1k ($-14k/yr) — negative.
- To cash-flow at today's rent, offer at most $497k (28.9% below list).
- To meet the 1% rule (rent ≥ 1% of price), the offer needs to be $384k (45.0% below list).
- Recommended offer: $384k (45.0% below list) — sets the bar for 1% rule.
- Cap rate 4.3% vs local median 2.5% in Scottsdale — top-decile yield for the area; either an underpriced asset or a hidden risk that comps aren't pricing in. Stress-test before assuming the spread holds.
Location & tenants
- Location reads 80/100 on livability (#4 in AZ, #1,756 nationally) — a professional / high-income tenant draw. Strengths: amenities A+, commute A+, employment A+; Watch: health & safety C-, cost of living F.
- Scottsdale Unified District (4240) (urban): math 53% / reading 55% proficiency, ranked #30 of 249 in AZ (top 12%) — acceptable for families but not a draw, mixed tenant base, ~2y average lease.
- Market conditions: Rents rising fast (+4.4%/yr); 720 active listings in the ZIP; 40 comparable units currently listed for rent nearby; rentals at typical pace (median 22d on market — plan ~3-4 weeks tenant-placement turnaround); 42% of comp listings sitting > 30 days — soft ceiling on asking rent; high-income renter base; 36,011 units permitted in Maricopa County in 2024 (12,801 in 5+ unit buildings).
- This rent runs 33% of the median local income ($141k/yr) — at the standard rent-burdened threshold; future hikes will face affordability resistance.
Forward outlook
- In year one you build about $44k of equity ($5k loan paydown + $39k appreciation (5.6% local appreciation)).
- Maricopa County population projected at +38% by 2050 — long-run rental-demand tailwind backs the buy-and-hold thesis.
- By year 2, paydown + projected appreciation supports a ~$71k cash-out refi (75% LTV) — recoverable capital for the next deal without selling this one.
Negotiation context
- It's been on market 105 days — a 9% lower offer ($636k) is reasonable based on typical stale-listing flexibility.
- 4 sale attempts with the ask held roughly flat each time — persistent listings suggest the price (not the market) is what's stuck; bring a comps-based counter.
- Current owner paid $101k; list at $699k implies a 594% gain — meaningful room to come down on a strong offer.
Risks & watch-outs
- Climate carrying-cost: moderate wildfire risk; extreme-heat days projected 7→19/yr by 2055 (HVAC capex compounding) — expect insurance premiums to compound above CPI over the hold.
Questions for the listing agent
- What do current leases actually rent for vs. the listed asking? Can we see a recent rent roll and the last 12 months of T-12 income?
- It's been on market 105 days. Have you received any prior offers? Is the seller open to a 45% concession, seller financing, or rate buy-down credit?
- Why hasn't it sold? Are there any deal-killer items the seller is aware of (foundation, flood, title, zoning, code violations)?
- Is there a deadline driving the sale (1031 exchange, divorce, estate, relocation)? That informs how much negotiation room exists.
- Schools are A-rated — typically a magnet for longer-tenancy family renters. What's the average tenant stay here, and is there a school-zone premium baked into asking?
- The area grade is low — what's the realistic commute time and amenity access for the typical tenant pool here? Any planned neighborhood developments (good or bad) we should know about?
- What's the average days-on-market for RENTAL listings here right now (not sales)? A rising rental-DOM trend means longer vacancies and softer asking-rent achievability than the comps imply.
- What's the recent tenant-quality profile in this submarket — average credit score on applications, eviction rate, late-payment / NSF rate, and stable-employment percentage? A property-management company in the area should have these aggregated.
- How much new for-sale + rental construction is in the pipeline within 1–3 miles? Heavy new supply typically softens prices + rents 12–24 months out; constrained supply supports both.
Investment metrics
- 1% rule
- 0.55% ✗
- Cap rate
- 4.33%
- Cash-on-cash
- -7.01%
- DSCR
- 0.69
- GRM
- 15.2
CMA / ARV
- ARV (median comp)
- $718,234
- List price
- $699,000
- Delta
- -2.68%
- Verdict
- FAIR
- Comps
- 20 within 1.0 mi
Show comp detail 12 sales within ~0.75 mi
| Address | Dist | Beds/Ba | Sqft | Sold | Price | $/sf | Match |
|---|---|---|---|---|---|---|---|
| 10290 E Hillery Dr | 0.15mi | 3/2.0 | 1,504 (0%) | 2mo | $790,000 | $525 | 88 |
| 15687 N 104th St | 0.34mi | 3/2.0 | 1,548 (+3%) | 3mo | $765,000 | $494 | 73 |
| 10208 E Firewheel Dr | 0.43mi | 3/2.0 | 1,478 (-2%) | 2mo | $660,000 | $447 | 71 |
| 10420 E Salt Bush Dr | 0.44mi | 3/2.0 | 1,548 (+3%) | 0mo | $650,000 | $420 | 70 |
| 10335 E Saltillo Dr | 0.53mi | 3/2.0 | 1,504 (0%) | 2mo | $780,000 | $519 | 69 |
| 10373 E Penstamin Dr | 0.63mi | 3/2.0 | 1,536 (+2%) | 1mo | $725,000 | $472 | 62 |
| 10482 E Karen Dr | 0.37mi | 3/2.0 | 1,702 (+13%) | 0mo | $770,000 | $452 | 57 |
| 10456 E Raintree Dr | 0.38mi | 3/2.0 | 1,702 (+13%) | 1mo | $827,500 | $486 | 56 |
| 10459 E Hillery Dr | 0.35mi | 3/2.0 | 1,702 (+13%) | 3mo | $807,000 | $474 | 55 |
| 10357 E Texas Sage Ln | 0.39mi | 3/2.0 | 1,702 (+13%) | 2mo | $856,000 | $503 | 54 |
| 10290 E Mallow Cir | 0.39mi | 3/2.0 | 1,702 (+13%) | 2mo | $812,000 | $477 | 54 |
| 15151 N 100th Way | 0.53mi | 3/2.0 | 1,691 (+12%) | 1mo | $585,000 | $346 | 50 |
Match score weights: distance 35% · size 25% · config 20% · recency 20%. Top-matched comps best support the ARV.
Projected returns pro-forma
5.64% appreciation · 4.42% rent growth · sell at horizon
- IRR
- 9.1%
- Equity multiple
- 1.61×
- Total profit
- $119,198
- Equity at exit
- $423,493
- IRR
- 10.9%
- Equity multiple
- 3.16×
- Total profit
- $423,260
- Equity at exit
- $754,600
Cash invested: $195,720 (down + closing). Projections, not guarantees.
Landlord ↔ Tenant lean methodology
- Overall (STATE)
- 87 Strongly Landlord-Friendly
- State Arizona
- 87 Strongly Landlord-Friendly · R+3
- County
- — inherits STATE
- City
- — inherits STATE
ZIP-level market 85255
- Home prices YoY
- 1.7%
- Rents YoY
- 4.4%
- Active inventory
- 720
- Price-to-rent
- 15.2×
Monthly cashflow live
- Estimated rent
- $3,841 high interval (Pro) →
- Mortgage (P&I)
- −$3,666
- Tax from tax record
- −$222 /mo · $2,661/yr
- Insurance
- −$291
- HOA
- −$0
- Vacancy / Maint / Mgmt
- −$807
- Net cashflow
- $-1,144
Break-even live
UW: 25.0% down · 7.5% · 30yr · 1.5% tax · 5.0% vac · 8.0% maint · 8.0% mgmt
Financing live
Cash to close
- Down payment
- $174,750
- Closing costs
- $20,970
- Reserves months
- —
- Total cash needed
- —
Loan-product check · same deal, 3 products live
Conventional
25% down · 7.5% · 30yr
- Down + closing
- —
- Monthly P&I
- —
- Monthly cashflow
- —
- DSCR
- —
- Eligible?
- —
Personal DTI + credit; lowest rate.
DSCR
20% down · 8.5% · 30yr
- Down + closing
- —
- Monthly P&I
- —
- Monthly cashflow
- —
- DSCR
- —
- Eligible?
- —
No personal income docs; deal must DSCR.
Hard money
10% down · 12.0% · 12mo
- Down + closing
- —
- Monthly P&I
- —
- Monthly cashflow
- —
- DSCR
- —
- Eligible?
- —
Short-term bridge; refi at stabilization.
Rent comps 40 comps
| Address | Beds | Baths | Sqft | Rent | $/sqft | DOM | Units | Dist |
|---|---|---|---|---|---|---|---|---|
| 10295 E Hillery Dr Scottsdale, AZ | 3.0 | 2.0 | 1837 | $7,500 | $4.08 | 43d | 1 | 0.19mi |
| 10318 E Tierra Buena Ln Scottsdale, AZ | 4.0 | 2.0 | 1963 | $4,200 | $2.14 | 13d | 1 | 0.26mi |
| 10342 E Tierra Buena Ln Unit 1545663P Scottsdale, AZ | 3.0 | 2.0 | 1646 | $4,071 | $2.47 | 14d | 1 | 0.29mi |
| 10458 E Karen Dr Scottsdale, AZ | 4.0 | 3.0 | 2200 | $12,000 | $5.45 | 43d | 1 | 0.34mi |
| 14862 N 103rd St Scottsdale, AZ | 4.0 | 3.0 | 2132 | $3,200 | $1.50 | 11d | 1 | 0.38mi |
| 10290 E Mallow Cir Scottsdale, AZ | 3.0 | 2.0 | 1702 | $3,400 | $2.00 | 43d | 1 | 0.43mi |
| 16356 N Thompson Peak Pkwy Scottsdale, AZ | 1.0–3.0 | 1.0–2.0 | 1040 | $2,300 | $2.21 | 2d | 71 | 0.47mi |
| 10438 E Star of the Desert Dr Scottsdale, AZ | 3.0 | 2.0 | 1451 | $2,995 | $2.06 | 43d | 1 | 0.53mi |
| 10317 E Penstamin Dr Scottsdale, AZ | 3.0 | 2.0 | 1800 | $3,195 | $1.77 | 43d | 1 | 0.55mi |
| 10412 E Acoma Dr Scottsdale, AZ | 4.0 | 2.0 | 2114 | $10,000 | $4.73 | 43d | 1 | 0.58mi |
| 14736 N 100th Pl Scottsdale, AZ | 3.0 | 2.0 | 1852 | $8,500 | $4.59 | 20d | 1 | 0.59mi |
| 10518 E Star of the Desert Dr Scottsdale, AZ | 3.0 | 2.0 | 1451 | $3,200 | $2.21 | 20d | 1 | 0.61mi |
| 15225 N 100th St Scottsdale, AZ | 2.0 | 2.0 | 1548 | $4,425 | $2.86 | 43d | 2 | 0.64mi |
| 15095 N Thompson Peak Pkwy Scottsdale, AZ | 1.0–3.0 | 1.0–2.0 | 1092 | $6,750 | $6.18 | 2d | 7 | 0.70mi |
| 15095 N Thompson Peak Pkwy Scottsdale, AZ | 1.0–2.0 | 1.0–2.0 | 978 | $6,750 | $6.90 | 43d | 6 | 0.70mi |
| 15095 N Thompson Peak Pkwy Scottsdale, AZ | 1.0–3.0 | 1.0–2.0 | 1092 | $6,750 | $6.18 | 23d | 8 | 0.70mi |
| 16420 N Thompson Peak Pkwy Scottsdale, AZ | 2.0–3.0 | 2.0–2.5 | 1688 | $6,750 | $4.00 | 4d | 7 | 0.73mi |
| 16420 N Thompson Peak Pkwy Scottsdale, AZ | 2.0–3.0 | 2.0–2.5 | 1537 | $6,750 | $4.39 | 7d | 8 | 0.73mi |
| 14746 N 97th St Scottsdale, AZ | 3.0 | 2.0 | 1677 | $3,600 | $2.15 | 5d | 1 | 0.74mi |
| 14203 N 101st St Scottsdale, AZ | 3.0 | 2.5 | 1863 | $2,695 | $1.45 | 24d | 1 | 0.74mi |
| 14203 N 101st St Scottsdale, AZ | 3.0 | 2.5 | 1863 | $2,695 | $1.45 | 20d | 1 | 0.74mi |
| 9756 E Pine Valley Rd Scottsdale, AZ | 3.0 | 2.0 | 1491 | $3,250 | $2.18 | 5d | 1 | 0.74mi |
| 14545 N Frank Lloyd Wright Blvd Scottsdale, AZ | 1.0–3.0 | 1.0–2.0 | 1080 | $2,260 | $2.09 | 5d | 7 | 0.77mi |
| 15252 N 100th St Scottsdale, AZ | 2.0–3.0 | 2.0 | 1454 | $2,700 | $1.86 | 19d | 2 | 0.78mi |
| 15252 N 100th St Scottsdale, AZ | 2.0–3.0 | 2.0 | 1454 | $3,495 | $2.40 | 11d | 2 | 0.78mi |
| 10059 E Sheena Dr Scottsdale, AZ | 2.0 | 2.0 | 1178 | $2,950 | $2.50 | 43d | 1 | 0.79mi |
| 15380 N 100th St Scottsdale, AZ | 2.0 | 1.0–2.0 | 1172 | $2,750 | $2.35 | 3d | 2 | 0.79mi |
| 15050 N Thompson Peak Pkwy Scottsdale, AZ | 2.0–3.0 | 2.0 | 1500 | $3,500 | $2.33 | 43d | 3 | 0.79mi |
| 14204 N 100th Pl Scottsdale, AZ | 3.0 | 2.5 | 1862 | $2,995 | $1.61 | 43d | 1 | 0.80mi |
| 16600 N Thompson Peak Pkwy #1047 Scottsdale, AZ | 2.0 | 2.5 | 1890 | $3,500 | $1.85 | 43d | 1 | 0.80mi |
| 15380 N 100th St #1121 Scottsdale, AZ | 2.0 | 2.0 | 1254 | $3,750 | $2.99 | 43d | 1 | 0.82mi |
| 15151 N Frank Lloyd Wright Blvd Scottsdale, AZ | 2.0 | 2.0 | 1377 | $3,225 | $2.34 | 43d | 3 | 0.91mi |
| 15255 N Frank Lloyd Wright Blvd Scottsdale, AZ | 1.0–3.0 | 1.0–2.0 | 905 | $2,235 | $2.47 | 1d | 22 | 0.93mi |
| 9711 E Palm Ridge Dr Scottsdale, AZ | 3.0 | 2.5 | 2096 | $3,249 | $1.55 | 7d | 1 | 1.00mi |
| 9696 E Sheena Dr Scottsdale, AZ | 3.0 | 2.5 | 2096 | $3,500 | $1.67 | 21d | 1 | 1.03mi |
| 15041 N 93rd Way Scottsdale, AZ | 3.0 | 2.0 | 1374 | $4,200 | $3.06 | 43d | 1 | 1.03mi |
| 15555 N Frank Lloyd Wright Blvd Scottsdale, AZ | 2.0 | 2.0 | 1111 | $1,904 | $1.71 | 3d | 1 | 1.06mi |
| 9455 E Raintree Dr Scottsdale, AZ | 2.0–3.0 | 1.5–2.0 | 1310 | $4,950 | $3.78 | 43d | 3 | 1.07mi |
| 9455 E Raintree Dr Scottsdale, AZ | 2.0–3.0 | 1.5–2.0 | 1310 | $4,950 | $3.78 | 5d | 4 | 1.07mi |
| 10046 E Bell Rd Scottsdale, AZ | 2.0 | 2.0 | 1837 | $3,175 | $1.73 | 43d | 1 | 1.09mi |
Listing history 13 events
-
2026-06-03days on market $699,000 Active 105 DOM
-
2026-06-02days on market $699,000 Active 104 DOM
-
2026-06-01days on market $699,000 Active 103 DOM
-
2026-05-31days on market $699,000 Active 102 DOM
-
2026-02-18$699,000 Active 489-char remark
Show marketing remark (489 chars)
Location Location Location. .. .. Mcdowell Mountain Ranch Neighborhood Nicely Updated ALL New Wood Laminate Flooring in all the Rooms, Entire House throughout! One Level Home Master Bedroom on opposite Side of the House Great Privacy! Scenic Private Fenced in Back yard. Very Clean Inside, Cabinets Re-finished all Fleshly painted Inside Large Great Room/Kitchen combo Brand New Walk-in Master Shower and Walk-in Closet. Call owner for more Information. .. . Owner is Flexible on Time :)
-
2025-08-09historical $2,800
-
2025-07-02$2,800
-
2025-06-01historical $2,600
-
2025-05-29price $2,600
-
2025-05-08$2,800
-
2025-05-01historical $2,995
-
2025-02-27$2,995
-
1999-12-15soldstatus $100,759
ⓘ Source: listings_history table (triggers on properties + properties_extension) + one-shot
backfill from property_details.listing_events for pre-trigger history.
Tax reassessment forecast AZ · Resets to sale price
- Current annual tax
- $2,661 · $222/mo
- Projected year-2 tax
- $4,613 · $384/mo
- Expected delta
- +$1,953/yr (+$163/mo · 73.4%)
ⓘ Screening estimate from a state-policy table — verify with the county assessor before closing.
Climate risk First Street
- Flood 1/10 Low FEMA zone X (shaded) · 0% chance over 30 yrs
- Wildfire 5/10 Major
- Heat 8/10 Severe 7 d/yr ≥111°F today · 19 d/yr by 30 yrs out
- Wind 1/10 Low
- Air quality 3/10 Moderate 3 unhealthy d/yr today · 4 by 30 yrs out
Nearby sold comps map
Loading sold comps map…
Walkable amenities ~0.75 mi
Loading nearby amenities…
Taxation est. · year 1
- Rental income
- $46,093
- − Mortgage interest
- −$39,155
- − Property taxes
- −$2,661
- − Insurance
- −$3,495
- − Repairs & maintenance
- −$3,687
- − Management
- −$3,687
- − Depreciation
- −$20,335
- Taxable loss
- −$26,927
- Est. tax savings @ 24.0%
- +$6,462
- After-tax cash flow
- $-7,267/yr
For passive investors: Depreciation is non-cash, so a rental often shows a tax loss while cash-flowing — sheltering income. Rental losses are passive: they offset passive income freely, and up to $25,000/yr can offset ordinary (W-2) income if you actively participate and your MAGI is under $100k (phasing out to $0 by $150k); unused losses carry forward. On sale, claimed depreciation is recaptured at up to 25%, and gains may owe capital-gains tax (a 1031 exchange can defer both). Figures are a year-1 estimate at your 24.0% rate — not tax advice; consult a CPA.
Schools (NCES district)
- District
- Scottsdale Unified District (4240)
- NCES district ID
- 0407570
- Math proficiency
- 53% ▼ -10.00%
- Reading proficiency
- 55% ▼ -8.00%
- Median HH income
- $70,139
- Composite
- 48.02/100
- National rank
- #2196
- State rank
- #30 of 249 in AZ
Livability — Scottsdale
- Score
- 80/100
- State rank
- #4
- US rank
- #1756
Category grades
Schools grade is shown separately in the Schools card above.
Census & demographics
- Census place
- Scottsdale, AZ
- County
- Maricopa County · 4,537,380 people
- City population
- 290,846
- Metro
- Phoenix-Mesa-Chandler, AZ
- Population (ZIP)
- 45,346
- Household income
- $140,616
- Rent vs Own
- Severe rent burden
- 1034.0
Population outlook (Maricopa County) Hauer SSP2
- Today (2025)
- 4,979,203 people
- By 2030
- 5,378,229 · +8.0%
- By 2040
- 6,156,598 · +23.6%
- By 2050
- 6,872,376 · +38.0%
- By 2075
- 8,401,270 · +68.7%
- By 2100
- 9,247,439 · +85.7%
Race, ethnicity, and origin ACS 2023
- Neighborhood character
- Predominantly White (84%)
- Race & ethnicity
- White 84% Hispanic / Latino 7% Two or more races 6% Asian 4% Black 1%
- Hispanic origin (detail)
- Mexican 3%
- Common ancestry
- Romanian 4% Slovak 3% Italian 2%
- Foreign-born
- 11% · Canada, South Korea, China
- Languages at home
- 88% English-only · Spanish 5% Other Indo-European 3% Other Asian/Pacific 1%
Political lean MEDSL · Maricopa
- 2024 margin
- Toss-up / Even · D 47.7% · R 51.2% · Other 1.1%
- 2008→2024 swing
- +7.1pp toward D · 2008: -10.6pp · 2024: -3.5pp
- All cycles
- 2024: R+3.5 2020: D+2.2 2016: R+3.5 2012: R+12.0 2008: R+10.6
Not yet ingested
- Civics
- —
Market trends
- HPI YoY
- ▲ 5.64%
- Current HPI
- 330.9931
- Rent YoY
- ▲ 4.42%
- Metro
- Phoenix-Mesa-Chandler, AZ
- State GDP YoY
- ▲ 4.54%
- F500 in state
- 20
Industry mix (Fortune 500 HQ in AZ)
| Industry | F500 HQs | Revenue |
|---|---|---|
| Technology | 2 | $13B |
|
||
| Mining / Metals | 1 | $23B |
|
||
| Environmental Services | 1 | $16B |
|
||
| Metals / Steel | 1 | $14B |
|
||
| Technology Distribution | 1 | $9B |
|
||
| Homebuilding | 1 | $8B |
|
||
Price history
+593.7% since first listed9 events — show timeline
- 2026-02-18 Listed $699,000 ForSaleByOwner.com
- 2025-08-09 Rental Removed $2,800 ARMLS
- 2025-07-02 Listed for Rent $2,800 ARMLS
- 2025-06-01 Rental Removed $2,600 ARMLS
- 2025-05-29 Price Changed $2,600 ARMLS
- 2025-05-08 Listed for Rent $2,800 ARMLS
- 2025-05-01 Rental Removed $2,995 ARMLS
- 2025-02-27 Listed for Rent $2,995 ARMLS
- 1999-12-15 Sold (Public Records) $100,759 Public Records
Property tax history
+1.8%/yrLatest (2025): $2,661 · +4.4% YoY. Source: county tax records.
Cash-flow waterfall
monthlySold comps — $/sqft
last 12 mo · ≤1 miLoading sold comps…