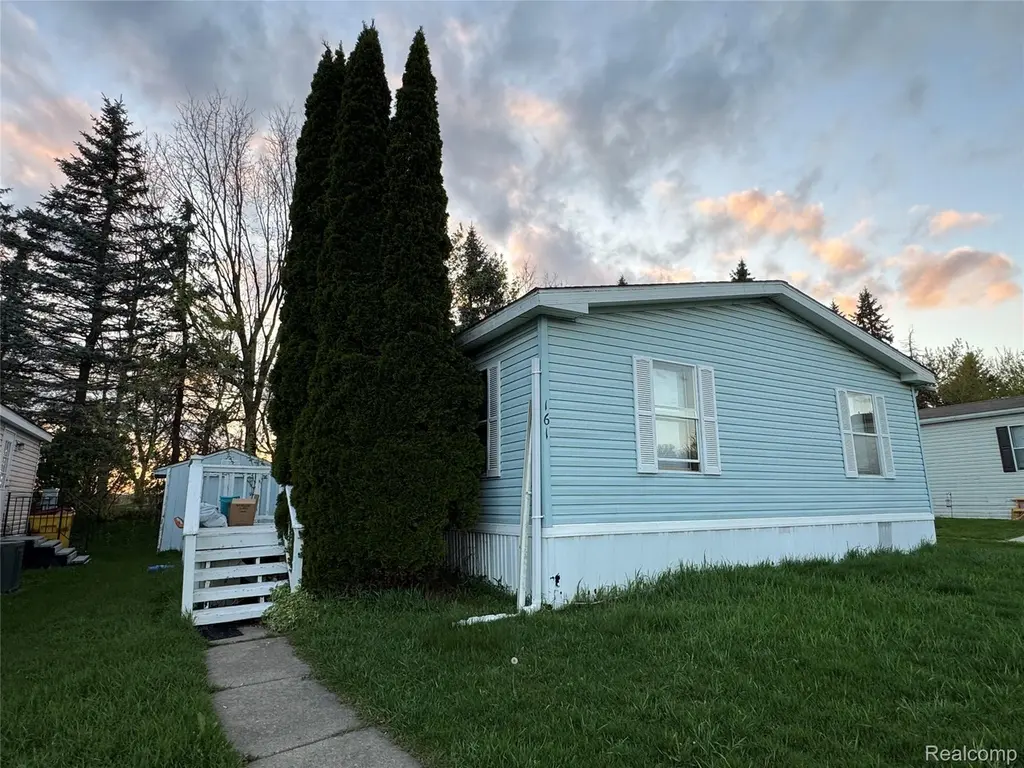
2700 Shimmons Rd #161 · Auburn Hills, MI
Flood risk No data
- FEMA flood zone
- —
- Chance of flooding over 30 yrs
- —
- Est. flood insurance / yr
- —
Fire risk No data
- Est. fire insurance / yr
- —
Heat risk No data
- Hot days now (above threshold)
- —
- Hot days in 30 yrs
- —
Wind risk No data
- Chance of severe wind over 30 yrs
- —
Air-quality risk No data
- Unhealthy air days now
- —
- Unhealthy air days in 30 yrs
- —
Risk factors via First Street. Map © Google.
Why this score? — see what drove the D grade
The composite is a weighted blend of 9 inputs, each scored 0–100. Each bar is that input's sub-score; the figure is the points it added to the 100-point composite (weight × sub-score).
- Cash flow +15.0/30.0
- ARV discount +7.5/15.0
- 1% rule +5.0/10.0
- DSCR +5.0/10.0
- Livability +3.8/5.0
- Condition / age +2.2/5.0
- Rent growth +1.9/5.0
- Schools +1.0/10.0
- Appreciation +0.0/10.0
$40,000
🖨 Deal sheet (PDF) 📄 Offer letter ✓ Due diligence
Listing remarks MLS
Welcome to your next investment opportunity or the perfect starter home! This spacious 3-bedroom, 2-bath mobile home offers a functional layout with plenty of potential. Step through the front door into a welcoming living room, providing a comfortable space for relaxing or entertaining guests. The kitchen features an open layout with ample cabinet and counter space, creating a bright and inviting area for everyday living. The primary suite includes a large walk-in closet and a private bathroom complete with a tub. Two additional bedrooms and one additional full bathroom provide convenience and flexibility for family members or guests. Whether you're a first-time homebuyer, investor, or someone looking for a property you can personalize and make your own, this home is full of opportunity and potential. Schedule your showing today!
Key facts
- 4,356 sq ft lot
- Built 1992
- Listed 29 days
Property features AI
Exterior
- Parking: No garage; Carport
- Utilities: Public water; Public sewer; Electric with circuit breakers
- Home design: Single-family residence; One story; Entry at ground level with steps
- Construction: Steel siding; Pillar/post/pier foundation; Above-grade finished area about 1,200 square feet
- Exterior features: Paved road access; Lot approximately 0.1 acres (50 x 100)
Interior
- Bathrooms: 2 full bathrooms
- Heating & cooling: Forced air heating (natural gas); Ceiling fan(s); No central cooling
- Interior features: 5 total rooms; Ground-level entry with steps
Neighborhood map
What this means for you Summary
Snapshot
- This is a 3-bed/2.0-bath single-family listed at $40k. Condition is rated fair.
Deal economics
- At list price, monthly cash flow is $1k ($14k/yr) — positive.
- The deal already cash-flows at list — no discount required.
- Meets the 1% rule at list price ($2k rent vs $40k).
- Recommended offer: $39k (1.5% below list) — sets the bar for market timing.
- Cap rate 42.0% vs local median 4.3% in Auburn Hills — top-decile yield for the area; either an underpriced asset or a hidden risk that comps aren't pricing in. Stress-test before assuming the spread holds.
Location & tenants
- Location reads 76/100 on livability (#151 in MI, #3,766 nationally) — a middle-class / working-renter tenant base. Strengths: commute A+, cost of living A+, housing A+; Watch: crime D+, schools D, amenities F.
- Pontiac City School District (urban): math 8% / reading 17% proficiency, ranked #514 of 540 in MI (top 95%) — low school quality limits family demand, transient renter base, plan for 1-2y turnover; 81% free/reduced lunch — lower-income household profile, screen leases tightly.
- Market conditions: Rents soft (-2.3%/yr); 107 active listings in the ZIP; 23 comparable units currently listed for rent nearby; rentals at typical pace (median 22d on market — plan ~3-4 weeks tenant-placement turnaround); solid renter incomes; 2,614 units permitted in Oakland County in 2024 (721 in 5+ unit buildings).
Forward outlook
- Local home prices are declining (-3.0%/yr); year-one equity from $277 of loan paydown is wiped out by about $1k of value loss. Plan a longer hold.
- Oakland County population projected at +10% by 2050 — modest demand growth; plan on rents tracking national, not racing it.
- At projected returns (-3.0% appreciation + 0.0% rent growth), your $11k cash investment doubles in ~1 year — after that, you're playing with house money.
Negotiation context
- It's been on market 29 days — a 2% lower offer ($39k) is reasonable based on typical stale-listing flexibility.
- 2 sale attempts with the ask held roughly flat each time — persistent listings suggest the price (not the market) is what's stuck; bring a comps-based counter.
Questions for the listing agent
- Have any recent inspections been done? Can we get a copy of the seller's disclosures and any deferred-maintenance estimates?
- Is there a deadline driving the sale (1031 exchange, divorce, estate, relocation)? That informs how much negotiation room exists.
- Schools are D-rated, which usually means shorter tenancies and higher turnover. Who's the typical renter profile here, and what's been the actual vacancy rate?
- Crime grade is D in this area — have there been break-ins, vandalism, or insurance claims at this property in the last 3 years? What carrier currently insures it and at what premium?
- The area grade is low — what's the realistic commute time and amenity access for the typical tenant pool here? Any planned neighborhood developments (good or bad) we should know about?
- What's the average days-on-market for RENTAL listings here right now (not sales)? A rising rental-DOM trend means longer vacancies and softer asking-rent achievability than the comps imply.
- What's the recent tenant-quality profile in this submarket — average credit score on applications, eviction rate, late-payment / NSF rate, and stable-employment percentage? A property-management company in the area should have these aggregated.
- How much new for-sale + rental construction is in the pipeline within 1–3 miles? Heavy new supply typically softens prices + rents 12–24 months out; constrained supply supports both.
Investment metrics
- 1% rule
- 4.64% ✓
- Cap rate
- 42.01%
- Cash-on-cash
- 127.58%
- DSCR
- 6.68
- GRM
- 1.8
CMA / ARV
- ARV (on-the-fly)
- $237,600
- Comps found
- 12
Show comp detail 12 sales within ~0.75 mi
| Address | Dist | Beds/Ba | Sqft | Sold | Price | $/sf | Match |
|---|---|---|---|---|---|---|---|
| 2515 James Rd | 0.36mi | 3/1.0 | 1,100 (-8%) | 6mo | $218,100 | $198 | 60 |
| 2848 Edna Jane Dr | 0.47mi | 2/1.0 (-1) | 1,228 (+2%) | 9mo | $210,000 | $171 | 58 |
| 2682 Genes Dr | 0.46mi | 3/1.0 | 1,094 (-9%) | 11mo | $239,000 | $218 | 51 |
| 2925 James Rd | 0.42mi | 3/1.5 | 1,320 (+10%) | 13mo | $280,000 | $212 | 51 |
| 2526 Genes Dr | 0.47mi | 3/1.0 | 1,318 (+10%) | 11mo | $249,000 | $189 | 48 |
| 2633 Genes Dr | 0.42mi | 3/1.0 | 1,100 (-8%) | 18mo | $192,000 | $175 | 47 |
| 2738 E Walton Blvd | 0.57mi | 3/2.0 | 1,098 (-8%) | 16mo | $228,000 | $208 | 46 |
| 2659 Hatton Rd | 0.72mi | 3/2.0 | 1,272 (+6%) | 12mo | $280,000 | $220 | 46 |
| 2835 Genes Dr | 0.49mi | 2/2.0 (-1) | 1,378 (+15%) | 8mo | $275,000 | $200 | 40 |
| 2896 James Rd | 0.43mi | 3/1.0 | 1,063 (-11%) | 22mo | $200,000 | $188 | 39 |
| 2436 Richwood Rd | 0.69mi | 2/1.0 (-1) | 1,085 (-10%) | 8mo | $202,500 | $187 | 36 |
| 2365 Walnut Rd | 0.72mi | 3/1.0 | 1,300 (+8%) | 16mo | $191,000 | $147 | 36 |
Match score weights: distance 35% · size 25% · config 20% · recency 20%. Top-matched comps best support the ARV.
Projected returns pro-forma
-3.0% appreciation · 0.0% rent growth · sell at horizon
- IRR
- —
- Equity multiple
- 6.71×
- Total profit
- $63,941
- Equity at exit
- $5,964
- IRR
- —
- Equity multiple
- 12.82×
- Total profit
- $132,411
- Equity at exit
- $3,458
Cash invested: $11,200 (down + closing). Projections, not guarantees.
Landlord ↔ Tenant lean methodology
- Overall (STATE)
- 62 Landlord-Friendly
- State Michigan
- 62 Landlord-Friendly · EVEN
- County
- — inherits STATE
- City
- — inherits STATE
ZIP-level market 48326
- Rents YoY
- -2.3%
- Active inventory
- 107
- Price-to-rent
- 1.8×
Monthly cashflow live
- Estimated rent
- $1,857 high interval (Pro) →
- Mortgage (P&I)
- −$210
- Tax est. 1.5%
- −$50 /mo · $600/yr
- Insurance
- −$17
- HOA
- −$0
- Vacancy / Maint / Mgmt
- −$390
- Net cashflow
- $1,191
Break-even live
Sensitivity live
| Price | -10% $1,218 | -5% $1,205 | +0% $1,191 | +5% $1,177 | +10% $1,163 |
|---|---|---|---|---|---|
| Rent | -10% $1,044 | -5% $1,117 | +0% $1,191 | +5% $1,264 | +10% $1,337 |
| Rate | -1.0pp $1,211 | -0.5pp $1,201 | base $1,191 | +0.5pp $1,180 | +1.0pp $1,170 |
UW: 25.0% down · 7.5% · 30yr · 1.5% tax · 5.0% vac · 8.0% maint · 8.0% mgmt
Financing live
Cash to close
- Down payment
- $10,000
- Closing costs
- $1,200
- Reserves months
- —
- Total cash needed
- —
Loan-product check · same deal, 3 products live
Conventional
25% down · 7.5% · 30yr
- Down + closing
- —
- Monthly P&I
- —
- Monthly cashflow
- —
- DSCR
- —
- Eligible?
- —
Personal DTI + credit; lowest rate.
DSCR
20% down · 8.5% · 30yr
- Down + closing
- —
- Monthly P&I
- —
- Monthly cashflow
- —
- DSCR
- —
- Eligible?
- —
No personal income docs; deal must DSCR.
Hard money
10% down · 12.0% · 12mo
- Down + closing
- —
- Monthly P&I
- —
- Monthly cashflow
- —
- DSCR
- —
- Eligible?
- —
Short-term bridge; refi at stabilization.
Rent comps 23 comps
| Address | Beds | Baths | Sqft | Rent | $/sqft | DOM | Units | Dist |
|---|---|---|---|---|---|---|---|---|
| 2830 Davison Ave Auburn Hills, MI | 2.0 | 2.0 | 1137 | $1,600 | $1.41 | 44d | 1 | 0.14mi |
| 2891 Olden Oak Ln Auburn Hills, MI | 1.0–2.0 | 1.0 | 900 | $1,350 | $1.50 | 2d | 9 | 0.29mi |
| 2610 Davison Ave Unit *22-2598 Auburn Hills, MI | 3.0 | 2.0 | 1200 | $3,150 | $2.62 | 44d | 1 | 0.35mi |
| 2610 Davison Ave Auburn Hills, MI | 2.0 | 2.0 | 1050 | $1,675 | $1.60 | 22d | 1 | 0.35mi |
| 2610 Davison Ave Auburn Hills, MI | 2.0 | 2.0 | 1050 | $1,450 | $1.38 | 3d | 1 | 0.35mi |
| 2610 Davison Ave Unit *17-2763 Auburn Hills, MI | 2.0 | 2.0 | 1100 | $1,725 | $1.57 | 44d | 1 | 0.35mi |
| 2610 Davison Ave Unit *17-2773 Auburn Hills, MI | 2.0 | 2.0 | 1050 | $1,475 | $1.40 | 44d | 1 | 0.35mi |
| 2610 Davison Ave Unit 14-2718 Auburn Hills, MI | 3.0 | 2.0 | 1200 | $2,150 | $1.79 | 24d | 1 | 0.35mi |
| 2610 Davison Ave Unit *22-2582 Auburn Hills, MI | 2.0 | 2.0 | 1100 | $2,050 | $1.86 | 22d | 1 | 0.35mi |
| 2610 Davison Ave Unit 22956 Auburn Hills, MI | 3.0 | 2.0 | 1200 | $2,175 | $1.81 | 44d | 1 | 0.35mi |
| 2610 Davison Ave Unit 20-2628 Auburn Hills, MI | 2.0 | 2.0 | 1050 | $1,650 | $1.57 | 44d | 1 | 0.35mi |
| 2040 Taylor Rd Auburn Hills, MI | 1.0–2.0 | 1.0–1.5 | 782 | $1,675 | $2.14 | 18d | 6 | 0.42mi |
| 3131 N Squirrel Rd Unit 1-126 Auburn Hills, MI | 2.0 | 1.0 | 800 | $1,317 | $1.65 | 24d | 1 | 0.64mi |
| 3474 Brookshear Cir Auburn Hills, MI | 1.0–3.0 | 1.0–1.5 | 800 | $1,600 | $2.00 | 2d | 1 | 0.75mi |
| 2748 Barrington Sq Auburn Hills, MI | 2.0 | 2.0 | 1178 | $2,150 | $1.83 | 2d | 1 | 0.91mi |
| 2688 Barrington Sq Auburn Hills, MI | 2.0 | 2.0 | 1193 | $1,995 | $1.67 | 10d | 1 | 0.92mi |
| 2676 Barrington Sq Auburn Hills, MI | 2.0 | 2.0 | 1209 | $1,895 | $1.57 | 2d | 1 | 0.95mi |
| 1221 Colony Ln Pontiac, MI | 1.0–2.0 | 1.0–1.5 | 950 | $1,250 | $1.32 | 2d | 3 | 1.06mi |
| 3300 5 Points Dr Auburn Hills, MI | 1.0–3.0 | 1.0–2.0 | 1095 | $2,369 | $2.16 | 2d | 16 | 1.09mi |
| 2651 Greenstone Blvd Auburn Hills, MI | 1.0–2.0 | 1.0–2.0 | 1013 | $1,660 | $1.64 | 2d | 3 | 1.26mi |
| 505 Old Oak Ct Unit 7 Pontiac, MI | 2.0 | 1.0 | 950 | $1,279 | $1.35 | 44d | 1 | 1.27mi |
| 505 Old Oak Ct Pontiac, MI | 2.0 | 1.0 | 1100 | $1,299 | $1.18 | 44d | 1 | 1.32mi |
| 2605 Greenstone Blvd Auburn Hills, MI | 1.0–2.0 | 1.0–2.0 | 792 | $1,575 | $1.99 | 4d | 3 | 1.34mi |
Listing history 16 events
-
2026-06-18days on market $40,000 Active 29 DOM
-
2026-06-17days on market $40,000 Active 28 DOM
-
2026-06-16days on market $40,000 Active 27 DOM
-
2026-06-15days on market $40,000 Active 26 DOM
-
2026-06-13days on market $40,000 Active 24 DOM
-
2026-06-13days on market $40,000 Active 23 DOM
-
2026-06-09days on market $40,000 Active 20 DOM
-
2026-06-08days on market $40,000 Active 19 DOM
-
2026-06-07days on market $40,000 Active 18 DOM
-
2026-06-04days on market $40,000 Active 15 DOM
-
2026-06-03days on market $40,000 Active 14 DOM
-
2026-06-02days on market $40,000 Active 13 DOM
-
2026-06-01days on market $40,000 Active 12 DOM
-
2026-05-31days on market $40,000 Active 11 DOM
-
2026-05-19$40,000 Active
Show marketing remark (841 chars)
Welcome to your next investment opportunity or the perfect starter home! This spacious 3-bedroom, 2-bath mobile home offers a functional layout with plenty of potential. Step through the front door into a welcoming living room, providing a comfortable space for relaxing or entertaining guests. The kitchen features an open layout with ample cabinet and counter space, creating a bright and inviting area for everyday living. The primary suite includes a large walk-in closet and a private bathroom complete with a tub. Two additional bedrooms and one additional full bathroom provide convenience and flexibility for family members or guests. Whether you're a first-time homebuyer, investor, or someone looking for a property you can personalize and make your own, this home is full of opportunity and potential. Schedule your showing today!
-
2026-05-19$40,000 Active 841-char remark
Show marketing remark (841 chars)
Welcome to your next investment opportunity or the perfect starter home! This spacious 3-bedroom, 2-bath mobile home offers a functional layout with plenty of potential. Step through the front door into a welcoming living room, providing a comfortable space for relaxing or entertaining guests. The kitchen features an open layout with ample cabinet and counter space, creating a bright and inviting area for everyday living. The primary suite includes a large walk-in closet and a private bathroom complete with a tub. Two additional bedrooms and one additional full bathroom provide convenience and flexibility for family members or guests. Whether you're a first-time homebuyer, investor, or someone looking for a property you can personalize and make your own, this home is full of opportunity and potential. Schedule your showing today!
ⓘ Source: listings_history table (triggers on properties + properties_extension) + one-shot
backfill from property_details.listing_events for pre-trigger history.
Nearby sold comps map
Loading sold comps map…
Walkable amenities ~0.75 mi
Loading nearby amenities…
Taxation est. · year 1
- Rental income
- $22,286
- − Mortgage interest
- −$2,241
- − Property taxes
- −$600
- − Insurance
- −$200
- − Repairs & maintenance
- −$1,783
- − Management
- −$1,783
- − Depreciation
- −$1,164
- Taxable income
- $14,516
- Est. tax owed @ 24.0%
- −$3,484
- After-tax cash flow
- $10,805/yr
For passive investors: Depreciation is non-cash, so a rental often shows a tax loss while cash-flowing — sheltering income. Rental losses are passive: they offset passive income freely, and up to $25,000/yr can offset ordinary (W-2) income if you actively participate and your MAGI is under $100k (phasing out to $0 by $150k); unused losses carry forward. On sale, claimed depreciation is recaptured at up to 25%, and gains may owe capital-gains tax (a 1031 exchange can defer both). Figures are a year-1 estimate at your 24.0% rate — not tax advice; consult a CPA.
Condition & rehab AI · 14 photos
This mobile home requires moderate repairs and maintenance to improve its condition and increase its value for resale or rental.
Repairs flagged
- Minor kitchen cabinets — slight wear
- Minor bathroom fixtures — standard fixtures
- Minor exterior siding — some wear
Value-add opportunities
- Resale paint interior walls — enhances curb appeal
- Resale replace carpeting — improves living space
- Resale repair exterior siding — enhances curb appeal
Renovation cost estimate screening
| Repair item | Severity | Est. cost |
|---|---|---|
| kitchen cabinets · slight wear | Minor | $500–3,000 |
| bathroom fixtures · standard fixtures | Minor | $500–3,000 |
| exterior siding · some wear | Minor | $500–3,000 |
| Total estimated repair cost · 3 items | $1,500–9,000 |
Value-add ROI direction
- Resale paint interior walls — enhances curb appeal ↑
- Resale replace carpeting — improves living space ↑
- Resale repair exterior siding — enhances curb appeal ↑
ⓘ Cost ranges are severity-bucket heuristics (US national rule-of-thumb). Get contractor quotes + a written scope before underwriting a rehab budget.
Schools (NCES district)
- District
- Pontiac City School District
- NCES district ID
- 2628740
- Math proficiency
- 8% ▼ -5.00%
- Reading proficiency
- 17% ▼ -3.00%
- Median HH income
- $33,888
- Composite
- 10.12/100
- National rank
- #9802
- State rank
- #514 of 540 in MI
Livability — Auburn Hills
- Score
- 76/100
- State rank
- #151
- US rank
- #3766
Category grades
Schools grade is shown separately in the Schools card above.
Census & demographics
- Census place
- Auburn Hills, MI
- County
- Oakland County · 1,009,092 people
- City population
- 24,514
- Metro
- Detroit-Warren-Dearborn, MI
- Population (ZIP)
- 24,514
- Household income
- $85,190
- Rent vs Own
- Severe rent burden
- 986.0
Population outlook (Oakland County) Hauer SSP2
- Today (2025)
- 1,335,747 people
- By 2030
- 1,375,100 · +2.9%
- By 2040
- 1,435,385 · +7.5%
- By 2050
- 1,469,250 · +10.0%
- By 2075
- 1,531,946 · +14.7%
- By 2100
- 1,450,485 · +8.6%
Race, ethnicity, and origin ACS 2023
- Neighborhood character
- Diverse neighborhood (Simpson 0.64)
- Race & ethnicity
- White 56% Asian 15% Black 11% Hispanic / Latino 11% Two or more races 11%
- Hispanic origin (detail)
- Mexican 7% Puerto Rican 2%
- Common ancestry
- Romanian 6% Slovak 2% Lithuanian 2%
- Foreign-born
- 19% · Canada, China, Jamaica
- Languages at home
- 76% English-only · Spanish 8% Other Indo-European 6% Other Asian/Pacific 4%
Political lean MEDSL · Oakland
- 2024 margin
- D (+10.6) · D 54.4% · R 43.8% · Other 1.9%
- 2008→2024 swing
- -3.9pp toward R · 2008: 14.5pp · 2024: 10.6pp
- All cycles
- 2024: D+10.6 2020: D+14.1 2016: D+8.1 2012: D+8.1 2008: D+14.5
Not yet ingested
- Civics
- —
Market trends
- HPI YoY
- ▼ -298.32%
- Current HPI
- 178.7685
- Rent YoY
- ▼ -2.27%
- Metro
- Detroit-Warren-Dearborn, MI
- State GDP YoY
- ▲ 1.37%
- F500 in state
- 28
Industry mix (Fortune 500 HQ in MI)
| Industry | F500 HQs | Revenue |
|---|---|---|
| Automotive Parts | 3 | $48B |
|
||
| Automotive | 2 | $372B |
|
||
| Chemicals | 1 | $45B |
|
||
| Automotive Retail | 1 | $29B |
|
||
| Healthcare / Medical Devices | 1 | $23B |
|
||
| Automotive Technology | 1 | $20B |
|
||
Price history
+0.0% since first listed2 events — show timeline
- 2026-05-19 Listed $40,000 MiRealSource-MiMLS
- 2026-05-19 Listed $40,000 REALCOMP
Cash-flow waterfall
monthlySold comps — $/sqft
last 12 mo · ≤1 miLoading sold comps…