 Multi-family
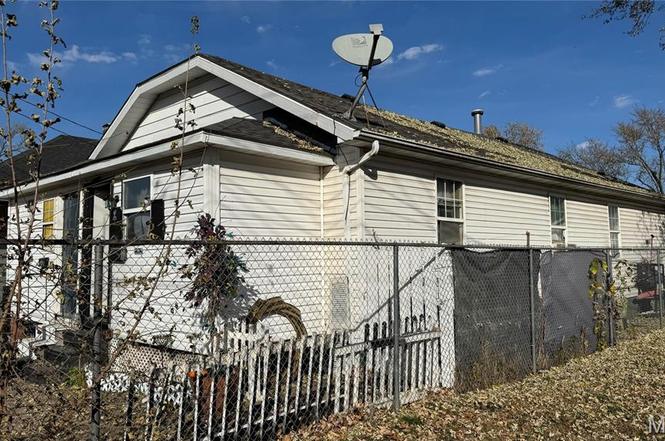
187 Goulding St · East Alton, IL
Flood risk 1/10 · Minimal
- FEMA flood zone
- X
- Chance of flooding over 30 yrs
- 0.0%
- Est. flood insurance / yr
- $473 – $860
Fire risk 1/10 · Minimal
- Est. fire insurance / yr
- $804 – $1,492
Heat risk 5/10 · Moderate
- Hot days now (above 106°F)
- 7 days/yr
- Hot days in 30 yrs
- 20 days/yr
Wind risk 2/10 · Minimal
- Chance of severe wind over 30 yrs
- 1.0%
Air-quality risk 3/10 · Minor
- Unhealthy air days now
- 2 days/yr
- Unhealthy air days in 30 yrs
- 4 days/yr
Risk factors via First Street. Map © Google.
Why this score? — see what drove the D grade
The composite is a weighted blend of 9 inputs, each scored 0–100. Each bar is that input's sub-score; the figure is the points it added to the 100-point composite (weight × sub-score).
- Cash flow +15.0/30.0
- ARV discount +7.5/15.0
- 1% rule +5.0/10.0
- DSCR +5.0/10.0
- Livability +3.5/5.0
- Rent growth +2.5/5.0
- Condition / age +2.5/5.0
- Schools +1.6/10.0
- Appreciation +0.0/10.0
$54,900
🖨 Deal sheet 📄 Offer letter ✓ Due diligence
Multi-family units
County records classify this as Multi-Family (2-4 Unit). Listing-text estimate: 1 unit. estimate disagrees with records
Listing remarks
GREAT INVESTMENT!!! Duplex and single family, total of 3 units. VACANT AND READY FOR REHAB!!! Separate electric, water and gas meters, no utility expenses! Close to a big city!!! CHEAP TO MAINTAIN!!! PROPERTY WILL GENERATE A 23%+ NET RETURN ON INVESTMENT!!! OVER $30K IN VALUE ADD!!! Do not miss out on this investment opportunity.
Key facts
- 4,499 sq ft lot
- Built 1920
- Listed 204 days
Property features AI
Finance
- Other: Two total units; Approximately 1,288 total living area (owner-reported); Lot size ~0.1033 acres
- Financial info: Seller may consider concessions
Exterior
- Home design: Residential income property (2–4 units); Duplex
- Construction: Vinyl siding; Asphalt roof; Brick/mortar foundation; Built area reported by owner
Interior
- Kitchen: Cooktop
- Bedrooms: No bedrooms listed
- Flooring: Ceramic tile
- Bathrooms: No bathrooms listed
- Heating & cooling: Wall/Window Unit(s)
- Interior features: Cooktop; Ceramic tile flooring; Wall/window air conditioning units
Neighborhood map
What this means for you Summary
Snapshot
- This is a 2-bed/?-bath multifamily listed at $55k.
Deal economics
- At list price, monthly cash flow is $1k ($18k/yr) — positive.
- The deal already cash-flows at list — no discount required.
- Meets the 1% rule at list price ($2k rent vs $55k).
- Recommended offer: $48k (12.0% below list) — sets the bar for market timing.
Location & tenants
- Location reads 69/100 on livability (#418 in IL) — a middle-class / working-renter tenant base. Strengths: cost of living A+, housing A+; Watch: commute D+, crime D, amenities F.
- East Alton-Wood River Chsd 14 (suburban): math 10% / reading 20% proficiency, ranked #793 of 919 in IL (top 86%) — low school quality limits family demand, transient renter base, plan for 1-2y turnover.
- Zoned schools: East Alton-Wood River High Sch (math 8% / reading 12%, grade F, #567 of 693 statewide, top 83%, 537 students, 0% FRL).
- Market conditions: 38 active listings in the ZIP; 4 comparable units currently listed for rent nearby; rentals leasing fast (median 4d on market — plan ~1-2 weeks tenant-placement turnaround); 336 units permitted in Madison County in 2024 (0 in 5+ unit buildings).
Forward outlook
- Local home prices are declining (-3.0%/yr); year-one equity from $380 of loan paydown is wiped out by about $2k of value loss. Plan a longer hold.
- Madison County population projected at -18% by 2050 — secular population decline; favor cash flow + early exit over multi-decade hold.
- At projected returns (-3.0% appreciation + 3.0% rent growth), your $15k cash investment doubles in ~1 year — after that, you're playing with house money.
Negotiation context
- It's been on market 204 days — a 12% lower offer ($48k) is reasonable based on typical stale-listing flexibility.
- Current owner paid $22k; list at $55k implies a 144% gain — meaningful room to come down on a strong offer.
Risks & watch-outs
- Watch-outs: property tax is 2.7% of price; built in 1920 — expect roof / HVAC / electrical / plumbing capex.
- Climate carrying-cost: extreme-heat days projected 7→20/yr by 2055 (HVAC capex compounding) — expect insurance premiums to compound above CPI over the hold.
Questions for the listing agent
- It's been on market 204 days. Have you received any prior offers? Is the seller open to a 12% concession, seller financing, or rate buy-down credit?
- Built in 1920 — when were the roof, HVAC, electrical panel, plumbing, and water heater last replaced?
- Property tax is high relative to price — has the assessment been appealed recently, and will the sale trigger a re-assessment?
- Why hasn't it sold? Are there any deal-killer items the seller is aware of (foundation, flood, title, zoning, code violations)?
- Is there a deadline driving the sale (1031 exchange, divorce, estate, relocation)? That informs how much negotiation room exists.
- Schools are F-rated, which usually means shorter tenancies and higher turnover. Who's the typical renter profile here, and what's been the actual vacancy rate?
- Crime grade is D in this area — have there been break-ins, vandalism, or insurance claims at this property in the last 3 years? What carrier currently insures it and at what premium?
- The area grade is low — what's the realistic commute time and amenity access for the typical tenant pool here? Any planned neighborhood developments (good or bad) we should know about?
- What's the average days-on-market for RENTAL listings here right now (not sales)? A rising rental-DOM trend means longer vacancies and softer asking-rent achievability than the comps imply.
- What's the recent tenant-quality profile in this submarket — average credit score on applications, eviction rate, late-payment / NSF rate, and stable-employment percentage? A property-management company in the area should have these aggregated.
- How much new apartment / multifamily construction is in the pipeline within 1–3 miles? Heavy new supply (>2% of stock underway) typically softens rents 12–24 months out; light construction supports rent growth.
Investment metrics
- 1% rule
- 4.46% ✓
- Cap rate
- 39.01%
- Cash-on-cash
- 116.86%
- DSCR
- 6.20
- GRM
- 1.9
CMA / ARV
No comps found within radius.
Projected returns pro-forma
-3.0% appreciation · 3.0% rent growth · sell at horizon
- IRR
- —
- Equity multiple
- 6.63×
- Total profit
- $86,515
- Equity at exit
- $8,186
- IRR
- —
- Equity multiple
- 13.91×
- Total profit
- $198,393
- Equity at exit
- $4,747
Cash invested: $15,372 (down + closing). Projections, not guarantees.
Landlord ↔ Tenant lean methodology
- Overall (STATE)
- 43 Moderately Tenant-Leaning
- State Illinois
- 43 Moderately Tenant-Leaning · D+7
- County
- — inherits STATE
- City
- — inherits STATE
ZIP-level market 62024
- Home prices YoY
- -18.8%
- Active inventory
- 38
- Price-to-rent
- 5.6×
Monthly cashflow live
- Estimated rent
- $2,447 medium interval (Pro) →
- Mortgage (P&I)
- −$288
- Tax from tax record
- −$125 /mo · $1,505/yr
- Insurance
- −$23
- HOA
- −$0
- Vacancy / Maint / Mgmt
- −$514
- Net cashflow
- $1,497
Break-even live
3-unit breakdown (identical units grouped — click to expand)
| Units | Beds | Baths | Est. rent |
|---|---|---|---|
| 3× units | 2 | 1.5 | $2,448 |
| #1 | 2 | 1.5 | $816 |
| #2 | 2 | 1.5 | $816 |
| #3 | 2 | 1.5 | $816 |
| Total (3 units) | $2,447 | ||
UW: 25.0% down · 7.5% · 30yr · 1.5% tax · 5.0% vac · 8.0% maint · 8.0% mgmt
Financing live
Cash to close
- Down payment
- $13,725
- Closing costs
- $1,647
- Reserves months
- —
- Total cash needed
- —
Loan-product check · same deal, 3 products live
Conventional
25% down · 7.5% · 30yr
- Down + closing
- —
- Monthly P&I
- —
- Monthly cashflow
- —
- DSCR
- —
- Eligible?
- —
Personal DTI + credit; lowest rate.
DSCR
20% down · 8.5% · 30yr
- Down + closing
- —
- Monthly P&I
- —
- Monthly cashflow
- —
- DSCR
- —
- Eligible?
- —
No personal income docs; deal must DSCR.
Hard money
10% down · 12.0% · 12mo
- Down + closing
- —
- Monthly P&I
- —
- Monthly cashflow
- —
- DSCR
- —
- Eligible?
- —
Short-term bridge; refi at stabilization.
Rent comps 4 comps
| Address | Beds | Baths | Sqft | Rent | $/sqft | DOM | Units | Dist |
|---|---|---|---|---|---|---|---|---|
| 176 S Pence St East Alton, IL | 2.0 | 1.0 | 1000 | $1,100 | $1.10 | 1d | 1 | 0.03mi |
| 140 Illinois St East Alton, IL | 2.0 | 1.0 | 960 | $695 | $0.72 | 1d | 1 | 0.60mi |
| 121 Cardot St East Alton, IL | 3.0 | 1.0 | 937 | $1,200 | $1.28 | 21d | 1 | 0.87mi |
| 3400 Milton Dr Alton, IL | 2.0 | 1.5 | 972 | $1,350 | $1.39 | 4d | 1 | 1.33mi |
Listing history 18 events
-
2026-06-18days on market $54,900 Active 204 DOM
-
2026-06-17days on market $54,900 Active 203 DOM
-
2026-06-16days on market $54,900 Active 202 DOM
-
2026-06-15days on market $54,900 Active 201 DOM
-
2026-06-13days on market $54,900 Active 199 DOM
-
2026-06-12days on market $54,900 Active 198 DOM
-
2026-06-09days on market $54,900 Active 195 DOM
-
2026-06-08days on market $54,900 Active 194 DOM
-
2026-06-07days on market $54,900 Active 193 DOM
-
2026-06-05days on market $54,900 Active 191 DOM
-
2026-06-03days on market $54,900 Active 189 DOM
-
2026-06-02days on market $54,900 Active 188 DOM
-
2026-06-01days on market $54,900 Active 187 DOM
-
2026-05-31days on market $54,900 Active 186 DOM
-
2026-04-14price $54,900
-
2025-11-26$79,900 Active
-
2025-11-10soldstatus $22,500
-
2022-10-03soldstatus $20,000
ⓘ Source: listings_history table (triggers on properties + properties_extension) + one-shot
backfill from property_details.listing_events for pre-trigger history.
Tax reassessment forecast IL · Partial reset (capped growth)
- Current annual tax
- $1,505 · $125/mo
- Projected year-2 tax
- $1,505 · $125/mo
- Expected delta
- $0/yr ($0/mo · 0.0%)
ⓘ Screening estimate from a state-policy table — verify with the county assessor before closing.
Climate risk First Street
- Flood 1/10 Low FEMA zone X · 0% chance over 30 yrs
- Wildfire 1/10 Low
- Heat 5/10 Major 7 d/yr ≥106°F today · 20 d/yr by 30 yrs out
- Wind 2/10 Low 100% chance of damaging wind over 30 yrs
- Air quality 3/10 Moderate 2 unhealthy d/yr today · 4 by 30 yrs out
Nearby sold comps map
Loading sold comps map…
Walkable amenities ~0.75 mi
Loading nearby amenities…
Taxation est. · year 1
- Rental income
- $29,364
- − Mortgage interest
- −$3,075
- − Property taxes
- −$1,505
- − Insurance
- −$274
- − Repairs & maintenance
- −$2,349
- − Management
- −$2,349
- − Depreciation
- −$1,597
- Taxable income
- $18,214
- Est. tax owed @ 24.0%
- −$4,371
- After-tax cash flow
- $13,592/yr
For passive investors: Depreciation is non-cash, so a rental often shows a tax loss while cash-flowing — sheltering income. Rental losses are passive: they offset passive income freely, and up to $25,000/yr can offset ordinary (W-2) income if you actively participate and your MAGI is under $100k (phasing out to $0 by $150k); unused losses carry forward. On sale, claimed depreciation is recaptured at up to 25%, and gains may owe capital-gains tax (a 1031 exchange can defer both). Figures are a year-1 estimate at your 24.0% rate — not tax advice; consult a CPA.
Schools (NCES district)
- District
- East Alton-Wood River Chsd 14
- NCES district ID
- 1712990
- Math proficiency
- 10% ▬ 0.00%
- Reading proficiency
- 20% ▬ 0.00%
- Median HH income
- $35,977
- Composite
- 15.86/100
- National rank
- #14315
- State rank
- #793 of 919 in IL
Livability — East Alton
- Score
- 69/100
- State rank
- #418
- US rank
- #8569
Category grades
Schools grade is shown separately in the Schools card above.
Census & demographics
- Census place
- East Alton, IL
- City population
- 9,465
- Population (ZIP)
- 9,465
Population outlook (Madison County) Hauer SSP2
- Today (2025)
- 258,371 people
- By 2030
- 251,523 · -2.7%
- By 2040
- 233,640 · -9.6%
- By 2050
- 213,042 · -17.5%
- By 2075
- 165,255 · -36.0%
- By 2100
- 123,953 · -52.0%
Race, ethnicity, and origin ACS 2023
- Neighborhood character
- Predominantly White (93%)
- Race & ethnicity
- White 93% Two or more races 5% Hispanic / Latino 2% Black 1%
- Common ancestry
- Lithuanian 4% Iranian 2% Italian 1%
- Foreign-born
- 0%
Political lean MEDSL · Madison
- 2024 margin
- R (+13.3) · D 42.5% · R 55.8% · Other 1.8%
- 2008→2024 swing
- -22.5pp toward R · 2008: 9.2pp · 2024: -13.3pp
- All cycles
- 2024: R+13.3 2020: R+13.2 2016: R+15.6 2012: R+1.4 2008: D+9.2
Not yet ingested
- Civics
- —
Market trends
- HPI YoY
- ▼ -50.18%
- Current HPI
- 216.1273
- Rent YoY
- —
- Metro
- —
- State GDP YoY
- ▲ 1.59%
- F500 in state
- 60
Industry mix (Fortune 500 HQ in IL)
| Industry | F500 HQs | Revenue |
|---|---|---|
| Insurance | 4 | $201B |
|
||
| Consumer Goods | 4 | $87B |
|
||
| Industrial Machinery | 3 | $64B |
|
||
| Healthcare | 2 | $55B |
|
||
| Retail / Pharmacy | 1 | $148B |
|
||
| Agriculture / Food | 1 | $86B |
|
||
Price history
+174.5% since first listed4 events — show timeline
- 2026-04-14 Price Changed $54,900 MARIS as Distributed by MLS Grid
- 2025-11-26 Listed $79,900 MARIS as Distributed by MLS Grid
- 2025-11-10 Sold (Public Records) $22,500 Public Records
- 2022-10-03 Sold (Public Records) $20,000 Public Records
Property tax history
+2.8%/yrLatest (2024): $1,505 · +5.4% YoY. Source: county tax records.
Cash-flow waterfall
monthlySold comps — $/sqft
last 12 mo · ≤1 miLoading sold comps…