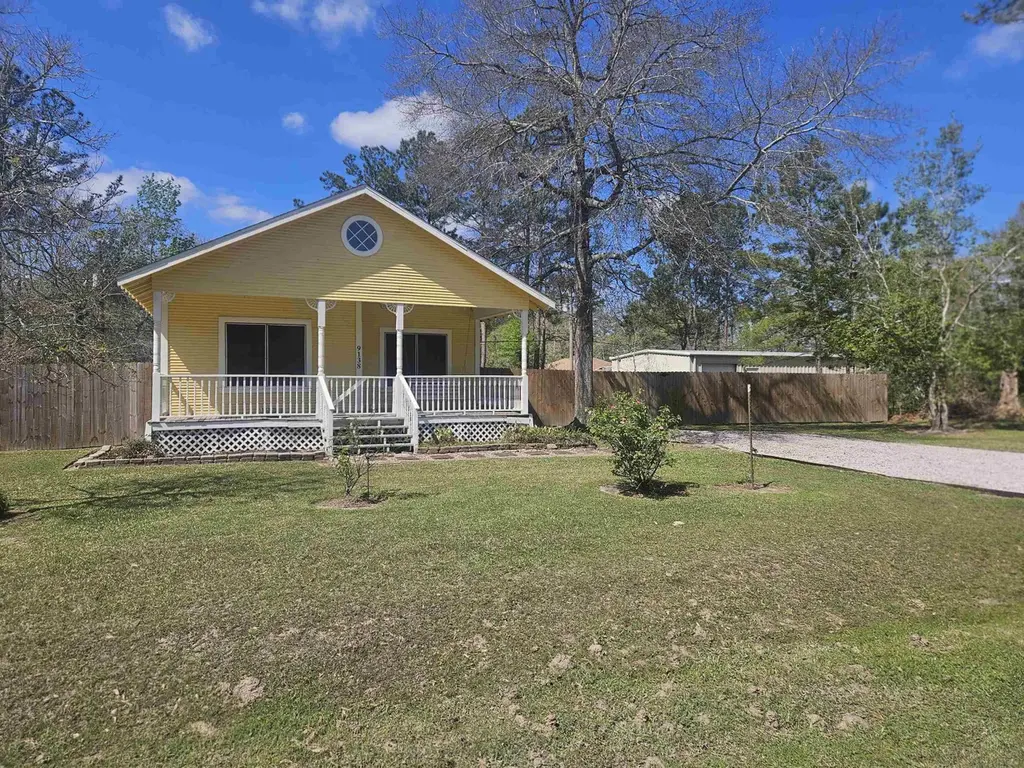
9138 Chestnut St · Lumberton, TX
Flood risk 3/10 · Minor
- FEMA flood zone
- X (unshaded)
- Chance of flooding over 30 yrs
- 0.2%
- Est. flood insurance / yr
- $507 – $1,088
Fire risk 2/10 · Minimal
- Est. fire insurance / yr
- $1,222 – $2,270
Heat risk 9/10 · Severe
- Hot days now (above 111°F)
- 7 days/yr
- Hot days in 30 yrs
- 24 days/yr
Wind risk 9/10 · Severe
- Chance of severe wind over 30 yrs
- 99.0%
Air-quality risk 2/10 · Minimal
- Unhealthy air days now
- 1 days/yr
- Unhealthy air days in 30 yrs
- 1 days/yr
Risk factors via First Street. Map © Google.
Why this score? — see what drove the C grade
The composite is a weighted blend of 9 inputs, each scored 0–100. Each bar is that input's sub-score; the figure is the points it added to the 100-point composite (weight × sub-score).
- Cash flow +22.4/30.0
- ARV discount +8.3/15.0
- DSCR +7.2/10.0
- 1% rule +5.2/10.0
- Schools +4.3/10.0
- Livability +3.8/5.0
- Rent growth +2.5/5.0
- Condition / age +2.5/5.0
- Appreciation +0.0/10.0
$185,000
🖨 Deal sheet (PDF) 📄 Offer letter ✓ Due diligence
Listing remarks MLS
Don't miss out on this charming 3 bedroom 1 bath home sitting on a large fenced yard with landscaping and trees meticulously placed throughout. Located centrally to shopping, restaurants, with quick access to the highway!
Key facts
- Large fenced yard
- Centrally located
- Listed 91 days
Tags
Neighborhood map
What this means for you Summary
Snapshot
- This is a 3-bed/1.0-bath single-family listed at $185k.
Deal economics
- At list price, monthly cash flow is $309 ($4k/yr) — positive.
- The deal already cash-flows at list — no discount required.
- Meets the 1% rule at list price ($2k rent vs $185k).
- Recommended offer: $168k (9.0% below list) — sets the bar for market timing.
- Cap rate 8.3% vs local median 3.2% in Lumberton — top-decile yield for the area; either an underpriced asset or a hidden risk that comps aren't pricing in. Stress-test before assuming the spread holds.
Location & tenants
- Location reads 75/100 on livability (#160 in TX, #4,326 nationally) — a middle-class / working-renter tenant base. Strengths: crime A+, employment A+, cost of living A+; Watch: amenities F, commute F.
- Lumberton ISD (suburban): math 48% / reading 50% proficiency, ranked #173 of 826 in TX (top 21%) — families likely to look elsewhere, expect single-tenant / working-renter base with shorter leases.
- Zoned schools: Lumberton Pri (math 54% / reading 58%, grade C+, #574 of 4,322 statewide, top 14%, 982 students, 43% FRL); Lumberton Middle (math 47% / reading 51%, grade C-, #378 of 1,662 statewide, top 23%, 969 students, 35% FRL); Lumberton H S (math 55% / reading 61%, grade C, #320 of 1,632 statewide, top 20%, 1,229 students, 30% FRL).
- Market conditions: 318 active listings in the ZIP; 6 comparable units currently listed for rent nearby; rentals at typical pace (median 25d on market — plan ~3-4 weeks tenant-placement turnaround); solid renter incomes; 358 units permitted in Hardin County in 2024 (0 in 5+ unit buildings).
Forward outlook
- Local home prices are declining (-3.0%/yr); year-one equity from $1k of loan paydown is wiped out by about $6k of value loss. Plan a longer hold.
Negotiation context
- It's been on market 91 days — a 9% lower offer ($168k) is reasonable based on typical stale-listing flexibility.
- 2 sale attempts with the ask held roughly flat each time — persistent listings suggest the price (not the market) is what's stuck; bring a comps-based counter.
Risks & watch-outs
- Watch-outs: built in 1945 — expect roof / HVAC / electrical / plumbing capex.
- Climate carrying-cost: severe wind risk, 99% chance of damaging wind over 30y; extreme-heat days projected 7→24/yr by 2055 (HVAC capex compounding) — expect insurance premiums to compound above CPI over the hold.
Questions for the listing agent
- It's been on market 91 days. Have you received any prior offers? Is the seller open to a 9% concession, seller financing, or rate buy-down credit?
- Built in 1945 — when were the roof, HVAC, electrical panel, plumbing, and water heater last replaced?
- Why hasn't it sold? Are there any deal-killer items the seller is aware of (foundation, flood, title, zoning, code violations)?
- Is there a deadline driving the sale (1031 exchange, divorce, estate, relocation)? That informs how much negotiation room exists.
- What's the average days-on-market for RENTAL listings here right now (not sales)? A rising rental-DOM trend means longer vacancies and softer asking-rent achievability than the comps imply.
- What's the recent tenant-quality profile in this submarket — average credit score on applications, eviction rate, late-payment / NSF rate, and stable-employment percentage? A property-management company in the area should have these aggregated.
- How much new for-sale + rental construction is in the pipeline within 1–3 miles? Heavy new supply typically softens prices + rents 12–24 months out; constrained supply supports both.
Investment metrics
- 1% rule
- 1.02% ✓
- Cap rate
- 8.30%
- Cash-on-cash
- 7.15%
- DSCR
- 1.32
- GRM
- 8.2
CMA / ARV
- ARV (median comp)
- $188,199
- List price
- $185,000
- Delta
- -1.70%
- Verdict
- FAIR
- Comps
- 11 within 1.0 mi
Show comp detail 2 sales within ~0.75 mi
| Address | Dist | Beds/Ba | Sqft | Sold | Price | $/sf | Match |
|---|---|---|---|---|---|---|---|
| 8483 Wingfield Dr | 0.12mi | 2/2.0 (-1) | 1,440 (+10%) | 3mo | $225,000 | $156 | 66 |
| 8801 Mitchell Rd | 0.58mi | 3/2.0 | 1,352 (+3%) | 17mo | $200,000 | $148 | 49 |
Match score weights: distance 35% · size 25% · config 20% · recency 20%. Top-matched comps best support the ARV.
Projected returns pro-forma
-3.0% appreciation · 3.0% rent growth · sell at horizon
- IRR
- -5.4%
- Equity multiple
- 0.80×
- Total profit
- $-10,341
- Equity at exit
- $27,584
- IRR
- 4.3%
- Equity multiple
- 1.31×
- Total profit
- $16,196
- Equity at exit
- $15,995
Cash invested: $51,800 (down + closing). Projections, not guarantees.
Landlord ↔ Tenant lean methodology
- Overall (STATE)
- 87 Strongly Landlord-Friendly
- State Texas
- 87 Strongly Landlord-Friendly · R+5
- County
- — inherits STATE
- City
- — inherits STATE
ZIP-level market 77657
- Active inventory
- 318
- Price-to-rent
- 8.2×
Monthly cashflow live
- Estimated rent
- $1,888 high interval (Pro) →
- Mortgage (P&I)
- −$970
- Tax from tax record
- −$136 /mo · $1,630/yr
- Insurance
- −$77
- HOA
- −$0
- Vacancy / Maint / Mgmt
- −$397
- Net cashflow
- $309
Break-even live
Sensitivity live
| Price | -10% $414 | -5% $361 | +0% $309 | +5% $256 | +10% $204 |
|---|---|---|---|---|---|
| Rent | -10% $160 | -5% $234 | +0% $309 | +5% $383 | +10% $458 |
| Rate | -1.0pp $402 | -0.5pp $356 | base $309 | +0.5pp $261 | +1.0pp $212 |
UW: 25.0% down · 7.5% · 30yr · 1.5% tax · 5.0% vac · 8.0% maint · 8.0% mgmt
Financing live
Cash to close
- Down payment
- $46,250
- Closing costs
- $5,550
- Reserves months
- —
- Total cash needed
- —
Loan-product check · same deal, 3 products live
Conventional
25% down · 7.5% · 30yr
- Down + closing
- —
- Monthly P&I
- —
- Monthly cashflow
- —
- DSCR
- —
- Eligible?
- —
Personal DTI + credit; lowest rate.
DSCR
20% down · 8.5% · 30yr
- Down + closing
- —
- Monthly P&I
- —
- Monthly cashflow
- —
- DSCR
- —
- Eligible?
- —
No personal income docs; deal must DSCR.
Hard money
10% down · 12.0% · 12mo
- Down + closing
- —
- Monthly P&I
- —
- Monthly cashflow
- —
- DSCR
- —
- Eligible?
- —
Short-term bridge; refi at stabilization.
Rent comps 6 comps
| Address | Beds | Baths | Sqft | Rent | $/sqft | DOM | Units | Dist |
|---|---|---|---|---|---|---|---|---|
| 8445 Harvard St Lumberton, TX | 3.0 | 2.5 | 1295 | $1,790 | $1.38 | 25d | 1 | 0.10mi |
| 9006 Duke St Lumberton, TX | 3.0 | 2.0 | 1064 | $1,400 | $1.32 | 45d | 1 | 0.18mi |
| 9440 Hickory St Lumberton, TX | 2.0 | 2.0 | 1250 | $1,500 | $1.20 | 45d | 1 | 0.35mi |
| 9440 Hickory St Lumberton, TX | 2.0 | 2.0 | 1200 | $1,500 | $1.25 | 25d | 1 | 0.35mi |
| 110 Azaelia Dr Lumberton, TX | 2.0 | 2.0 | 1380 | $1,650 | $1.20 | 15d | 1 | 0.95mi |
| 9984 Golden Ln Lumberton, TX | 2.0 | 1.5 | 1001 | $1,575 | $1.57 | 15d | 1 | 0.95mi |
Listing history 19 events
-
2026-06-18days on market $185,000 Active 91 DOM
-
2026-06-17days on market $185,000 Active 90 DOM
-
2026-06-16days on market $185,000 Active 89 DOM
-
2026-06-15days on market $185,000 Active 88 DOM
-
2026-06-14days on market $185,000 Active 86 DOM
-
2026-06-10days on market $185,000 Active 83 DOM
-
2026-06-09days on market $185,000 Active 82 DOM
-
2026-06-08days on market $185,000 Active 81 DOM
-
2026-06-07days on market $185,000 Active 80 DOM
-
2026-06-05days on market $185,000 Active 77 DOM
-
2026-06-03days on market $185,000 Active 76 DOM
-
2026-06-02days on market $185,000 Active 75 DOM
-
2026-06-01days on market $185,000 Active 74 DOM
-
2026-05-31days on market $185,000 Active 73 DOM
-
2026-05-30days on market $185,000 Active 72 DOM
-
2026-03-21status Active 221-char remark
Show marketing remark (221 chars)
Don't miss out on this charming 3 bedroom 1 bath home sitting on a large fenced yard with landscaping and trees meticulously placed throughout. Located centrally to shopping, restaurants, with quick access to the highway!
-
2026-03-16status Pending 221-char remark
Show marketing remark (221 chars)
Don't miss out on this charming 3 bedroom 1 bath home sitting on a large fenced yard with landscaping and trees meticulously placed throughout. Located centrally to shopping, restaurants, with quick access to the highway!
-
2026-03-14$185,000 Active 221-char remark
Show marketing remark (221 chars)
Don't miss out on this charming 3 bedroom 1 bath home sitting on a large fenced yard with landscaping and trees meticulously placed throughout. Located centrally to shopping, restaurants, with quick access to the highway!
-
2006-07-25soldstatus
ⓘ Source: listings_history table (triggers on properties + properties_extension) + one-shot
backfill from property_details.listing_events for pre-trigger history.
Tax reassessment forecast TX · Resets to sale price
- Current annual tax
- $1,630 · $136/mo
- Projected year-2 tax
- $3,386 · $282/mo
- Expected delta
- +$1,755/yr (+$146/mo · 107.6%)
ⓘ Screening estimate from a state-policy table — verify with the county assessor before closing.
Climate risk First Street
- Flood 3/10 Moderate FEMA zone X (unshaded) · 20% chance over 30 yrs
- Wildfire 2/10 Low
- Heat 9/10 Extreme 7 d/yr ≥111°F today · 24 d/yr by 30 yrs out
- Wind 9/10 Extreme 99% chance of damaging wind over 30 yrs
- Air quality 2/10 Low 1 unhealthy d/yr today · 1 by 30 yrs out
Nearby sold comps map
Loading sold comps map…
Walkable amenities ~0.75 mi
Loading nearby amenities…
Taxation est. · year 1
- Rental income
- $22,662
- − Mortgage interest
- −$10,363
- − Property taxes
- −$1,630
- − Insurance
- −$925
- − Repairs & maintenance
- −$1,813
- − Management
- −$1,813
- − Depreciation
- −$5,382
- Taxable income
- $736
- Est. tax owed @ 24.0%
- −$177
- After-tax cash flow
- $3,529/yr
For passive investors: Depreciation is non-cash, so a rental often shows a tax loss while cash-flowing — sheltering income. Rental losses are passive: they offset passive income freely, and up to $25,000/yr can offset ordinary (W-2) income if you actively participate and your MAGI is under $100k (phasing out to $0 by $150k); unused losses carry forward. On sale, claimed depreciation is recaptured at up to 25%, and gains may owe capital-gains tax (a 1031 exchange can defer both). Figures are a year-1 estimate at your 24.0% rate — not tax advice; consult a CPA.
Schools (NCES district)
- District
- Lumberton ISD
- NCES district ID
- 4813530
- Math proficiency
- 48% ▼ -5.00%
- Reading proficiency
- 50% ▼ -4.00%
- Median HH income
- $62,996
- Composite
- 43.2/100
- National rank
- #3063
- State rank
- #173 of 826 in TX
Livability — Lumberton
- Score
- 75/100
- State rank
- #160
- US rank
- #4326
Category grades
Schools grade is shown separately in the Schools card above.
Census & demographics
- County
- Hardin County · 39,783 people
- City population
- 22,258
- Metro
- Beaumont-Port Arthur, TX
- Population (ZIP)
- 22,258
- Household income
- $95,718
- Rent vs Own
- Severe rent burden
- 147.0
Population outlook (Hardin County) Hauer SSP2
- Today (2025)
- 57,780 people
- By 2030
- 58,296 · +0.9%
- By 2040
- 58,421 · +1.1%
- By 2050
- 57,391 · -0.7%
- By 2075
- 53,132 · -8.0%
- By 2100
- 44,905 · -22.3%
Race, ethnicity, and origin ACS 2023
- Neighborhood character
- Predominantly White (89%)
- Race & ethnicity
- White 89% Hispanic / Latino 5% Two or more races 5%
- Hispanic origin (detail)
- Mexican 4%
- Common ancestry
- Lithuanian 10% Serbian 3% Slovak 2%
- Foreign-born
- 2% · Canada
- Languages at home
- 97% English-only · Spanish 2%
Political lean MEDSL · Hardin
- 2024 margin
- Solid R (+75.8) · D 11.9% · R 87.7%
- 2008→2024 swing
- -14.6pp toward R · 2008: -61.2pp · 2024: -75.8pp
- All cycles
- 2024: R+75.8 2020: R+73.8 2016: R+73.9 2012: R+67.6 2008: R+61.2
Not yet ingested
- Civics
- —
Market trends
- HPI YoY
- ▼ -160.56%
- Current HPI
- 156.2265
- Rent YoY
- —
- Metro
- Beaumont-Port Arthur, TX
- State GDP YoY
- ▲ 3.95%
- F500 in state
- 110
Industry mix (Fortune 500 HQ in TX)
| Industry | F500 HQs | Revenue |
|---|---|---|
| Energy | 16 | $1,198B |
|
||
| Technology | 5 | $198B |
|
||
| Engineering / Construction | 4 | $72B |
|
||
| Energy Services | 3 | $60B |
|
||
| Utilities | 3 | $41B |
|
||
| Healthcare | 2 | $330B |
|
||
Price history
4 events — show timeline
- 2026-03-21 Relisted — BBOR
- 2026-03-16 Pending — BBOR
- 2026-03-14 Listed $185,000 BBOR
- 2006-07-25 Sold (Public Records) — Public Records
Property tax history
+1.8%/yrLatest (2025): $1,630 · -0.8% YoY. Source: county tax records.
Cash-flow waterfall
monthlySold comps — $/sqft
last 12 mo · ≤1 miLoading sold comps…