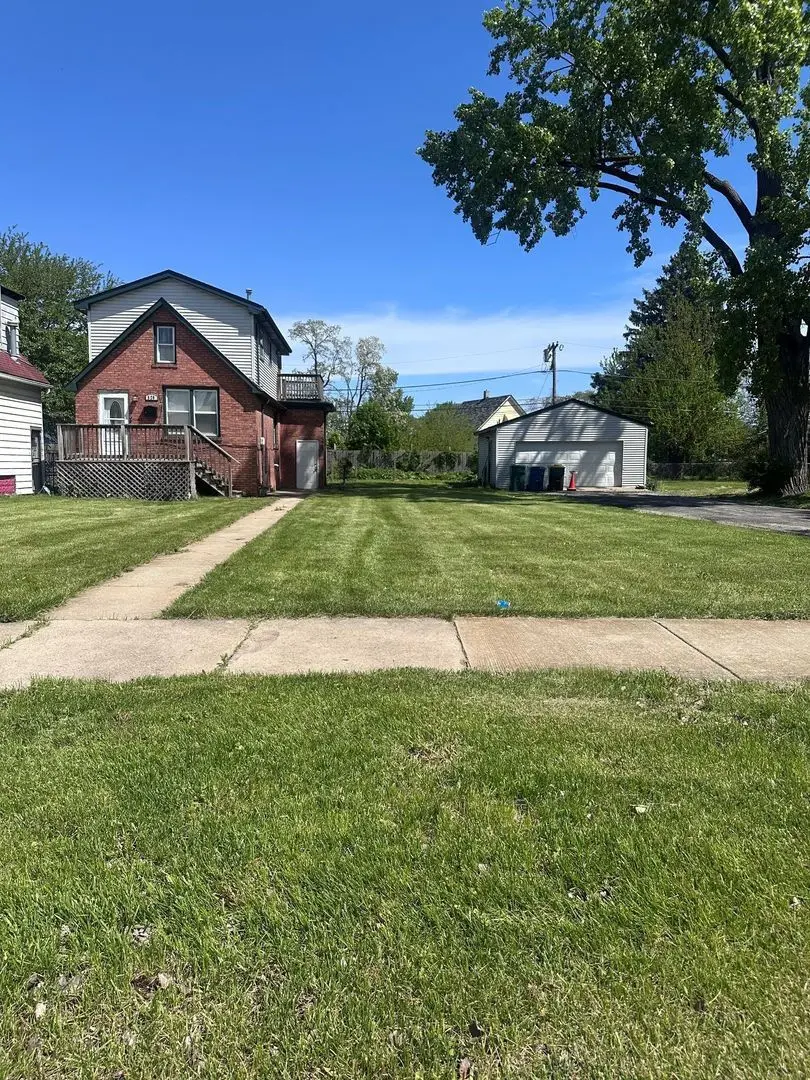
526 E 154th Pl · Phoenix, IL
Flood risk 1/10 · Minimal
- FEMA flood zone
- X (unshaded)
- Chance of flooding over 30 yrs
- 0.0%
- Est. flood insurance / yr
- $473 – $860
Fire risk 1/10 · Minimal
- Est. fire insurance / yr
- $804 – $1,492
Heat risk 3/10 · Minor
- Hot days now (above 101°F)
- 7 days/yr
- Hot days in 30 yrs
- 15 days/yr
Wind risk 2/10 · Minimal
- Chance of severe wind over 30 yrs
- —
Air-quality risk 4/10 · Minor
- Unhealthy air days now
- 4 days/yr
- Unhealthy air days in 30 yrs
- 5 days/yr
Risk factors via First Street. Map © Google.
Why this score? — see what drove the A- grade
The composite is a weighted blend of 9 inputs, each scored 0–100. Each bar is that input's sub-score; the figure is the points it added to the 100-point composite (weight × sub-score).
- Cash flow +30.0/30.0
- ARV discount +15.0/15.0
- 1% rule +10.0/10.0
- DSCR +10.0/10.0
- Appreciation +10.0/10.0
- Livability +3.8/5.0
- Rent growth +2.5/5.0
- Condition / age +2.5/5.0
- Schools +0.7/10.0
$125,000
🖨 Deal sheet 📄 Offer letter ✓ Due diligence
Listing remarks
Discover the potential of this charming 3-bed/2.1-bath home situated on a spacious double lot. The open-concept main floor offers a welcoming layout for everyday living and entertaining, along with a convenient main-level bedroom and full bathroom. Upstairs, the spacious primary suite features a private balcony overlooking the beautiful tree-lined street, while an additional bedroom completes the 2nd level. The full basement provides ample space for storage, recreation, a home office, or future expansion possibilities. With just a few finishing touches, this home is ready to shine. Do not miss this wonderful opportunity to add your personal style and make this property your own.
Key facts
- Private balcony
- Double lot
- Full basement
Tags
Property features AI
Finance
- Other: Possession at closing; Holds earnest money; Property provides homeowner tax exemption
- HOA & community: No master association fee required
Exterior
- Parking: Detached garage (owned); Asphalt driveway; Approximately 2.5 garage/parking spaces total
- Utilities: Water from Lake Michigan and public supply; Public sewer and mechanical septic; 200+ amp electric service with circuit breakers
- Home design: Detached single-family home; Two-story; Fee simple ownership; Built before 1978 (age approx. 61–70 years)
- Construction: Aluminum siding and brick exterior; Asphalt roof; Concrete perimeter foundation
- Exterior features: Patio; Porch; Lot dimensions approximately 75 x 125; Lot less than 0.25 acre; School bus service, commuter train access, interstate access
Interior
- Kitchen: Eating area / table space; Ceramic tile flooring in kitchen
- Bedrooms: Master bedroom (second level) — 15 x 15; Bedroom (second level) — 13 x 13; Bedroom (main level) — 13 x 10
- Flooring: Carpet in bedrooms and master; Wood laminate in living and dining areas; Ceramic tile in kitchen
- Bathrooms: Two full baths; One half bath; Soaking tub; Basement has a bathroom
- Heating & cooling: Natural gas heating
- Interior features: Six total rooms; Ceiling fan(s); Separate dining room; Unfinished full basement; Attic with dormer, full, interior stair
- Laundry & utility: Laundry room; Gas dryer hookup
Neighborhood map
What this means for you Summary
Snapshot
- This is a 3-bed/1.5-bath single-family listed at $125k.
Deal economics
- At list price, monthly cash flow is $628 ($8k/yr) — positive.
- The deal already cash-flows at list — no discount required.
- Meets the 1% rule at list price ($2k rent vs $125k).
- Recommended offer: $123k (1.5% below list) — sets the bar for market timing.
Location & tenants
- Location reads 75/100 on livability (#230 in IL, #4,248 nationally) — a middle-class / working-renter tenant base. Strengths: commute A+, cost of living A+, crime A-; Watch: health & safety C-, schools F, amenities F.
- Thornton Twp Hsd 205 (suburban): math 7% / reading 8% proficiency, ranked #594 of 620 in IL (top 96%) — low school quality limits family demand, transient renter base, plan for 1-2y turnover.
- Market conditions: 134 active listings in the ZIP; 3 comparable units currently listed for rent nearby; rentals at typical pace (median 25d on market — plan ~3-4 weeks tenant-placement turnaround); 6,272 units permitted in Cook County in 2024 (4,658 in 5+ unit buildings).
Forward outlook
- In year one you build about $13k of equity ($864 loan paydown + $12k appreciation (10.0% local appreciation)).
- At projected returns (10.0% appreciation + 3.0% rent growth), your $35k cash investment doubles in ~2 years — after that, you're playing with house money.
- By year 3, paydown + projected appreciation supports a ~$34k cash-out refi (75% LTV) — recoverable capital for the next deal without selling this one.
Negotiation context
- It's been on market 16 days — a 2% lower offer ($123k) is reasonable based on typical stale-listing flexibility.
- 5 sale attempts since 20y ago with the ask held roughly flat each time — persistent listings suggest the price (not the market) is what's stuck; bring a comps-based counter.
- Current owner paid $44k; list at $125k implies a 184% gain — meaningful room to come down on a strong offer.
Risks & watch-outs
- Watch-outs: property tax is 2.6% of price; built in 1958 — expect roof / HVAC / electrical / plumbing capex.
Questions for the listing agent
- Built in 1958 — when were the roof, HVAC, electrical panel, plumbing, and water heater last replaced?
- Property tax is high relative to price — has the assessment been appealed recently, and will the sale trigger a re-assessment?
- Is there a deadline driving the sale (1031 exchange, divorce, estate, relocation)? That informs how much negotiation room exists.
- Schools are F-rated, which usually means shorter tenancies and higher turnover. Who's the typical renter profile here, and what's been the actual vacancy rate?
- What's the average days-on-market for RENTAL listings here right now (not sales)? A rising rental-DOM trend means longer vacancies and softer asking-rent achievability than the comps imply.
- What's the recent tenant-quality profile in this submarket — average credit score on applications, eviction rate, late-payment / NSF rate, and stable-employment percentage? A property-management company in the area should have these aggregated.
- How much new for-sale + rental construction is in the pipeline within 1–3 miles? Heavy new supply typically softens prices + rents 12–24 months out; constrained supply supports both.
Investment metrics
- 1% rule
- 1.63% ✓
- Cap rate
- 12.33%
- Cash-on-cash
- 21.54%
- DSCR
- 1.96
- GRM
- 5.1
CMA / ARV
- ARV (on-the-fly)
- $175,827
- Comps found
- 12
Show comp detail 12 sales within ~0.75 mi
| Address | Dist | Beds/Ba | Sqft | Sold | Price | $/sf | Match |
|---|---|---|---|---|---|---|---|
| 15243 3rd Ave | 0.24mi | 3/1.0 | 1,182 (-5%) | 12mo | $40,000 | $34 | 68 |
| 536 E 155th St | 0.08mi | 4/2.0 (+1) | 1,423 (+14%) | 7mo | $245,000 | $172 | 60 |
| 15711 Lowe Ave | 0.39mi | 3/1.5 | 1,404 (+13%) | 2mo | $232,000 | $165 | 59 |
| 15624 Lowe Ave | 0.30mi | 2/1.0 (-1) | 1,322 (+6%) | 13mo | $135,000 | $102 | 58 |
| 910 E 152nd Pl | 0.58mi | 4/2.0 (+1) | 1,349 (+8%) | 0mo | $190,000 | $141 | 52 |
| 16012 Carol Ave | 0.74mi | 3/2.0 | 1,232 (-1%) | 14mo | $215,000 | $175 | 50 |
| 15131 6th Ave | 0.50mi | 3/1.0 | 1,064 (-15%) | 11mo | $75,000 | $70 | 42 |
| 15015 Riverside Dr | 0.63mi | 3/1.0 | 1,378 (+10%) | 13mo | $176,900 | $128 | 40 |
| 15330 7th Ave | 0.39mi | 4/1.5 (+1) | 1,098 (-12%) | 22mo | $115,000 | $105 | 38 |
| 14931 Riverside Dr | 0.71mi | 3/2.0 | 1,100 (-12%) | 9mo | $164,000 | $149 | 38 |
| 16005 Lowe Ave | 0.74mi | 3/2.0 | 1,114 (-11%) | 15mo | $167,000 | $150 | 33 |
| 15930 Carol Ave | 0.67mi | 3/1.0 | 1,400 (+12%) | 22mo | $195,000 | $139 | 28 |
Match score weights: distance 35% · size 25% · config 20% · recency 20%. Top-matched comps best support the ARV.
Projected returns pro-forma
10.0% appreciation · 3.0% rent growth · sell at horizon
- IRR
- 40.4%
- Equity multiple
- 4.09×
- Total profit
- $108,203
- Equity at exit
- $112,610
- IRR
- 34.9%
- Equity multiple
- 9.21×
- Total profit
- $287,374
- Equity at exit
- $242,848
Cash invested: $35,000 (down + closing). Projections, not guarantees.
Landlord ↔ Tenant lean methodology
- Overall (STATE)
- 43 Moderately Tenant-Leaning
- State Illinois
- 43 Moderately Tenant-Leaning · D+7
- County
- — inherits STATE
- City
- — inherits STATE
ZIP-level market 60426
- Home prices YoY
- 6.9%
- Active inventory
- 134
- Price-to-rent
- 5.1×
Monthly cashflow live
- Estimated rent
- $2,039 medium interval (Pro) →
- Mortgage (P&I)
- −$656
- Tax from tax record
- −$275 /mo · $3,302/yr
- Insurance
- −$52
- HOA
- −$0
- Vacancy / Maint / Mgmt
- −$428
- Net cashflow
- $628
Break-even live
UW: 25.0% down · 7.5% · 30yr · 1.5% tax · 5.0% vac · 8.0% maint · 8.0% mgmt
Financing live
Cash to close
- Down payment
- $31,250
- Closing costs
- $3,750
- Reserves months
- —
- Total cash needed
- —
Loan-product check · same deal, 3 products live
Conventional
25% down · 7.5% · 30yr
- Down + closing
- —
- Monthly P&I
- —
- Monthly cashflow
- —
- DSCR
- —
- Eligible?
- —
Personal DTI + credit; lowest rate.
DSCR
20% down · 8.5% · 30yr
- Down + closing
- —
- Monthly P&I
- —
- Monthly cashflow
- —
- DSCR
- —
- Eligible?
- —
No personal income docs; deal must DSCR.
Hard money
10% down · 12.0% · 12mo
- Down + closing
- —
- Monthly P&I
- —
- Monthly cashflow
- —
- DSCR
- —
- Eligible?
- —
Short-term bridge; refi at stabilization.
Rent comps 3 comps
| Address | Beds | Baths | Sqft | Rent | $/sqft | DOM | Units | Dist |
|---|---|---|---|---|---|---|---|---|
| 16048 Halsted St Unit 2 Harvey, IL | 3.0 | 1.0 | 1091 | $1,650 | $1.51 | 24d | 1 | 0.80mi |
| 14844 Wabash Ave Dolton, IL | 3.0 | 1.5 | 1277 | $2,320 | $1.82 | 24d | 1 | 1.30mi |
| 16125 Marshfield Ave Markham, IL | 3.0 | 1.0 | 1043 | $2,400 | $2.30 | 1d | 1 | 1.42mi |
Listing history 12 events
-
2026-06-18days on market $125,000 Active 16 DOM
-
2026-06-17days on market $125,000 Active 15 DOM
-
2026-06-16days on market $125,000 Active 14 DOM
-
2026-06-15days on market $125,000 Active 13 DOM
-
2026-06-13days on market $125,000 Active 11 DOM
-
2026-06-13days on market $125,000 Active 10 DOM
-
2026-06-09days on market $125,000 Active 7 DOM
-
2026-06-08days on market $125,000 Active 6 DOM
-
2026-06-07days on market $125,000 Active 5 DOM
-
2026-06-04days on market $125,000 Active 2 DOM
-
2026-06-03remarks 687-char remark
-
2026-06-03$125,000 Active 1 DOM
ⓘ Source: listings_history table (triggers on properties + properties_extension) + one-shot
backfill from property_details.listing_events for pre-trigger history.
Tax reassessment forecast IL · Partial reset (capped growth)
- Current annual tax
- $3,302 · $275/mo
- Projected year-2 tax
- $3,302 · $275/mo
- Expected delta
- $0/yr ($0/mo · 0.0%)
ⓘ Screening estimate from a state-policy table — verify with the county assessor before closing.
Climate risk First Street
- Flood 1/10 Low FEMA zone X (unshaded) · 0% chance over 30 yrs
- Wildfire 1/10 Low
- Heat 3/10 Moderate 7 d/yr ≥101°F today · 15 d/yr by 30 yrs out
- Wind 2/10 Low
- Air quality 4/10 Moderate 4 unhealthy d/yr today · 5 by 30 yrs out
Nearby sold comps map
Loading sold comps map…
Walkable amenities ~0.75 mi
Loading nearby amenities…
Taxation est. · year 1
- Rental income
- $24,473
- − Mortgage interest
- −$7,002
- − Property taxes
- −$3,302
- − Insurance
- −$625
- − Repairs & maintenance
- −$1,958
- − Management
- −$1,958
- − Depreciation
- −$3,636
- Taxable income
- $5,992
- Est. tax owed @ 24.0%
- −$1,438
- After-tax cash flow
- $6,102/yr
For passive investors: Depreciation is non-cash, so a rental often shows a tax loss while cash-flowing — sheltering income. Rental losses are passive: they offset passive income freely, and up to $25,000/yr can offset ordinary (W-2) income if you actively participate and your MAGI is under $100k (phasing out to $0 by $150k); unused losses carry forward. On sale, claimed depreciation is recaptured at up to 25%, and gains may owe capital-gains tax (a 1031 exchange can defer both). Figures are a year-1 estimate at your 24.0% rate — not tax advice; consult a CPA.
Schools (NCES district)
- District
- Thornton Twp Hsd 205
- NCES district ID
- 1738970
- Math proficiency
- 7% ▬ 0.00%
- Reading proficiency
- 8% ▼ -2.00%
- Median HH income
- $43,392
- Composite
- 6.92/100
- National rank
- #9976
- State rank
- #594 of 620 in IL
Livability — Phoenix
- Score
- 75/100
- State rank
- #230
- US rank
- #4248
Category grades
Schools grade is shown separately in the Schools card above.
Census & demographics
- Census place
- Phoenix, IL
- Population (ZIP)
- 23,066
Population outlook (Cook County) Hauer SSP2
- Today (2025)
- 5,347,519 people
- By 2030
- 5,357,703 · +0.2%
- By 2040
- 5,324,924 · -0.4%
- By 2050
- 5,230,762 · -2.2%
- By 2075
- 4,785,735 · -10.5%
- By 2100
- 4,188,836 · -21.7%
Race, ethnicity, and origin ACS 2023
- Neighborhood character
- Majority Black (59%)
- Race & ethnicity
- Black 59% Hispanic / Latino 33% Two or more races 12% White 3% Asian 2%
- Hispanic origin (detail)
- Mexican 31%
- Foreign-born
- 17% · Canada
- Languages at home
- 67% English-only · Spanish 30% Other Indo-European 2% French/Haitian/Cajun 1%
Political lean MEDSL · Cook
- 2024 margin
- Solid D (+42.0) · D 70.4% · R 28.4% · Other 1.2%
- 2008→2024 swing
- -11.4pp toward R · 2008: 53.4pp · 2024: 42.0pp
- All cycles
- 2024: D+42.0 2020: D+50.3 2016: D+53.0 2012: D+49.4 2008: D+53.4
Not yet ingested
- Civics
- —
Market trends
- HPI YoY
- ▲ 20.36%
- Current HPI
- 313.7895
- Rent YoY
- —
- Metro
- —
- State GDP YoY
- ▲ 1.59%
- F500 in state
- 60
Industry mix (Fortune 500 HQ in IL)
| Industry | F500 HQs | Revenue |
|---|---|---|
| Insurance | 4 | $201B |
|
||
| Consumer Goods | 4 | $87B |
|
||
| Industrial Machinery | 3 | $64B |
|
||
| Healthcare | 2 | $55B |
|
||
| Retail / Pharmacy | 1 | $148B |
|
||
| Agriculture / Food | 1 | $86B |
|
||
Price history
+257.1% since first listed13 events — show timeline
- 2026-06-02 Listed $125,000 MRED as Distributed by MLS Grid
- 2025-05-21 Listing Removed — MRED as Distributed by MLS Grid
- 2025-05-14 Listed — MRED as Distributed by MLS Grid
- 2008-06-06 Listing Removed — MRED as Distributed by MLS Grid
- 2008-06-02 Listing Removed — MRED as Distributed by MLS Grid
- 2008-06-02 Listed — MRED as Distributed by MLS Grid
- 2008-01-08 Listed — MRED as Distributed by MLS Grid
- 2007-04-18 Sold (Public Records) $44,000 Public Records
- 2007-04-10 Sold (MLS) $44,000 MRED as Distributed by MLS Grid
- 2007-02-22 Listing Removed — MRED as Distributed by MLS Grid
- 2006-11-02 Listed $48,880 MRED as Distributed by MLS Grid
- 2000-07-20 Sold (Public Records) $58,000 Public Records
- 1986-11-25 Sold (Public Records) $35,000 Public Records
Property tax history
+4.0%/yrLatest (2023): $3,302 · +210.0% YoY. Source: county tax records.
Cash-flow waterfall
monthlySold comps — $/sqft
last 12 mo · ≤1 miLoading sold comps…