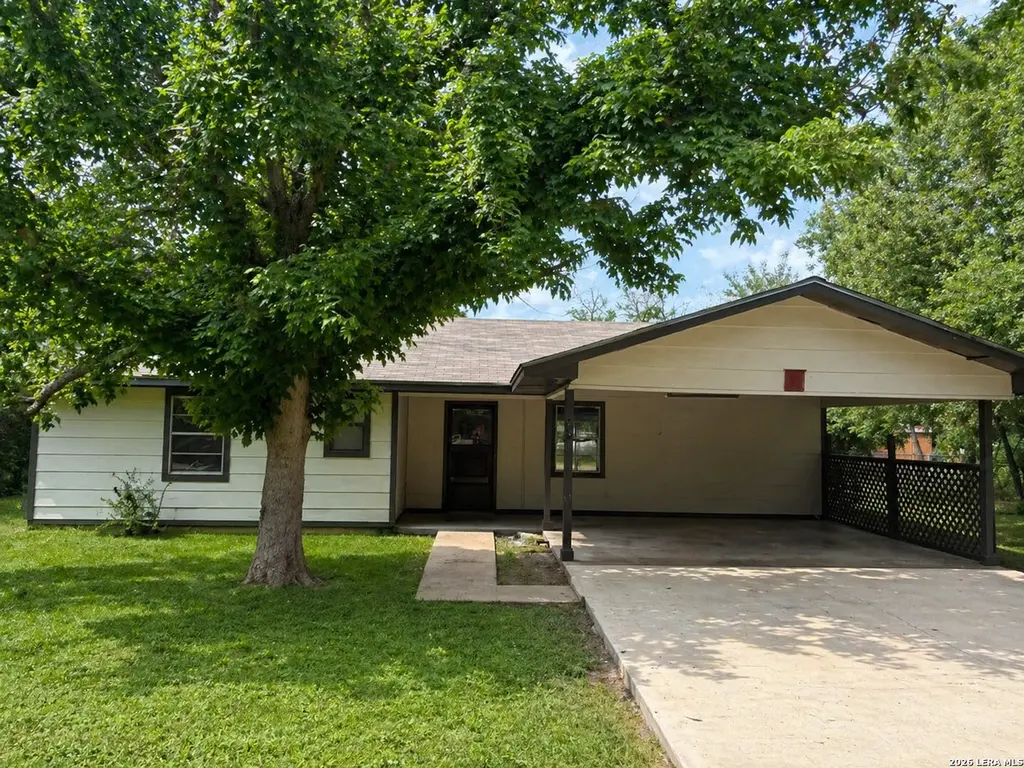
302 Booster St · Center Point, TX
Flood risk 1/10 · Minimal
- FEMA flood zone
- X (unshaded)
- Chance of flooding over 30 yrs
- 0.0%
- Est. flood insurance / yr
- $507 – $1,088
Fire risk 5/10 · Moderate
- Est. fire insurance / yr
- $1,222 – $2,270
Heat risk 7/10 · Major
- Hot days now (above 104°F)
- 7 days/yr
- Hot days in 30 yrs
- 23 days/yr
Wind risk 6/10 · Moderate
- Chance of severe wind over 30 yrs
- 61.0%
Air-quality risk 1/10 · Minimal
- Unhealthy air days now
- 0 days/yr
- Unhealthy air days in 30 yrs
- 0 days/yr
Risk factors via First Street. Map © Google.
Why this score? — see what drove the C+ grade
The composite is a weighted blend of 9 inputs, each scored 0–100. Each bar is that input's sub-score; the figure is the points it added to the 100-point composite (weight × sub-score).
- Cash flow +26.1/30.0
- DSCR +8.8/10.0
- 1% rule +6.3/10.0
- Appreciation +5.6/10.0
- ARV discount +4.9/15.0
- Schools +3.5/10.0
- Rent growth +2.5/5.0
- Livability +2.5/5.0
- Condition / age +2.5/5.0
$249,900
🖨 Deal sheet (PDF) 📄 Offer letter ✓ Due diligence
Listing remarks
This beautifully updated home offers modern finishes and small-town charm. This updated home has been thoughtfully improved to provide a fresh, clean, and inviting living space ready for you and your family ! The interior features updated flooring, fresh paint, new A/C, New WaterHeater, New Appliances and a functional layout filled with natural light. The kitchen has been refreshed with modern touches and ample workspace, while the bathrooms offer clean, updated finishes. Situated in a peaceful setting, this property provides a quiet lifestyle while still being conveniently located near Kerrville, Texas and the surrounding Hill Country amenities.
Key facts
- Fresh paint
- Natural light
- Ample workspace
Tags
Property features AI
Finance
- Financial info: Down payment assistance resource available
- HOA & community: Located in Elmwood Estates (ElMWOOD ESTATES)
Exterior
- Utilities: City water and sewer
- Home design: Wood/siding exterior; South-facing; Pre-owned; Recent rehab
- Construction: Approximately 45 years old; Slab foundation; Composition roof
- Exterior features: Covered patio; 1/4 to 1/2 acre lot
Interior
- Kitchen: Eat-in kitchen (10 x 12)
- Bedrooms: Master bedroom with ceiling fan and additional features noted in remarks (12 x 13); Bedroom 2 (10 x 11); Bedroom 3 (10 x 10)
- Flooring: Saltillo tile; Ceramic tile
- Bathrooms: Two full bathrooms; Master bath with separate tub and shower and single vanity (5 x 8)
- Heating & cooling: Central heating (electric); Central air conditioning; Window air conditioning
- Interior features: Ceiling fans; High ceilings; Living/dining room combination; Eat-in kitchen; All window coverings remain; Washer included; One living area
- Laundry & utility: Washer included
Neighborhood map
What this means for you Summary
Snapshot
- This is a 3-bed/2.0-bath single-family listed at $250k.
Deal economics
- At list price, monthly cash flow is $632 ($8k/yr) — positive.
- The deal already cash-flows at list — no discount required.
- Meets the 1% rule at list price ($3k rent vs $250k).
- Recommended offer: $246k (1.5% below list) — sets the bar for market timing.
- Cap rate 9.3% vs local median 2.3% in Center Point — top-decile yield for the area; either an underpriced asset or a hidden risk that comps aren't pricing in. Stress-test before assuming the spread holds.
Location & tenants
- Location reads: area grade C — affects rentability + tenant quality, not the cash-flow math above.
- Center Point ISD (rural): math 36% / reading 47% proficiency, ranked #359 of 826 in TX (top 44%) — families likely to look elsewhere, expect single-tenant / working-renter base with shorter leases; 65% free/reduced lunch — lower-income household profile, screen leases tightly.
- Zoned schools: Center Point El (math 42% / reading 37%, grade F, #1,545 of 4,322 statewide, top 38%, 265 students, 75% FRL); Center Point Middle (math 32% / reading 47%, grade F, #660 of 1,662 statewide, top 41%, 109 students, 74% FRL); Center Point H S (math 24% / reading 64%, grade F, #652 of 1,632 statewide, top 43%, 175 students, 65% FRL).
- Market conditions: 75 active listings in the ZIP; 422 units permitted in Kerr County in 2024 (322 in 5+ unit buildings).
Forward outlook
- In year one you build about $5k of equity ($2k loan paydown + $3k appreciation (1.1% local appreciation)).
- Kerr County population projected at +15% by 2050 — long-run rental-demand tailwind backs the buy-and-hold thesis.
- At projected returns (1.1% appreciation + 3.0% rent growth), your $70k cash investment doubles in ~6 years — after that, you're playing with house money.
- By year 7, paydown + projected appreciation supports a ~$30k cash-out refi (75% LTV) — recoverable capital for the next deal without selling this one.
Negotiation context
- It's been on market 26 days — a 2% lower offer ($246k) is reasonable based on typical stale-listing flexibility.
Risks & watch-outs
- Climate carrying-cost: major wind risk, 61% chance of damaging wind over 30y; moderate wildfire risk; extreme-heat days projected 7→23/yr by 2055 (HVAC capex compounding) — expect insurance premiums to compound above CPI over the hold.
Questions for the listing agent
- Is there a deadline driving the sale (1031 exchange, divorce, estate, relocation)? That informs how much negotiation room exists.
- What's the average days-on-market for RENTAL listings here right now (not sales)? A rising rental-DOM trend means longer vacancies and softer asking-rent achievability than the comps imply.
- What's the recent tenant-quality profile in this submarket — average credit score on applications, eviction rate, late-payment / NSF rate, and stable-employment percentage? A property-management company in the area should have these aggregated.
- How much new for-sale + rental construction is in the pipeline within 1–3 miles? Heavy new supply typically softens prices + rents 12–24 months out; constrained supply supports both.
Investment metrics
- 1% rule
- 1.13% ✓
- Cap rate
- 9.33%
- Cash-on-cash
- 10.84%
- DSCR
- 1.48
- GRM
- 7.4
CMA / ARV
- ARV (median comp)
- $236,067
- List price
- $249,900
- Delta
- 5.86%
- Verdict
- FAIR
- Comps
- 4 within 1.0 mi
Projected returns pro-forma
1.11% appreciation · 3.0% rent growth · sell at horizon
- IRR
- 12.9%
- Equity multiple
- 1.66×
- Total profit
- $46,283
- Equity at exit
- $86,773
- IRR
- 16.4%
- Equity multiple
- 3.01×
- Total profit
- $140,633
- Equity at exit
- $116,451
Cash invested: $69,972 (down + closing). Projections, not guarantees.
Landlord ↔ Tenant lean methodology
- Overall (STATE)
- 87 Strongly Landlord-Friendly
- State Texas
- 87 Strongly Landlord-Friendly · R+5
- County
- — inherits STATE
- City
- — inherits STATE
ZIP-level market 78010
- Home prices YoY
- 0.5%
- Active inventory
- 75
- Price-to-rent
- 7.4×
Monthly cashflow live
- Estimated rent
- $2,820 medium interval (Pro) →
- Mortgage (P&I)
- −$1,311
- Tax from tax record
- −$181 /mo · $2,170/yr
- Insurance
- −$104
- HOA
- −$0
- Lot rent
- −$0
- Vacancy / Maint / Mgmt
- −$592
- Net cashflow
- $632
Break-even live
Sensitivity live
| Price | -10% $774 | -5% $703 | +0% $632 | +5% $562 | +10% $491 |
|---|---|---|---|---|---|
| Rent | -10% $410 | -5% $521 | +0% $632 | +5% $744 | +10% $855 |
| Rate | -1.0pp $758 | -0.5pp $696 | base $632 | +0.5pp $568 | +1.0pp $502 |
UW: 25.0% down · 7.5% · 30yr · 1.5% tax · 5.0% vac · 8.0% maint · 8.0% mgmt
Financing live
Cash to close
- Down payment
- $62,475
- Closing costs
- $7,497
- Reserves months
- —
- Total cash needed
- —
Loan-product check · same deal, 3 products live
Conventional
25% down · 7.5% · 30yr
- Down + closing
- —
- Monthly P&I
- —
- Monthly cashflow
- —
- DSCR
- —
- Eligible?
- —
Personal DTI + credit; lowest rate.
DSCR
20% down · 8.5% · 30yr
- Down + closing
- —
- Monthly P&I
- —
- Monthly cashflow
- —
- DSCR
- —
- Eligible?
- —
No personal income docs; deal must DSCR.
Hard money
10% down · 12.0% · 12mo
- Down + closing
- —
- Monthly P&I
- —
- Monthly cashflow
- —
- DSCR
- —
- Eligible?
- —
Short-term bridge; refi at stabilization.
Listing history 2 events
-
2026-05-18historical Active Option 658-char remark
-
2026-04-30$249,900 New 658-char remark
ⓘ Source: listings_history table (triggers on properties + properties_extension) + one-shot
backfill from property_details.listing_events for pre-trigger history.
Tax reassessment forecast TX · Resets to sale price
- Current annual tax
- $2,170 · $181/mo
- Projected year-2 tax
- $4,573 · $381/mo
- Expected delta
- +$2,403/yr (+$200/mo · 110.7%)
ⓘ Screening estimate from a state-policy table — verify with the county assessor before closing.
Climate risk First Street
- Flood 1/10 Low FEMA zone X (unshaded) · 0% chance over 30 yrs
- Wildfire 5/10 Major
- Heat 7/10 Severe 7 d/yr ≥104°F today · 23 d/yr by 30 yrs out
- Wind 6/10 Major 61% chance of damaging wind over 30 yrs
- Air quality 1/10 Low 0 unhealthy d/yr today · 0 by 30 yrs out
Nearby sold comps map
Loading sold comps map…
Walkable amenities ~0.75 mi
Loading nearby amenities…
Taxation est. · year 1
- Rental income
- $33,840
- − Mortgage interest
- −$13,998
- − Property taxes
- −$2,170
- − Insurance
- −$1,250
- − Repairs & maintenance
- −$2,707
- − Management
- −$2,707
- − Depreciation
- −$7,270
- Taxable income
- $3,738
- Est. tax owed @ 24.0%
- −$897
- After-tax cash flow
- $6,691/yr
For passive investors: Depreciation is non-cash, so a rental often shows a tax loss while cash-flowing — sheltering income. Rental losses are passive: they offset passive income freely, and up to $25,000/yr can offset ordinary (W-2) income if you actively participate and your MAGI is under $100k (phasing out to $0 by $150k); unused losses carry forward. On sale, claimed depreciation is recaptured at up to 25%, and gains may owe capital-gains tax (a 1031 exchange can defer both). Figures are a year-1 estimate at your 24.0% rate — not tax advice; consult a CPA.
Schools (NCES district)
- District
- Center Point ISD
- NCES district ID
- 4813350
- Math proficiency
- 36% ▼ -11.00%
- Reading proficiency
- 47% ▲ 4.00%
- Median HH income
- $47,127
- Composite
- 35.42/100
- National rank
- #4939
- State rank
- #359 of 826 in TX
Livability — Center Point
No livability data for this city. (Only ~50 U.S. cities are tracked.)
Census & demographics
- Census place
- Center Point, TX
- Population (ZIP)
- 3,819
Population outlook (Kerr County) Hauer SSP2
- Today (2025)
- 54,010 people
- By 2030
- 55,651 · +3.0%
- By 2040
- 58,923 · +9.1%
- By 2050
- 62,117 · +15.0%
- By 2075
- 71,809 · +33.0%
- By 2100
- 77,004 · +42.6%
Race, ethnicity, and origin ACS 2023
- Neighborhood character
- Diverse neighborhood (Simpson 0.57)
- Race & ethnicity
- White 54% Hispanic / Latino 38% Two or more races 26% Asian 1%
- Hispanic origin (detail)
- Mexican 36%
- Common ancestry
- Romanian 5% Lithuanian 2% Serbian 2%
- Foreign-born
- 15% · Canada, Jamaica
- Languages at home
- 70% English-only · Spanish 30%
Political lean MEDSL · Kerr
- 2024 margin
- Solid R (+54.3) · D 22.4% · R 76.8%
- 2008→2024 swing
- -4.8pp toward R · 2008: -49.6pp · 2024: -54.3pp
- All cycles
- 2024: R+54.3 2020: R+51.7 2016: R+56.3 2012: R+59.1 2008: R+49.6
Not yet ingested
- Civics
- —
Market trends
- HPI YoY
- ▲ 1.11%
- Current HPI
- 226.9684
- Rent YoY
- —
- Metro
- —
- State GDP YoY
- ▲ 3.95%
- F500 in state
- 110
Industry mix (Fortune 500 HQ in TX)
| Industry | F500 HQs | Revenue |
|---|---|---|
| Energy | 16 | $1,198B |
|
||
| Technology | 5 | $198B |
|
||
| Engineering / Construction | 4 | $72B |
|
||
| Energy Services | 3 | $60B |
|
||
| Utilities | 3 | $41B |
|
||
| Healthcare | 2 | $330B |
|
||
Price history
3 events — show timeline
- 2026-05-26 Pending — LERA
- 2026-05-18 Contingent — LERA
- 2026-04-30 Listed $249,900 LERA
Property tax history
+6.5%/yrLatest (2025): $2,170 · +7.5% YoY. Source: county tax records.
Cash-flow waterfall
monthlySold comps — $/sqft
last 12 mo · ≤1 miLoading sold comps…