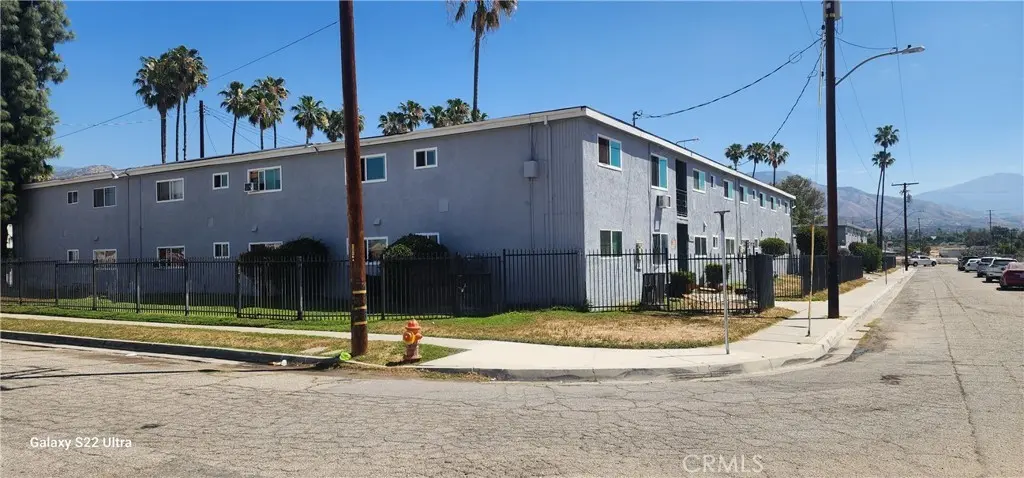
 Fourplex
1414 Citrus · San Bernardino, CA
Flood risk 6/10 · Moderate
- FEMA flood zone
- X
- Chance of flooding over 30 yrs
- 0.67%
- Est. flood insurance / yr
- $507 – $1,088
Fire risk 8/10 · Major
- Est. fire insurance / yr
- $659 – $1,223
Heat risk 8/10 · Major
- Hot days now (above 101°F)
- 7 days/yr
- Hot days in 30 yrs
- 20 days/yr
Wind risk 1/10 · Minimal
- Chance of severe wind over 30 yrs
- —
Air-quality risk 10/10 · Severe
- Unhealthy air days now
- 25 days/yr
- Unhealthy air days in 30 yrs
- 31 days/yr
Risk factors via First Street. Map © Google.
Why this score? — see what drove the F grade
The composite is a weighted blend of 9 inputs, each scored 0–100. Each bar is that input's sub-score; the figure is the points it added to the 100-point composite (weight × sub-score).
- ARV discount +7.5/15.0
- Schools +3.1/10.0
- Livability +3.0/5.0
- Rent growth +2.7/5.0
- Condition / age +2.5/5.0
- Cash flow +0.0/30.0
- 1% rule +0.0/10.0
- DSCR +0.0/10.0
- Appreciation +0.0/10.0
$6,480,000
🖨 Deal sheet 📄 Offer letter ✓ Due diligence
Multi-family units
County records classify this as Multi-Family (5+ Unit). Listing-text estimate: 4 units. estimate disagrees with records
5+ unit building — per-unit beds/baths from public records are typically unavailable; the breakdown below (if shown) is an estimate from the listing text.
Listing remarks MLS
Stable, low maintenance, gated with high occupancy. Carports, laundry room. Located on a quiet street close to freeway and all daily amenities. Solid cash flow in a San Bernardino infill location. Priced to sell quick with an aggressive Cap Rate. All new windows, over 70% new roof and 95% upgraded all 2 beds one bath units with granite countertops, new cabinetry, and attractive vinyl flooring.
Key facts
- Quiet street
- Laundry room
- New cabinetry
Tags
Neighborhood map
What this means for you Summary
Snapshot
- This is a 4 × 2-bed/1-bath units multifamily listed at $6.48M.
Deal economics
- At list price, monthly cash flow is $-36k ($-429k/yr) — negative. Per door: $-9k/mo.
- To cash-flow at today's rent, offer at most $796k (87.7% below list).
- To meet the 1% rule (rent ≥ 1% of price), the offer needs to be $696k (89.3% below list).
- Recommended offer: $696k (89.3% below list) — sets the bar for 1% rule.
- Cap rate -0.3% vs local median 3.5% in San Bernardino — below-typical yield; the buyer is paying a premium for something (appreciation thesis, condition, location) that the cap rate doesn't capture.
Location & tenants
- Location reads 59/100 on livability (#661 in CA) — a working-class tenant base; expect higher turnover. Strengths: commute A+, housing A; Watch: schools D, employment D, crime F.
- San Bernardino City Unified (urban): math 27% / reading 40% proficiency, ranked #959 of 1,400 in CA (top 68%) — families likely to look elsewhere, expect single-tenant / working-renter base with shorter leases; 81% free/reduced lunch — lower-income household profile, screen leases tightly.
- Market conditions: Rents flat; 102 active listings in the ZIP; 5,458 units permitted in San Bernardino County in 2024 (1,500 in 5+ unit buildings).
- At $6,965/mo this rent would consume 125% of the median local household income ($67k/yr) (locally 3423% of renters already pay >50% of income on rent) — very limited rent-growth headroom before tenants either downsize or default.
Forward outlook
- Local home prices are declining (-3.0%/yr); year-one equity from $45k of loan paydown is wiped out by about $194k of value loss. Plan a longer hold.
- San Bernardino County population projected at +15% by 2050 — modest demand growth; plan on rents tracking national, not racing it.
Negotiation context
- It's been on market 54 days — a 3% lower offer ($6.29M) is reasonable based on typical stale-listing flexibility.
- 5 sale attempts since 8y ago with the ask held roughly flat each time — persistent listings suggest the price (not the market) is what's stuck; bring a comps-based counter.
- Current owner paid $4.00M; list at $6.48M implies a 62% gain — meaningful room to come down on a strong offer.
Risks & watch-outs
- Climate carrying-cost: major flood risk; severe wildfire risk; extreme-heat days projected 7→20/yr by 2055 (HVAC capex compounding) — expect insurance premiums to compound above CPI over the hold.
Questions for the listing agent
- What do current leases actually rent for vs. the listed asking? Can we see a recent rent roll and the last 12 months of T-12 income?
- It's been on market 54 days. Have you received any prior offers? Is the seller open to a 89% concession, seller financing, or rate buy-down credit?
- Can we see the unit-by-unit rent roll, current vacancy, and any below-market leases? What's the average tenancy length?
- What capital expenditures (roof, boiler, parking lot, exteriors) have been made in the last 5 years, and what's planned in the next 2?
- Built in 1963 — when were the roof, HVAC, electrical panel, plumbing, and water heater last replaced?
- Is there a deadline driving the sale (1031 exchange, divorce, estate, relocation)? That informs how much negotiation room exists.
- Schools are D-rated, which usually means shorter tenancies and higher turnover. Who's the typical renter profile here, and what's been the actual vacancy rate?
- Crime grade is F in this area — have there been break-ins, vandalism, or insurance claims at this property in the last 3 years? What carrier currently insures it and at what premium?
- The area grade is low — what's the realistic commute time and amenity access for the typical tenant pool here? Any planned neighborhood developments (good or bad) we should know about?
- What's the average days-on-market for RENTAL listings here right now (not sales)? A rising rental-DOM trend means longer vacancies and softer asking-rent achievability than the comps imply.
- What's the recent tenant-quality profile in this submarket — average credit score on applications, eviction rate, late-payment / NSF rate, and stable-employment percentage? A property-management company in the area should have these aggregated.
- How much new apartment / multifamily construction is in the pipeline within 1–3 miles? Heavy new supply (>2% of stock underway) typically softens rents 12–24 months out; light construction supports rent growth.
Investment metrics
- 1% rule
- 0.11% ✗
- Cap rate
- -0.32%
- Cash-on-cash
- -23.62%
- DSCR
- -0.05
- GRM
- 77.5
CMA / ARV
No comps found within radius.
Projected returns pro-forma
-3.0% appreciation · 0.98% rent growth · sell at horizon
- IRR
- -69.0%
- Equity multiple
- -0.84×
- Total profit
- $-3,340,763
- Equity at exit
- $966,189
- IRR
- —
- Equity multiple
- -2.25×
- Total profit
- $-5,901,349
- Equity at exit
- $560,272
Cash invested: $1,814,400 (down + closing). Projections, not guarantees.
Landlord ↔ Tenant lean methodology
- Overall (STATE)
- 18 Strongly Tenant-Friendly
- State California
- 18 Strongly Tenant-Friendly · D+13
- County
- — inherits STATE
- City
- — inherits STATE
ZIP-level market 92404
- Rents YoY
- 1.0%
- Active inventory
- 102
- Price-to-rent
- 310.1×
Monthly cashflow live
- Estimated rent
- $6,965 medium interval (Pro) →
- Mortgage (P&I)
- −$33,982
- Tax from tax record
- −$4,536 /mo · $54,437/yr
- Insurance
- −$2,700
- HOA
- −$0
- Vacancy / Maint / Mgmt
- −$1,463
- Net cashflow
- $-35,716
Break-even live
4-unit breakdown (identical units grouped — click to expand)
| Units | Beds | Baths | Est. rent |
|---|---|---|---|
| 4× units | 2 | 1 | $6,964 |
| #1 | 2 | 1 | $1,741 |
| #2 | 2 | 1 | $1,741 |
| #3 | 2 | 1 | $1,741 |
| #4 | 2 | 1 | $1,741 |
| Total (4 units) | $6,965 | ||
UW: 25.0% down · 7.5% · 30yr · 1.5% tax · 5.0% vac · 8.0% maint · 8.0% mgmt
Financing live
Cash to close
- Down payment
- $1,620,000
- Closing costs
- $194,400
- Reserves months
- —
- Total cash needed
- —
Loan-product check · same deal, 3 products live
Conventional
25% down · 7.5% · 30yr
- Down + closing
- —
- Monthly P&I
- —
- Monthly cashflow
- —
- DSCR
- —
- Eligible?
- —
Personal DTI + credit; lowest rate.
DSCR
20% down · 8.5% · 30yr
- Down + closing
- —
- Monthly P&I
- —
- Monthly cashflow
- —
- DSCR
- —
- Eligible?
- —
No personal income docs; deal must DSCR.
Hard money
10% down · 12.0% · 12mo
- Down + closing
- —
- Monthly P&I
- —
- Monthly cashflow
- —
- DSCR
- —
- Eligible?
- —
Short-term bridge; refi at stabilization.
Listing history 28 events
-
2026-06-18days on market $6,480,000 Active 54 DOM
-
2026-06-17days on market $6,480,000 Active 53 DOM
-
2026-06-16days on market $6,480,000 Active 52 DOM
-
2026-06-15days on market $6,480,000 Active 51 DOM
-
2026-06-13days on market $6,480,000 Active 49 DOM
-
2026-06-09days on market $6,480,000 Active 45 DOM
-
2026-06-08days on market $6,480,000 Active 44 DOM
-
2026-06-07days on market $6,480,000 Active 43 DOM
-
2026-06-04days on market $6,480,000 Active 40 DOM
-
2026-06-03days on market $6,480,000 Active 39 DOM
-
2026-06-02days on market $6,480,000 Active 38 DOM
-
2026-06-01days on market $6,480,000 Active 37 DOM
-
2026-05-31days on market $6,480,000 Active 36 DOM
-
2026-04-25$6,480,000 Active 396-char remark
Show marketing remark (396 chars)
Stable, low maintenance, gated with high occupancy. Carports, laundry room. Located on a quiet street close to freeway and all daily amenities. Solid cash flow in a San Bernardino infill location. Priced to sell quick with an aggressive Cap Rate. All new windows, over 70% new roof and 95% upgraded all 2 beds one bath units with granite countertops, new cabinetry, and attractive vinyl flooring.
-
2024-08-16historical
-
2024-05-07$6,995,000 Active
-
2020-01-22soldstatus $3,995,000 Closed Sale
-
2020-01-22status Pending Sale
-
2019-05-14$3,995,000 Active
-
2018-06-28soldstatus $3,300,000 Closed Sale
-
2018-06-28soldstatus $3,300,000
-
2018-06-27soldstatus $3,200,000
-
2018-05-15status Pending Sale
-
2018-03-14price $3,425,000
-
2018-02-01$3,500,000 Active
-
2018-02-01$3,425,000
-
2017-04-13soldstatus $2,700,000
-
2015-06-08soldstatus $1,896,000
ⓘ Source: listings_history table (triggers on properties + properties_extension) + one-shot
backfill from property_details.listing_events for pre-trigger history.
Tax reassessment forecast CA · Resets to sale price
- Current annual tax
- $54,437 · $4,536/mo
- Projected year-2 tax
- $54,437 · $4,536/mo
- Expected delta
- $0/yr ($0/mo · 0.0%)
ⓘ Screening estimate from a state-policy table — verify with the county assessor before closing.
Climate risk First Street
- Flood 6/10 Major FEMA zone X · 67% chance over 30 yrs
- Wildfire 8/10 Severe
- Heat 8/10 Severe 7 d/yr ≥101°F today · 20 d/yr by 30 yrs out
- Wind 1/10 Low
- Air quality 10/10 Extreme 25 unhealthy d/yr today · 31 by 30 yrs out
Nearby sold comps map
Loading sold comps map…
Walkable amenities ~0.75 mi
Loading nearby amenities…
Taxation est. · year 1
- Rental income
- $83,580
- − Mortgage interest
- −$362,981
- − Property taxes
- −$54,437
- − Insurance
- −$32,400
- − Repairs & maintenance
- −$6,686
- − Management
- −$6,686
- − Depreciation
- −$188,509
- Taxable loss
- −$568,119
- Est. tax savings @ 24.0%
- +$136,349
- After-tax cash flow
- $-292,242/yr
For passive investors: Depreciation is non-cash, so a rental often shows a tax loss while cash-flowing — sheltering income. Rental losses are passive: they offset passive income freely, and up to $25,000/yr can offset ordinary (W-2) income if you actively participate and your MAGI is under $100k (phasing out to $0 by $150k); unused losses carry forward. On sale, claimed depreciation is recaptured at up to 25%, and gains may owe capital-gains tax (a 1031 exchange can defer both). Figures are a year-1 estimate at your 24.0% rate — not tax advice; consult a CPA.
Schools (NCES district)
- District
- San Bernardino City Unified
- NCES district ID
- 0634170
- Math proficiency
- 27% ▲ 1.00%
- Reading proficiency
- 40% ▬ 0.00%
- Median HH income
- $39,758
- Composite
- 30.8/100
- National rank
- #11385
- State rank
- #959 of 1400 in CA
Livability — San Bernardino
- Score
- 59/100
- State rank
- #661
- US rank
- #20479
Category grades
Schools grade is shown separately in the Schools card above.
Census & demographics
- Census place
- San Bernardino, CA
- County
- San Bernardino County · 2,030,291 people
- City population
- 255,614
- Metro
- Riverside-San Bernardino-Ontario, CA
- Population (ZIP)
- 63,243
- Household income
- $66,701
- Rent vs Own
- Severe rent burden
- 3423.0
Population outlook (San Bernardino County) Hauer SSP2
- Today (2025)
- 2,300,329 people
- By 2030
- 2,378,907 · +3.4%
- By 2040
- 2,523,137 · +9.7%
- By 2050
- 2,642,388 · +14.9%
- By 2075
- 2,880,769 · +25.2%
- By 2100
- 2,909,436 · +26.5%
Race, ethnicity, and origin ACS 2023
- Neighborhood character
- Predominantly Hispanic (69%)
- Race & ethnicity
- Hispanic / Latino 69% White 16% Two or more races 15% Black 10% Asian 3% Native American 1%
- Hispanic origin (detail)
- Mexican 57%
- Common ancestry
- Lithuanian 1% Iranian 1%
- Foreign-born
- 22% · Canada, Vietnam
- Languages at home
- 46% English-only · Spanish 50% Vietnamese 1% Tagalog/Filipino 1%
Political lean MEDSL · San Bernardino
- 2024 margin
- Toss-up / Even · D 47.5% · R 49.7% · Other 2.8%
- 2008→2024 swing
- -8.5pp toward R · 2008: 6.3pp · 2024: -2.1pp
- All cycles
- 2024: R+2.1 2020: D+10.7 2016: D+9.8 2012: D+5.4 2008: D+6.3
Not yet ingested
- Civics
- —
Market trends
- HPI YoY
- ▼ -538.78%
- Current HPI
- 478.0652
- Rent YoY
- ▲ 0.98%
- Metro
- Riverside-San Bernardino-Ontario, CA
- State GDP YoY
- ▲ 3.21%
- F500 in state
- 116
Industry mix (Fortune 500 HQ in CA)
| Industry | F500 HQs | Revenue |
|---|---|---|
| Technology | 27 | $1,492B |
|
||
| Financial Services | 3 | $174B |
|
||
| Retail | 3 | $44B |
|
||
| Insurance | 3 | $26B |
|
||
| Media / Entertainment | 2 | $115B |
|
||
| Pharmaceuticals / Biotech | 2 | $62B |
|
||
Price history
+241.8% since first listed15 events — show timeline
- 2026-04-25 Listed $6,480,000 CRMLS
- 2024-08-16 Listing Removed — CRMLS
- 2024-05-07 Listed $6,995,000 CRMLS
- 2020-01-22 Sold (MLS) $3,995,000 CRMLS
- 2020-01-22 Pending — CRMLS
- 2019-05-14 Listed $3,995,000 CRMLS
- 2018-06-28 Sold (MLS) $3,300,000 SDMLS
- 2018-06-28 Sold (MLS) $3,300,000 CRMLS
- 2018-06-27 Sold (Public Records) $3,200,000 Public Records
- 2018-05-15 Pending — CRMLS
- 2018-03-14 Price Changed $3,425,000 CRMLS
- 2018-02-01 Listed $3,425,000 SDMLS
- 2018-02-01 Listed $3,500,000 CRMLS
- 2017-04-13 Sold (Public Records) $2,700,000 Public Records
- 2015-06-08 Sold (Public Records) $1,896,000 Public Records
Property tax history
+9.4%/yrLatest (2025): $54,437 · +2.1% YoY. Source: county tax records.
Cash-flow waterfall
monthlySold comps — $/sqft
last 12 mo · ≤1 miLoading sold comps…